USD/JPY Technical Analysis - 4h Chart (Jul 24, 2025)
Key Observations:
Price Action (4h Close):
Open (O): 146.545
High (H): 146.660
Low (L): 146.448
Close (C): 146.473
Change: -0.036 (-0.028%) → Slight bearish momentum.
50% - Order Block:
Indicates a key retracement level where institutional traders may have placed orders.
Current price near 146.473 suggests potential consolidation or reversal if this level holds.
Profit Levels (Potential Targets):
Bullish Scenario (if USD strengthens):
147.170 → Minor resistance
147.956 → Stronger resistance
148.637 & 150.140 → Major upside targets
Bearish Scenario (if JPY strengthens):
146.450 → Immediate support
145.780 → Next key support
Context:
August Seasonal Trend: JPY often sees volatility in August due to fiscal flows and BoJ policy expectations.
Trading View Indicator: Likely referencing a custom strategy (e.g., breakout/mean reversion).
Trading Bias:
Neutral to Slightly Bearish (price closed below open, testing mid-range levels).
Watch 146.450 (support) and 147.170 (resistance) for breakout confirmation.
Key Levels:
Resistance Support
147.170 146.450
147.956 145.780
148.637
Actionable Idea:
A break below 146.450 could target 145.780.
A rebound above 147.170 opens path to 147.956.
Wave Analysis

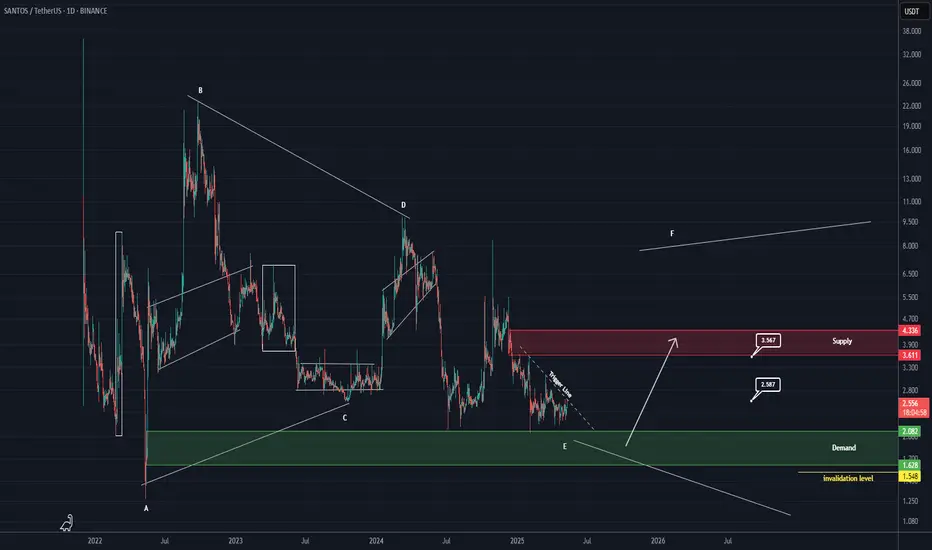
SANTOS ANALYSIS (1D)Football-related tokens in the crypto market have been quiet for a while and seem to be dormant. One of the tokens that shows good inflow during its moves is SANTOS.
SANTOS appears to be forming a symmetrical triangle and is currently at the end of wave E. While there are multiple wave count scenarios for this token, it is sitting on a strong support zone.
As long as it holds the green zone, it has the potential to move toward the targets.
However, a daily candle closing below the invalidation level will invalidate this analysis.
For risk management, please don't forget stop loss and capital management
When we reach the first target, save some profit and then change the stop to entry
Comment if you have any questions
Thank You
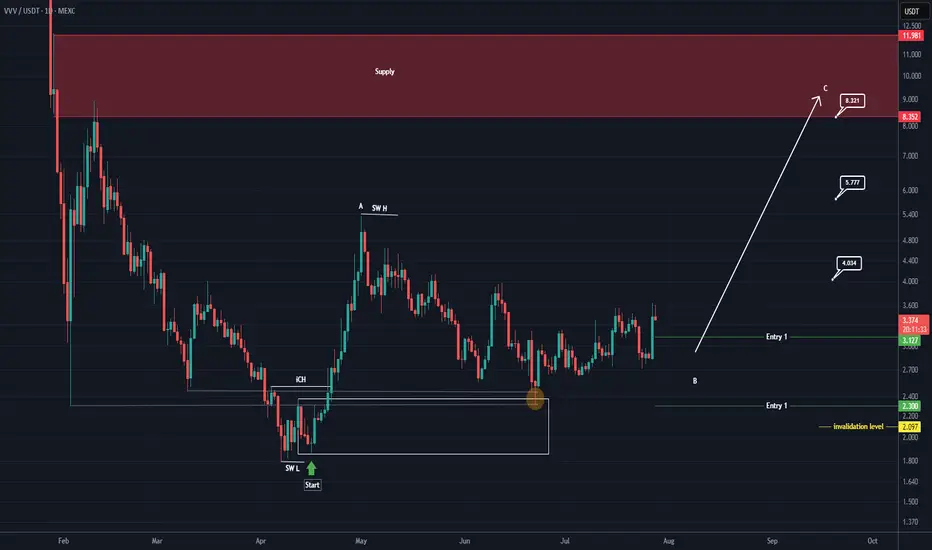
VVV Looks Bullish (1D)From the point where we placed the red arrow on the chart, it seems that the bullish phase VVV has begun.
This phase can be considered as an ABC structure.
We appear to be in the late stages of wave B.
We have identified two entry points to join the continuation of the bullish phase VVV. The likelihood of Entry 2 being reached is low, but you should split the volume you want to invest in this coin into two parts and keep some for Entry 2.
The targets are marked on the chart.
A daily candle closing below the invalidation level will invalidate this analysis.
For risk management, please don't forget stop loss and capital management
When we reach the first target, save some profit and then change the stop to entry
Comment if you have any questions
Thank You
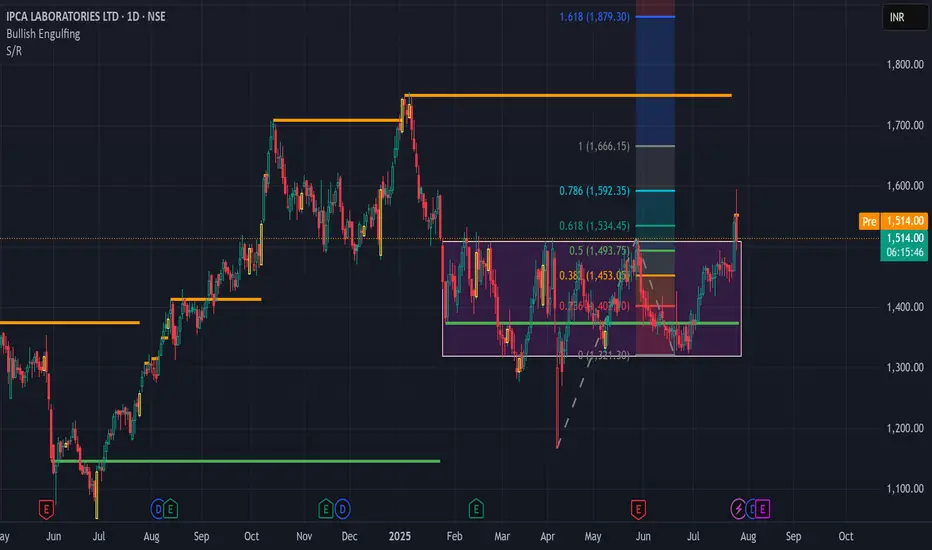
pcalabs BreakoutNSE:IPCALAB is making a Multi-month High. You can buy once it crosses 1552 and 1st Target would 1666. You can keep Second Target as 1800, provided try to achieve the same using Trailing Stoploss.
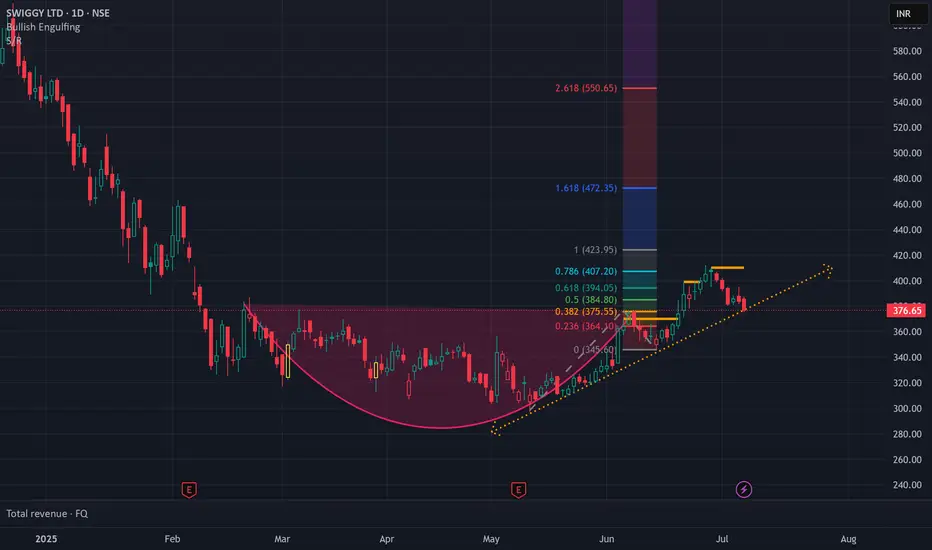
SWIGGY Breaking out of Rouding Bottom PatternNSE:SWIGGY is breaking out of Rouding Bottom Pattern. You can Buy at 398 and Target for 420. Keep Stop loss at 370. The Points that you will gain here is 22 points and since the stock price is less, you can invest a little more and try gaining more profit.
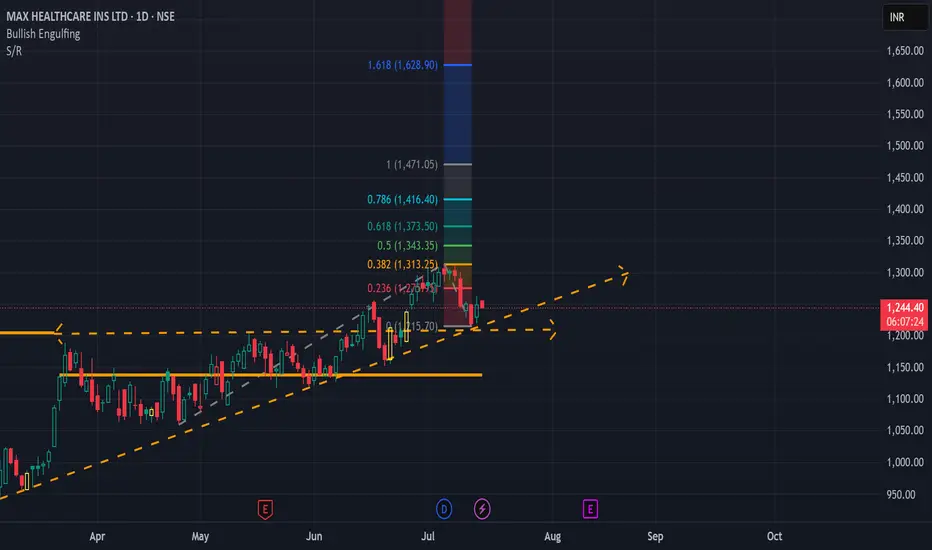
MAXHEALTH in BreakoutNSE:MAXHEALTH in breakout. You can Buy at 1265 and 1st Target would be 1470 and with trailing Stoploss you can achieve Second Target which would be 1600.
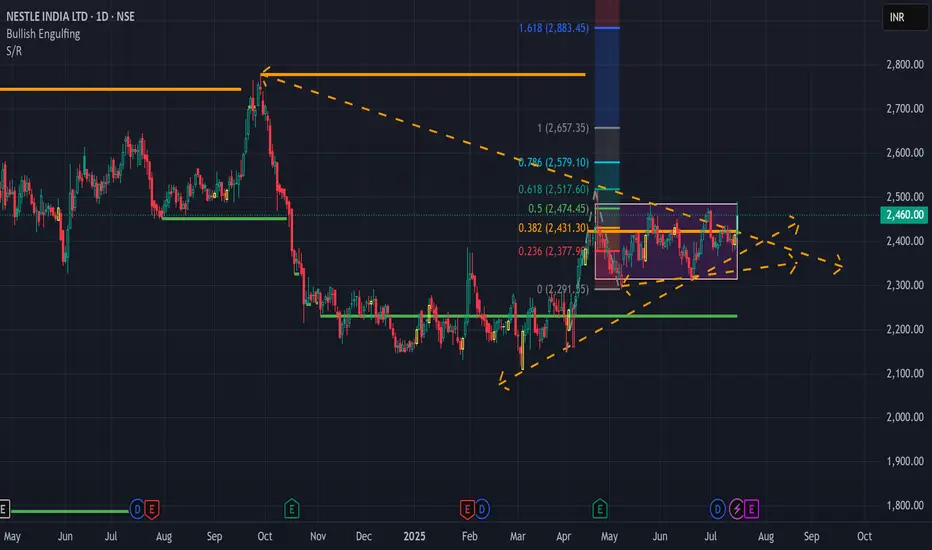
Nestle India in BreakoutNSE:NESTLEIND shows a breakout of a bullish ascending traingle trend. You can enter at 2460 and Target for 2640.
BEPRO ? Next GAMESTOP of cryptocurrencies
Hi
Watch it.
Is THIS the most underpriced speculating cryptocurrency?
www.kucoin.com
Listed : 18 Dec 2019
HIGH : 100$ per Bepro
Current : 0.0002000 approximate
GAMESTOP didn't have the sales numbers, but it had a lot of speculators.
From $2.57 to $483 in 2021
Market has always been unfair and irrational.
If you think it's fair .. how could BTC be priced at $0.06 /2010 $1.00 /2011
Digital picture for 1B$ .. what??
Speculation and crowd movement is real.
Since June 2025. We saw heavy purchases of Bepro (refer chart)
This momentum will build up and absorb sellers.
Below I had summary on Bepro.
Acc holder 30% :0xd6216fc19db775df9774a6e33526131da7d19a2c
Ref :https://coinmarketcap.com/currencies/bepro-network
Value: $500k ++
Background major hodl :https://etherscan.io/address/0xd6216fc19db775df9774a6e33526131da7d19a2c
Portfolio worth : $200m
This is a sophisticated trader/ investor.
Market cap Bepro: $2.06M as at 28/7/2025
Holders worldwide >10K.
Website : bepro.network
Previous owners Justin Wu : www.binance.com
tradingview.sweetlogin.com
Type : Bepro real life users on google.
FB : bepro
Linkdn: bepro
NB: This is a speculation
Like I said all my post. I am not a guru.
You are masters of your own trades.
Do your own research.

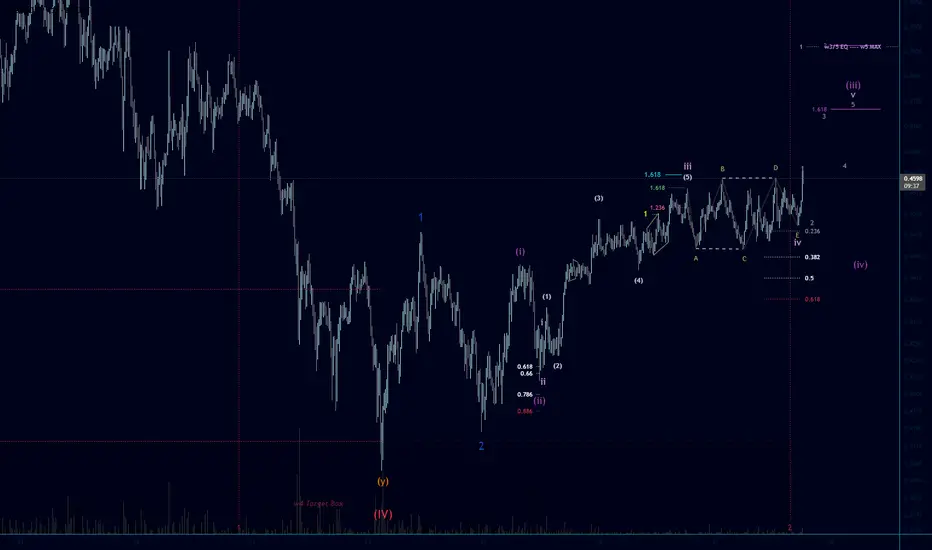
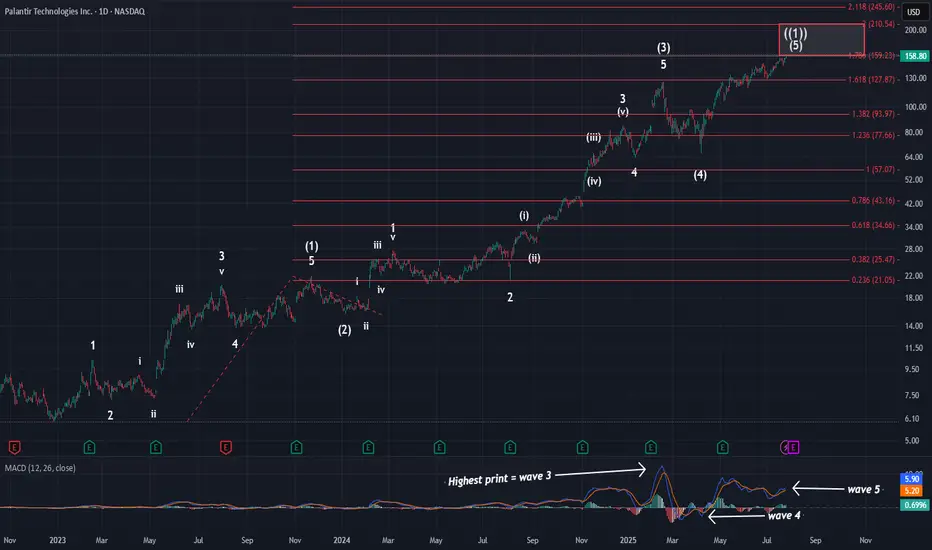
PalantirOn Friday, price hit the 1.236 extension and the larger red 1.786 extension @ $159. Tonight, I wanted to zoom out to show you where price is in the grand scheme of things. As you can see, we have all of the needed waves in place to consider this larger pattern complete. We have finally hit the standard target box for primary wave ((1)), and almost finished on what I am calling a smaller degree ED. This means that the reversal is soon at hand and that the initial move lower will be swift.
This primary wave ((1)) has lasted over 2.5 years. However, there is no way to predict exactly how long primary wave ((2)) will last. It could be short, or it could be long. Primary waves typically last months to even years to complete. Given the length of wave ((1)), I think it is safe to say wave ((2)) is likely to last over 1 year at the minimum. When our consolidation does kick off, we should be targeting the $50-$80 range for completion. Again, that won't happen fast. I will very likely take at least a year to complete.
For now, though, in the short term this pattern is putting the finishing touches on. Seeing this zoomed out picture again hopefully puts into perspective exactly how close we are to completion.
P.S: Looking at MACD, you can see I have labeled the larger waves. You can also see how much hidden bearish div we have at this time.
KEMANA GOLD KEDEPAN NYA ?📊 Technical Analysis – XAUUSD (July 28, 2025)
Elliott Wave Structure – Triangle (ABCDE):
The chart clearly shows a contracting triangle pattern (ABCDE), which commonly appears during corrective waves (usually Wave 4 or Wave B in a larger degree).
Currently, price seems to have just completed Wave E, and it's showing early signs of a bounce from the triangle's lower support.
If this wave count is valid, we could expect a bullish breakout soon, continuing the previous trend (most likely upward if this is part of Wave (5)).
🧭 Key Support and Resistance Levels:
Triangle Support (Wave E area):
Around $3,325 – $3,336 (price is currently testing this zone)
Potential Bullish Targets (if breakout occurs):
🎯 $3,374
🎯 $3,414
🎯 $3,498 – $3,500 (major resistance zone / Wave 5 target)
🧠 Fundamental Outlook Supporting Gold (Forward-Looking)
✅ Bullish Drivers:
Fed Rate Cut Expectations (Late 2025):
Slowing inflation → Rate cuts expected → Positive for gold.
Weaker US Dollar:
A weaker dollar makes gold cheaper for international buyers → Bullish.
Global Geopolitical Tensions:
Rising uncertainty supports gold as a safe haven asset.
⚠️ Bearish Risks:
Strong US economic data (e.g., NFP beats or rising inflation) could lead to the Fed staying hawkish → Negative for gold.
If price breaks below triangle support ($3,325), the triangle structure would be invalidated and a larger correction could unfold.
📝 Summary & Trading Strategy:
Direction Entry Area Stop Loss TP 1 TP 2 TP 3
✅ Buy (preferred) $3,330 – $3,336 Below $3,310 $3,374 $3,414 $3,498–$3,500
❌ Sell (if breakdown) Below $3,320 Above $3,340 $3,265 $3,245 $3,118

Is USDCHF Ready to Drop? Short Setup Explained📉 USDCHF Trade Idea Breakdown
Taking a close look at USDCHF, we’re currently in a clear downtrend 🔻. Price is under pressure on the higher timeframes, but on the lower timeframes (15m & 30m), we’re seeing a pullback 🌀.
What I’m watching for now is a rejection at resistance 🔄 followed by a bearish break in market structure ⛔️. If that confirms, I’ll be looking to take a short entry with targets set at the two previous lows marked out in the video 🎯📉.
Stop loss placement would be just above the recent swing high for risk management 🛑.
As always — this is not financial advice ⚠️.

Gold under pressure as USD strengthensGold is facing significant selling pressure as the US dollar regains momentum. Currently, XAU/USD is trading near $3,337, down over $31 from the session high, and pressing directly against the ascending trendline.
The stronger USD is making gold—an asset that yields no interest—less attractive to investors. If this dollar strength continues, the likelihood of a trendline break and further downside is very high.
On the economic front, U.S. jobless claims have fallen to their lowest level in three months, signaling a resilient labor market despite sluggish hiring. This stable jobs data is expected to support the Fed’s decision to hold interest rates steady at 4.25–4.50% in the upcoming policy meeting, even amid rising inflation pressure driven by President Donald Trump’s tariff policies.
At this moment, sellers are in control. Traders should closely watch upcoming support zones and trading volume to spot reasonable entry points.
Good luck!

XAUUSD 4H Has Finished Triangle Pattern #elliotwaveXAUUSD has finished its ABCDE correction in triangle pattern. Price will soon to test the previous $3,500 all time high area. It will required some big news as fundamental to boost the gold price up.
At the time this idea published, price still making lower low and lower high which is the downtrend pattern, but I believe it will soon break the structure and see higher high and higher low as the uptrend confirmation.

SELL EURUSD for bullish trend reversal SELL EURUSD for bullish trend reversal
STOP LOSS : 1.1808
Trade trade is based on false breakout and divergence.....
First what is false breakout, A false breakout in Forex occurs when the price breaks through a key level (like support or resistance) but quickly reverses and returns to its original range, often trapping traders who were expecting a continuation of the breakout. It's essentially a false signal, indicating a potential trend reversal or continuation, but the price doesn't follow through....
Secondly what is divergence ,In forex trading, divergence occurs when the price of a currency pair moves in one direction, while a technical indicator (like an oscillator) moves in the opposite direction. This mismatch can signal a potential trend reversal or weakening trend. There are two main types: bullish and bearish divergence.
On this trade we are taking it because we saw regular bearish divergence
Regular Bearish Divergence
In case of Regular Bearish Divergence:
* The Indicator shows Lower Highs
* Actual Market Price shows Higher Highs
We can see a strong divergence on the RSI already and There is a strong trend reversal on the daily time frame chart.....
The daily time frame is showing strength of trend reversal from this level resistance so we are looking for the trend reversal and correction push from here .....

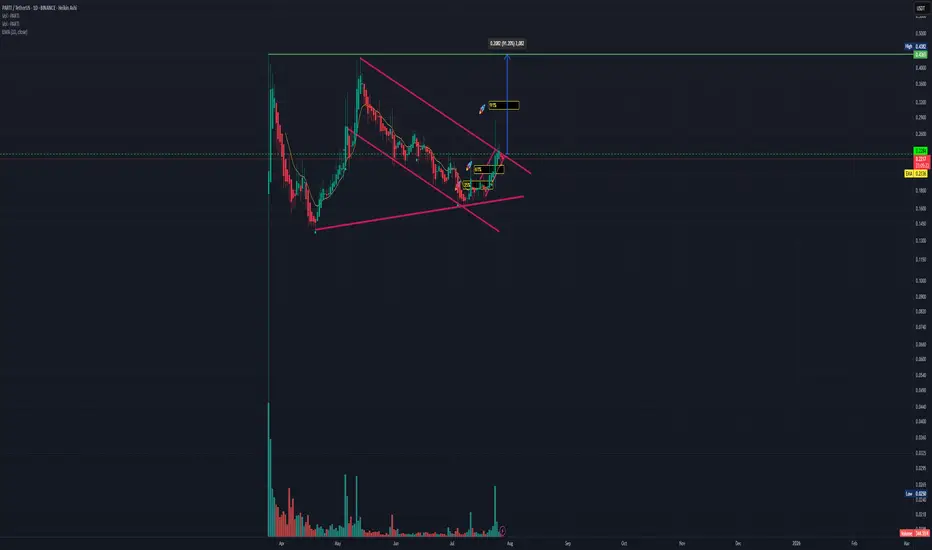
$PARTI #PARTI PARTIUSDT #LONG Shorterm ascendencyBreaking through layers of resistance a 91% increase in price from current levels is expected until the price reaches ATH. Thereafter the line of least resistance is no more as new buyers climb on board after profit taking or a retest of previous level, then the next leg up commences. Timeframe is several weeks.
Current wave phase is D, with E terminating at ATH
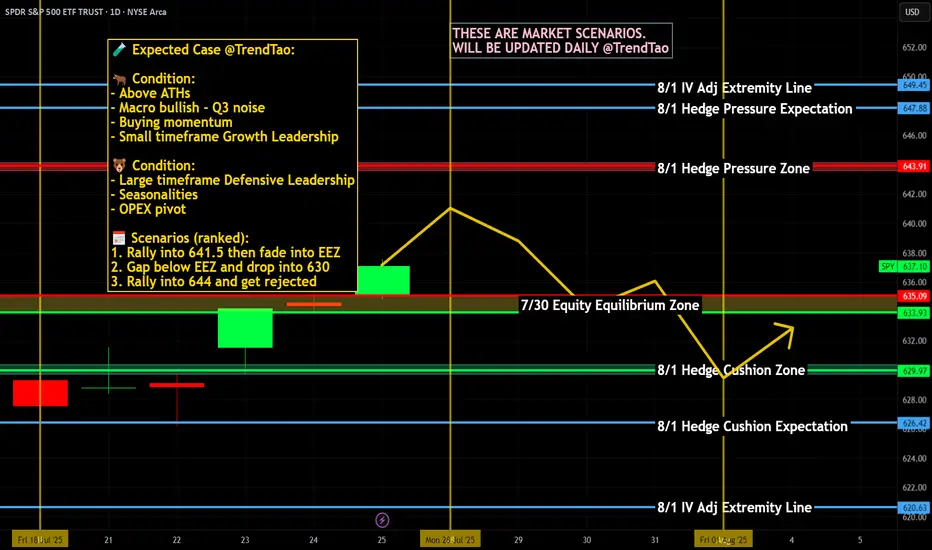
Weekly $SPY / $SPX Scenarios for July 28–August 1, 2025🔮 Weekly AMEX:SPY / SP:SPX Scenarios for July 28–August 1, 2025 🔮
🌍 Market‑Moving News 🌍
🏦 Fed Holds Steady, Faces Political Pressure
The Federal Reserve is expected to keep rates at 4.25%–4.50% during its FOMC meeting midweek. While rates are unchanged, political pressure from President Trump continues as calls intensify for rate cuts and questions arise over the Fed’s independence—including dissent from Governors Waller and Bowman.
📦 Trade Truce Extends & New Deal With EU
A new trade framework with the EU reduces tariffs to 15%, easing tensions. Meanwhile, U.S. and Chinese trade teams begin talks in Stockholm on Monday aiming to avoid an early-August tariff deadline.
💻 Tech and Mega-Cap Earnings Spotlight
This week features earnings from tech giants including Meta, Microsoft (Wednesday), followed by Amazon and Apple (Thursday). Markets will prioritize forward guidance around AI investments, capital expenditures, and sales trends.
📊 Key Data Releases & Events 📊
📅 Monday, July 28
No major releases
📅 Tuesday, July 29
Chicago PMI (July flash) – early indicator of regional manufacturing trends.
Global PMIs – flash readings for Europe and Asia gauge economic health.
📅 Wednesday, July 30
FOMC Rate Decision & Powell Press Conference – investors will scrutinize tone, forward guidance on rates, labor markets, and inflation.
Q2 U.S. GDP (Advance Estimate) – expected at ~1.9%, signaling rebound after Q1 contraction.
📅 Thursday, July 31
June PCE & Core PCE Indexes – Fed’s preferred inflation measure. Core PCE expected at ~2.7% YoY.
Consumer Confidence (July) – key for household spending trends.
Trade Balance (June) – provides data on U.S. import/export dynamics.
📅 Friday, August 1
July Nonfarm Payrolls, Unemployment & Wage Data – forecast for ~102,000 new jobs and ~4.2% unemployment; markets await for labor-market cooling signs.
Tariff Deadline – new tariffs loom unless trade agreements with EU, Canada, China etc. materialize by today’s cutoff.
⚠️ Disclaimer:
This summary is educational and informational only. It is not financial advice. Always consult a licensed financial advisor before making any investment decisions.
📌 #trading #stockmarket #economy #Fed #earnings #inflation #tariffs #GDP #PCE #jobs #technicalanalysis
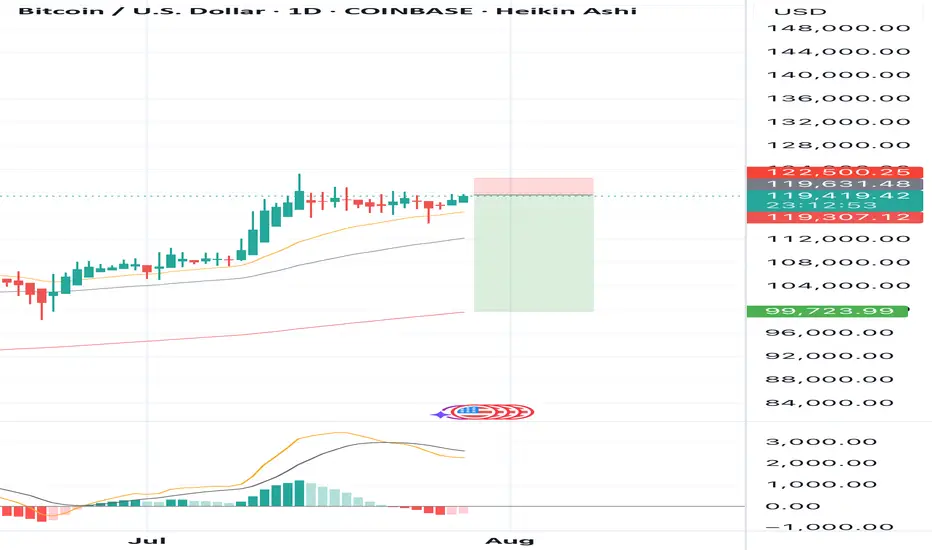
SELL BTCUSD for bullish trend reversal SELL BTCUSD for bullish trend reversal
STOP LOSS : 122,500
Trade trade is based on false breakout and divergence.....
First what is false breakout, A false breakout in Forex occurs when the price breaks through a key level (like support or resistance) but quickly reverses and returns to its original range, often trapping traders who were expecting a continuation of the breakout. It's essentially a false signal, indicating a potential trend reversal or continuation, but the price doesn't follow through....
Secondly what is divergence ,In forex trading, divergence occurs when the price of a currency pair moves in one direction, while a technical indicator (like an oscillator) moves in the opposite direction. This mismatch can signal a potential trend reversal or weakening trend. There are two main types: bullish and bearish divergence.
On this trade we are taking it because we saw regular bearish divergence
Regular Bearish Divergence
In case of Regular Bearish Divergence:
* The Indicator shows Lower Highs
* Actual Market Price shows Higher Highs
We can see a strong divergence on the RSI already and There is a strong trend reversal on the daily time frame chart.....
The daily time frame is showing strength of trend reversal from this level resistance so we are looking for the trend reversal and correction push from here .....
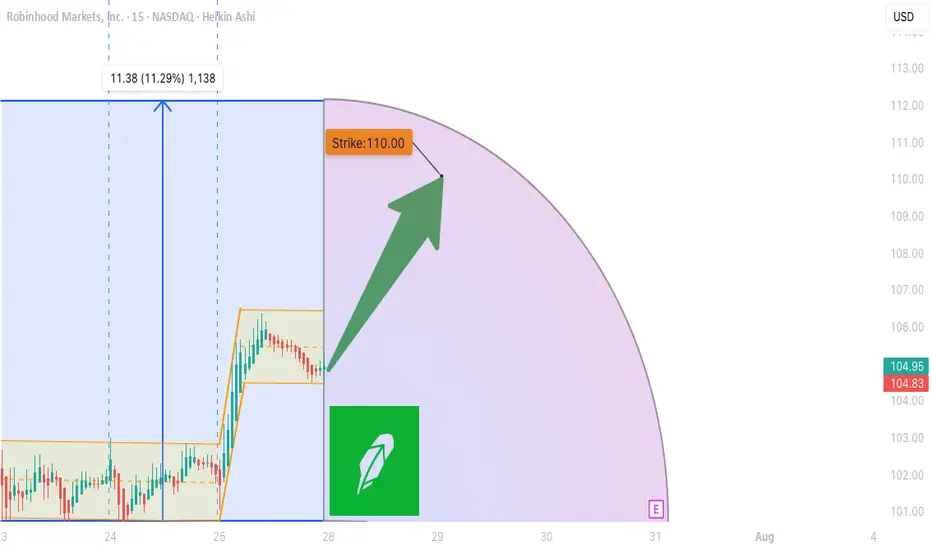
HOOD WEEKLY TRADE IDEA (07/27/2025)
**🚨 HOOD WEEKLY TRADE IDEA (07/27/2025) 🚨**
**BULLISH OPTIONS FLOW MEETS EVENT RISK CAUTION**
📊 **Options Flow Snapshot:**
📈 **Call Volume > Put Volume**
🧮 **Call/Put Ratio: 2.30** → **Institutional Bullish Flow**
📈 **Momentum Readings:**
* 🟢 **Daily RSI: Bullish**
* 🟡 **Weekly RSI: Mixed to Weak**
➡️ *Momentum is short-term positive, but not confirmed long-term*
📉 **Volume Insight:**
* **Only 0.7x** last week’s volume
➡️ *Lack of participation = ⚠️ caution*
🌪️ **Volatility Environment:**
* ✅ **Low VIX = Great Entry Timing**
* ❗ Fed Meeting ahead = Binary Event Risk
---
🔍 **Model Consensus:**
All 5 models (Grok, Claude, Gemini, Meta, DeepSeek) say:
🟢 **Moderately Bullish Bias**
✅ Bullish options flow
✅ Daily RSI uptrend
⚠️ Weak volume + Fed caution
---
💥 **TRADE SETUP (Confidence: 65%)**
🎯 **Play:** Long Call
* **Strike**: \$110
* **Expiry**: Aug 1, 2025
* **Entry**: ≤ \$2.90
* **Profit Target**: \$5.80 (🟢 100%)
* **Stop Loss**: \$1.47 (🔻50%)
📆 Entry: **Market Open Monday**
📦 Size: 1 Contract
📈 Risk-Reward Ratio: \~1:2
---
🧠 **Key Risks:**
* 📉 Volume Weakness = No confirmation
* ⚠️ **FED Event Risk** = Watch for Wednesday volatility
* ⏳ Theta decay as expiry nears
---
📌 **JSON TRADE DETAILS (for bots/scripts):**
```json
{
"instrument": "HOOD",
"direction": "call",
"strike": 110.0,
"expiry": "2025-08-01",
"confidence": 0.65,
"profit_target": 5.80,
"stop_loss": 1.47,
"size": 1,
"entry_price": 2.90,
"entry_timing": "open",
"signal_publish_time": "2025-07-27 15:09:35 EDT"
}
```
---
🔥 Stay sharp. Ride the flow, respect the risk.
👀 Watch volume + Fed headlines!
💬 Tag your team: \ NASDAQ:HOOD Bulls loading?
\#HOOD #OptionsTrading #UnusualOptions #FedWeek #WeeklyTradeSetup #TradingView #StockMarket
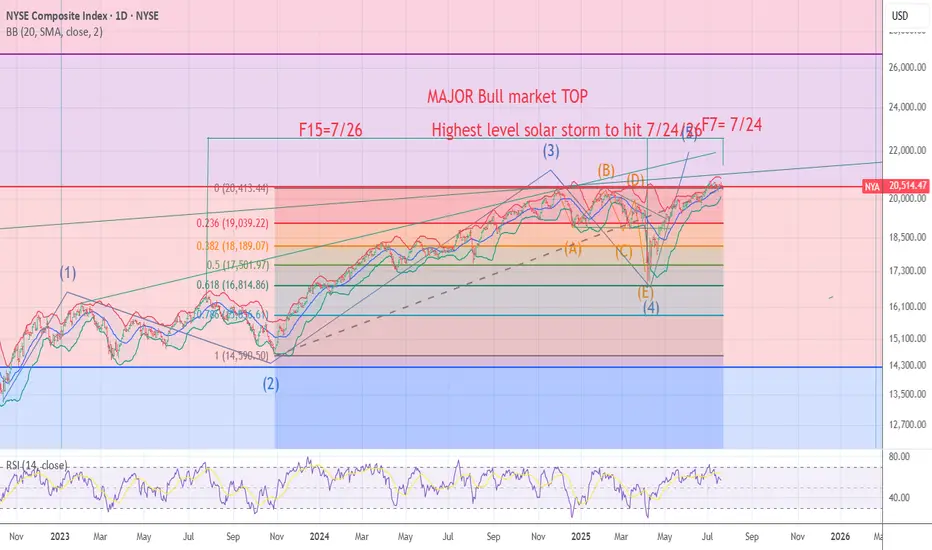
NYA chart Posted The signal for the Top is hours away .7/24/7/26The chart posted is my work based on the golden ratio and SPIRAL calendar work .We will be hit by one of if not the highest ever solar storms from 7/24 to 7/26 I will be re shorting into this date And will look for the markets worldwide to see a massive event .I have been talking a massive earthquake and the markets to begin a drop into OCT 10 to the 20th . best of trades .Wavetimer
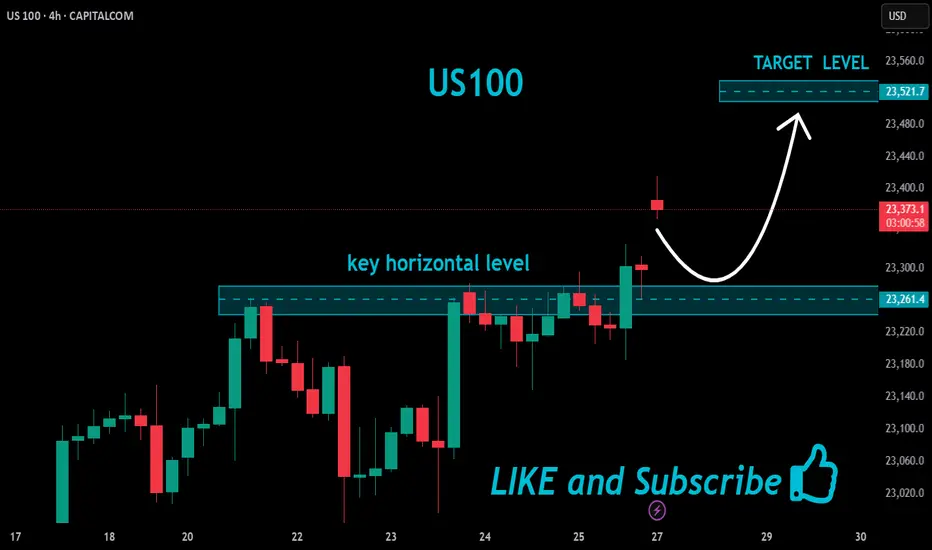
US100 Bullish Breakout!
HI,Traders !
#US100 is trading in a strong
Uptrend and the price made a
Bullish breakout of the key
Horizontal level of 23261.4
So we are bullish biased
And we will be expecting a
Further bullish move up !
Comment and subscribe to help us grow !
CC LongCC1! is now net long on the regression break.
The roll on this pair long is +9%.
I am considering this trade.

Arbitrum Bullish Elliott Wave Scenario! It seems the wave 4 Expanding Flat correction idea (previous post) played out well with our fib time and price targets! Always a good thing to have the right look in your wave count, fib time and price projections paired with the Elliott Wave rules and guidelines... its a whole other feel to my trading psychology and it gives me more confidence in the end. Breaking to the upside in the first of a few nested wave 3s, so i expect a bullish run up. (Keep in mind we finished red wave 4 just past the 1:1 fib time), if we are in a complex wave 4 still, it could easily extend to the 4 fib time without affecting probabilities. Starting to love this haha. Happy Trading 🌊🧙♂️