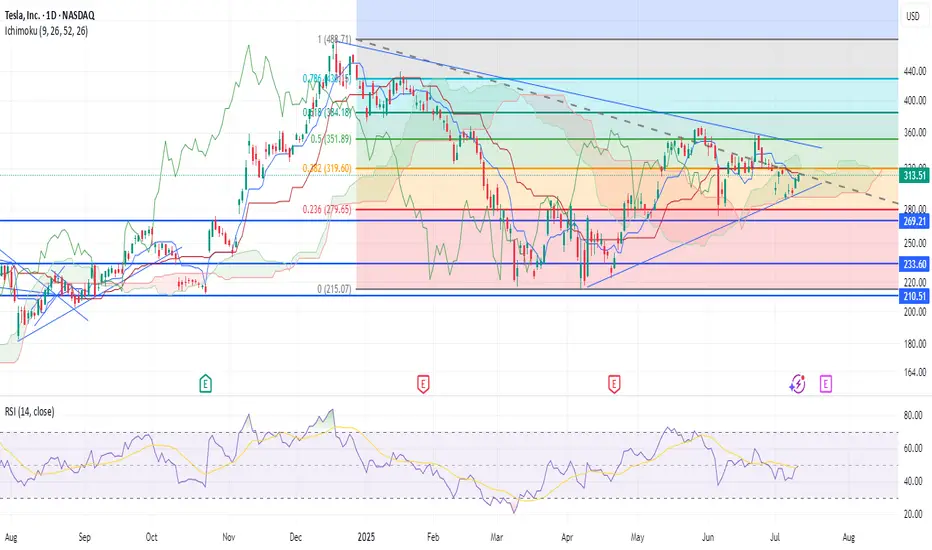
TSLA BUY+++ WEDGE FORMING $339 first targetTSLA, like AAPL, is forming a bullish wedge which likely will break to the upside. First target is $339 at wedge resistance then will reevaluate
Wave Analysis
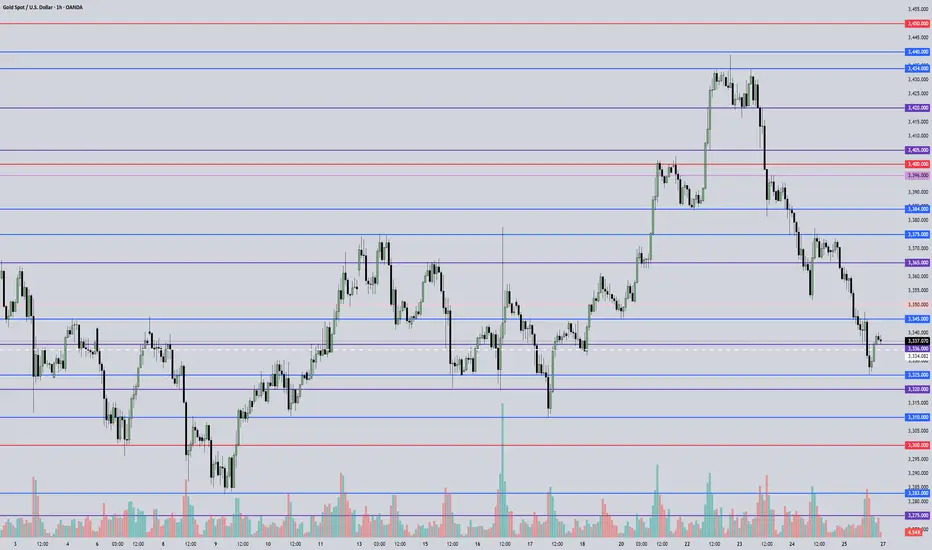
July 28, 2025 - XAUUSD GOLD Analysis and Potential OpportunitySummary:
Price action remains weak after last week's bearish close, with 3440 acting as a clear resistance level. While bulls have lost momentum, bears have not yet taken full control — 3310 and 3283 are key support zones to watch.
Price is currently reacting near 3339,
• Above 3345, the plan is to buy on pullbacks.
• Below 3332, switch to selling rallies.
Expect a potential bounce after the recent sharp decline from 3420 to 3385, but stay cautious near resistance zones like 3385–3400, as consolidation or rejection may occur.
🔍 Key Levels to Watch:
• 3384 – Resistance
• 3375 – Key resistance
• 3365 – Resistance
• 3345 – Intraday key resistance
• 3325 – Intraday key support
• 3310 – Support
• 3300 – Psychological level
• 3283 – Critical support
📈 Intraday Strategy:
• SELL if price breaks below 3332 → target 3325, then 3320, 3310, 3300
• BUY if price holds above 3345 → target 3350, then 3365, 3375, 3384
👉 If you find this helpful or traded using this plan, a like would mean a lot and keep me motivated. Thanks for the support!
Disclaimer: This is my personal view, not financial advice. Always use proper risk control.
XAUUSD Update - Continuation to Break the Bermuda triangle ?on the last week, we could see that triangle pattern has been breakout.
This week, it will continuation to break more higher ?
Let the chart answer it...if 3380's level could be touch, it's a first symptom of reversal to upside movement.
At the bottom side of triangle, we could see that it still respect to the bottom trend line.
Have a blessing week a head !

$VET Vetchain - A very generous Bullish scenario (ShortTerm)NOT FINANCIAL ADVICE
This is a very generous idea that considers the bullish scenario for $VET.
The risk/reward ratio is 7.5 (317% upside vs42.5% downside).
However, this is only due to the really high beta that NYSE:VET posits.
It's a risky trade, sure, but the rewards are sweet -- if this plays out.

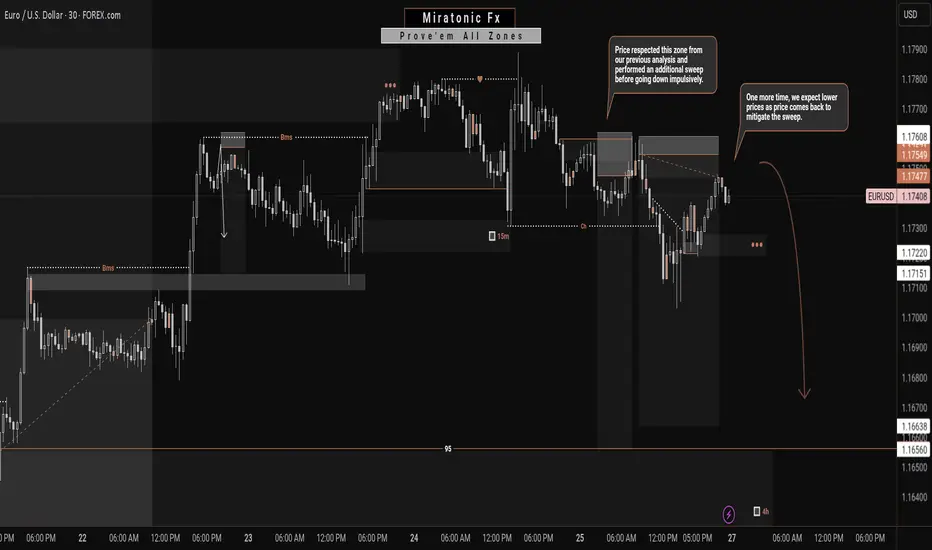
EURUSD: A Bearish Continuation?From my previous analysis, we anticipated a short-term decline on the EURUSD for a Daily bearish pullback. Price respected our zone and made a even stronger sweep before plummeting as forecasted.
Currently, price has returned to mitigate that liquidity sweep. Given the prior impulsive bearish move—which this current bullish correction stems from—we expect another drop, targeting the weak structure below for a potential liquidity grab or continuation.
We'll continue to monitor how price behaves around the current levels, but unless there's a significant shift in momentum, our bearish outlook remains valid. ✅
Follow us for more updates. 🔔
See you on the next one. 🫡
BTC mid term uptdateI will be carefull at 122.000 secure positions and taking profits as one more fall is very possiblo to 113.500 before new all time highs
Levels Highlighted
GG

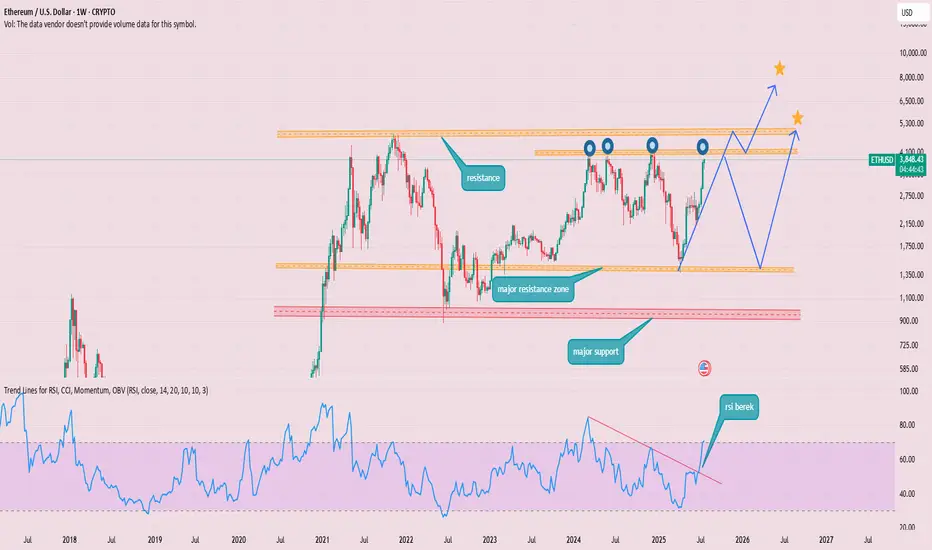
ETH ANALYSIS💲💲 #ETH is trading between support and resistance area. There is a potential rejection again from its resistance zone and pullback from support zone. If #ETH breaks the major resistance zone then we would see a bullish move

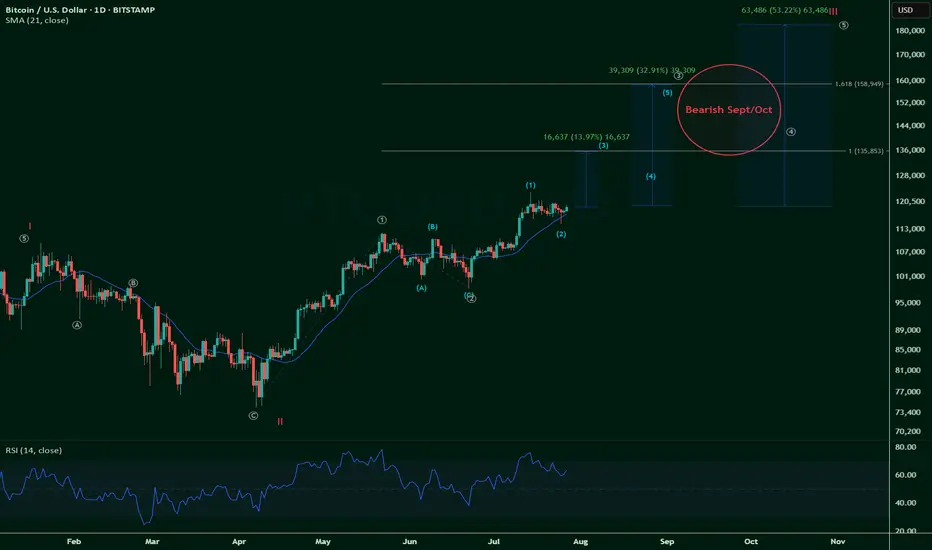
$BTCUSD - Bullish 2025 - Cycle Wave III up (eta Dec2025)NOT FINANCIAL ADVICE
Let's start with this bullish outlook on Bitcoin and its various phases:
Here, I estimate the likelihood of CRYPTOCAP:BTC 's journey through its Cycle Wave III.
GBPCHF Will Keep Falling!
HI,Traders !
#GBPCHF keeps falling down
And the pair made a strong
Bearish breakout of the key
Horizontal key level of 1.07025
And the breakout is confirmed
So we are bearish biased and
We will be expecting a further
Bearish move down on Monday !
Comment and subscribe to help us grow !

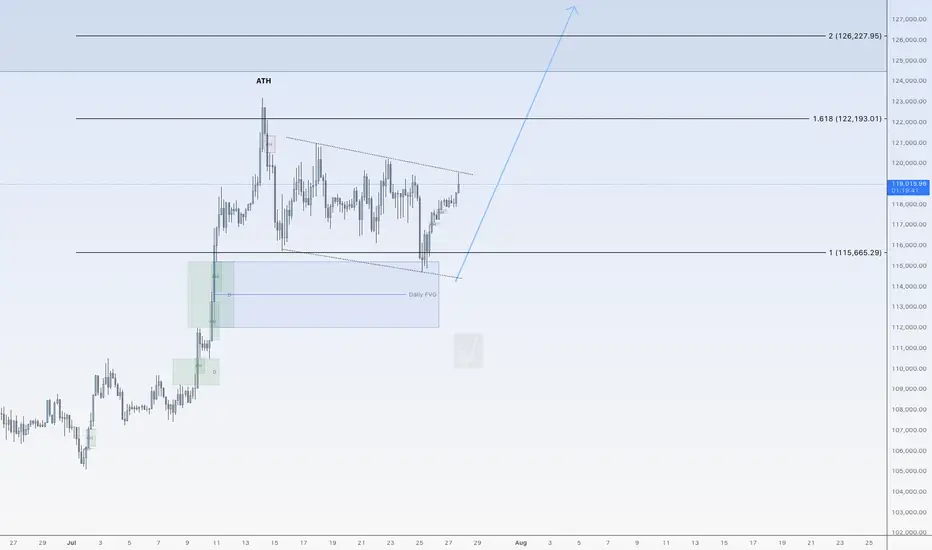
Bitcoin could go up again nowHi traders,
Last week Bitcoin made a Zigzag (break of previous low into the bullish Daily FVG) as I've predicted in my outlook.
After it came into the Daily FVG, price went up again.
Now if we see a small correction down, we could see the next impulsive wave up to a new ATH.
Let's see what the market does and react.
Trade idea: Wait for a correction down to finish.
Then after an impulse wave up, a small correction down on a lower timeframe and a change in orderflow to bullish you could trade longs.
NOTE: the next three weeks I'm on holiday so I will not post any outlooks publicly.
If you want to learn more about trading FVG's with wave analysis, please make sure to follow me.
This shared post is only my point of view on what could be the next move in this pair based on my analysis.
Don't be emotional, just trade your plan!
Eduwave
ERA USDT NEXT VIEW Era Usdt looking goods from her for long position
Looking strong technical Analysis 🏆

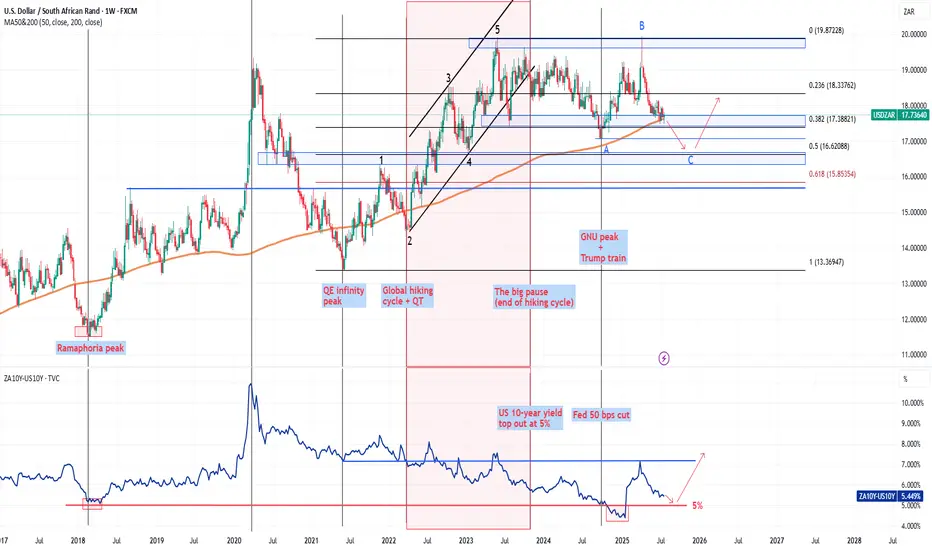
The dance between the USDZAR and (ZA10Y - US10Y)The chart shows the relationship between the USDZAR and the yield differential between the SA 10-year and the US 10-year (ZA10Y – US10Y).
2025 has been a wild ride for the rand and it has managed to put up a remarkable recovery in the 2Q2025 but where to now for the pair? The pair has not traded below the 200-week MA currently at 17.62, since the March 2022 just before the global rate hiking cycle. The only previous times the pair traded below this moving average was briefly in 2021 before the June/July riots in SA and during the “Ramaphoria” period in 2018.
The 200-week MA also coincides with the 38.2% Fibo retracement from the low in 2021. A brief break below these two support levels will allow the pair to fall onto the 50% Fibo retracement level at 16.62. The yield differential is however suggesting that the rand may not have much room to pull the pair too far below the 200-week MA. The brief break below the 5.00% during December 2024 and January 2025 was a bit of an anomaly given the volatility in the US bond market and I still believe 5.00% is a hard support for the yield differential. A bottom out of the yield differential could see it rise higher towards 7.50% which will be rand negative should the positive correlation hold.
To summarise, the yield differential is suggesting that the rand’s 2Q2025 recovery may be on its last legs but a break below the 200-week MA will allow the rand to pull the pair towards 16.50. I don't see the rand maintaining levels below 16.50 and this level seems like a long-term floor for the pair before another 5-wave impulse to the topside.
Historical trend analysis:
The SA rand is one of the most attractive emerging market currencies due to the carry trade appeal of the currency coupled with SA’s deep and liquid bond market. During periods when there is significant buying pressure on SA bonds, the SA yields will decrease meaning that the yield differential (ZA10Y-US10Y) decreases while in periods when SA bonds are selling off, yields on SA bonds will increase which increases the yield differential, citrus paribus. The USDZAR pair is thus positively correlated with this yield differential.
The chart goes back to 2018 when the USDZAR hit a low of 11.50 following the period dubbed the “Ramaphoria” period. Investor sentiment swinged aggressively positive in this period and the flow of international funds into the SA bond market saw the yield differential drop to a low around 5.00%. The yeld differential has never dropped below this level until early 2025 as indicated on the chart.
The yield differential and the USDZAR pair moved in tandem all the way through to the 1Q2022, maintaining its strong positive correlation. The next period marked the start of the global hiking cycle which saw the US 10-year yield rise from a low of 1.65% in March 2022 to a high of 5.00% in October 2023. This aggressive rise in US 10-year yields marked a period of extensive risk off sentiment and even caused a US banking crises in March 2023. The Fed stepped in and briefly paused their QT to add liquidity to system and provided the US banking system with the bank term funding program to patch up the cracks. The rand sold off due to risk off investor sentiment while the US 10-year yield rose due to the start of the rate hiking cycle which reduced the yield differential. The USDZAR climbed to a high of 19.90 in May 2023 while the yield differential dropped to a low of 7.50%. The yield differential continued to fall until the US 10-year yield topped out at 5.00% in October 2023, after which the positive correlation between the USDZAR and the yield differential was restored.
The next period marked positive sentiment towards SA following the election results and the formation on the government on national unity (GNU). Coupled with the end to the rate hiking cycle, the rand had the wind and risk on investor sentiment in its sails which allowed the rand to pull the pair to a low of 17.03. The optimism of the GNU and the realisation on another Trump presidency however saw the pair bottom out in September 2024. During the last quarter of 2024 the rand experienced sustained selling pressure while the yield differential continued to fall. The break in correlation was largely due to the US10-year yield climbing from 3.60% in September 2024 to a high of 4.80% in January 2025.
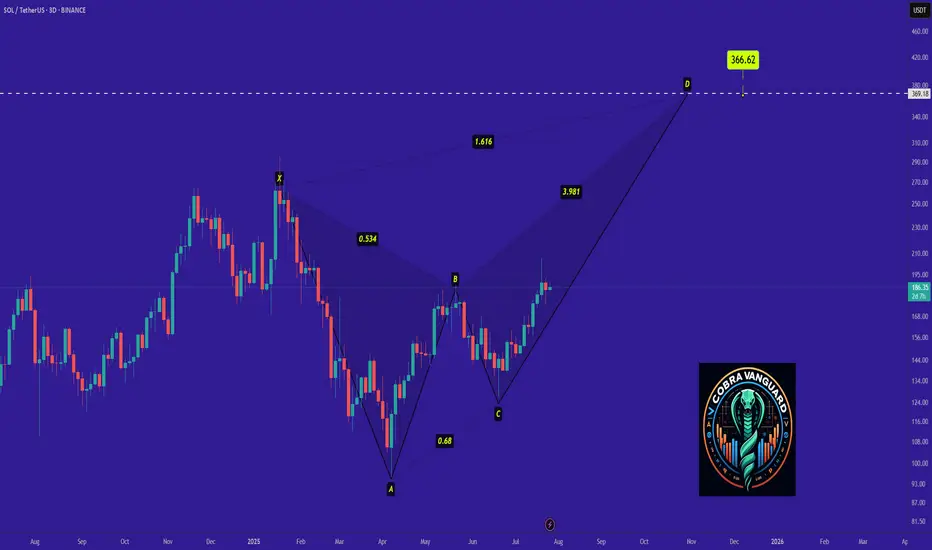
SOL - Time to buy again! (Update)Be careful with SOL !!!
we can hope that the price will act like a Crab pattern and the price will grow well.
I expect that the price will grow very quickly...
USDZMW ANALYSISThe 24 March 2024 record high at ZMW29.87 completed wave 5 of intermediate degree. The decline from the record is is wave A of intermediate degree. The analysis is forecasting the market to drop below ZMW15.12.
Attached are my previous analysis.

Bonkusdt Long Positionnice flag!
this is financial advise
buy it now for 300 percent profit in 2 weeks
buy now or cry later
targets are shown in green
