BitcoinBitcoin/TetherUS (BTC/USDT) Trading Analysis - Jul 15, 2025
Key Observations:
Price Movement:
Current Price: $117,692.46
24h Change: -2,148.72 (-1.79%)
Range: Low of $116,250.00 to High of $119,940.83
The price is currently near the lower end of the day's range, indicating bearish pressure.
Support and Resistance:
Support Levels:
Strong Support: $112,000.00 (marked as S/L)
Intermediate Support: $113,500.00 and $110,000.00
Resistance Levels:
Immediate Resistance: $119,900.00
Higher Resistance: $120,000.00 and $122,500.00
Profit Levels:
The "Profit" section lists potential take-profit targets, with the highest at $135,000.00.
The price has recently dipped below the $120,000.00 psychological level, suggesting weakening bullish momentum.
Trend Context:
The chart spans from June to September, but the current price action (July) shows consolidation after a potential pullback from higher levels.
The presence of multiple support levels ($112K–$116K) suggests a critical zone for buyers to defend.
Actionable Insights:
Bearish Short-Term: The price is below key levels ($119,900–$120,000) and has broken below $118,250.00. A retest of support at $112,000.00 is plausible.
Bullish Reversal Signal: If BTC holds above $112,000.00 and reclaims $120,000.00, it could target $122,500.00 or higher.
Risk Management: A break below $112,000.00 (S/L) may trigger further downside toward $110,000.00 or lower.
Conclusion:
The market is currently in a corrective phase. Traders should monitor the $112,000.00 support for potential reversals or breakdowns. A close above $120,000.00 would shift bias to bullish.
Wave Analysis

Dow Jones US30 Trend Analysis and Trade Plan Breakdown📈 US30 (Dow Jones) is currently in a strong bullish trend 🔥. This is clearly visible on the 4H chart, where we’re seeing a consistent pattern of higher highs and higher lows 🔼🔼.
👀 I’m watching for a potential long opportunity, especially since the higher timeframes remain firmly bullish 🟢.
🎥 In the video, we break it down:
A quick overview of the 4-hour structure
Then dive into a potential trade setup on the 30-minute chart ⏱️🔍
🧠 This is for educational purposes only and not financial advice ⚠️📚

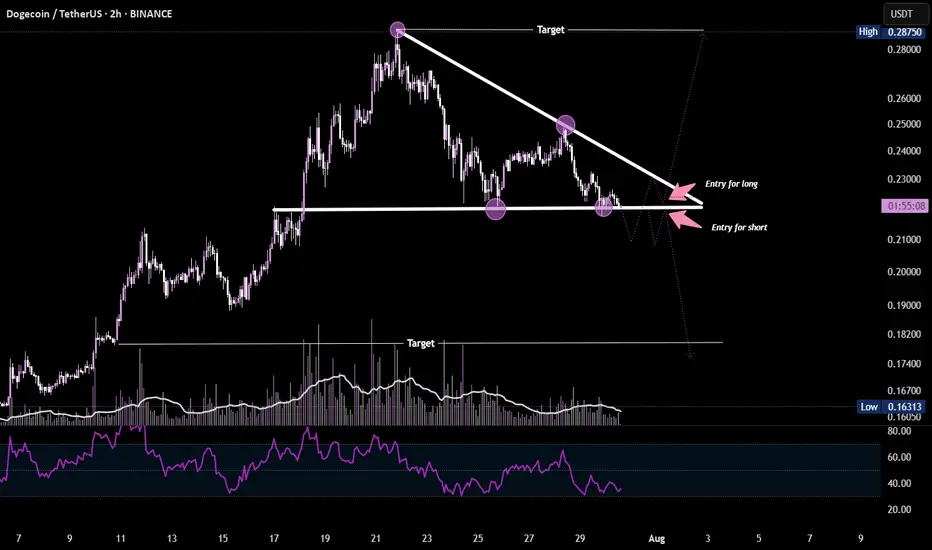
DOGE at Decision Point Dogecoin is forming a descending triangle pattern on the 2H chart, indicating a potential breakout setup.
A close above the resistance trendline ($0.23) could trigger a bullish move, while a breakdown below support ($0.215) may signal a bearish continuation. RSI and volume are suggesting weakening momentum — wait for confirmation before entering.
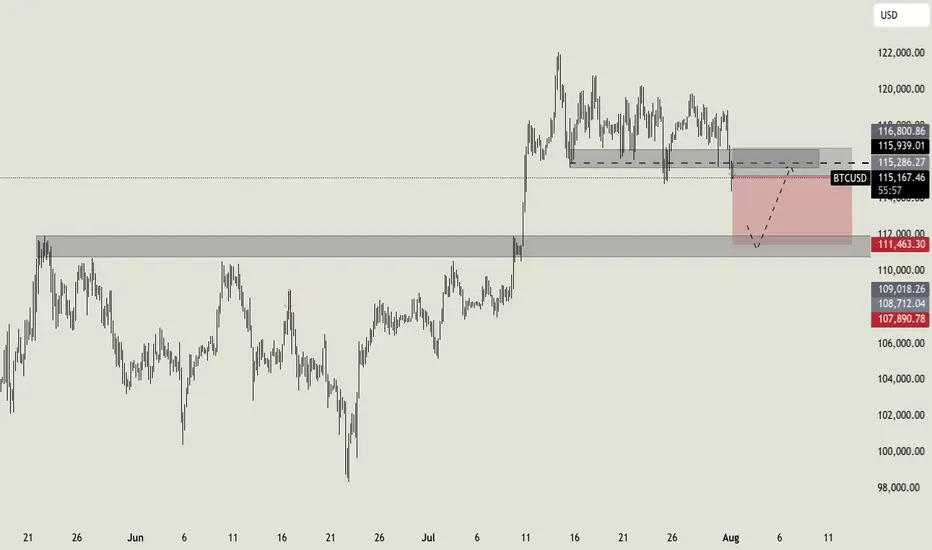
NO FEAR on BITCOIN!I was waiting for a break on this level from some days, and here we go! We catched a nice long setup previous days, and now Bitcoin broke down the key level i highlited last week. This is an important support area that will now act as resistance, so i expect a continuation to the downside till the second support area at $112.000. To invalidate this setup we should expect a clean break above $116.800.
Let me know in the comment what do you expect!
USDCAD Analysis – July 16, 2025
Following the ceasefire between Iran and Israel, oil prices have weakened, reducing support for the Canadian dollar, which is closely tied to crude. As a result, CAD could remain among the weaker currencies over the next two weeks.
Meanwhile, the US dollar may gain strength following the CPI data released on July 15, 2025, potentially setting up a favorable swing opportunity for USDCAD bulls.
🟥 High-Risk Setup – R:R 7.0
This aggressive setup targets a sharp upside move with a tight stop loss, aiming for a high reward relative to the risk. It's suitable for traders comfortable with volatility and willing to accept a lower probability for a higher payout.
🟦 Moderate-Risk Setup – R:R 2.5
A more balanced scenario with a wider stop and a closer target, offering a higher probability of success and smoother trade management. This setup aligns well with swing trading strategies seeking consistent results.
Both setups are based on the current price action structure visible on the chart.
Trade safe, manage your risk, and follow your plan. ✅

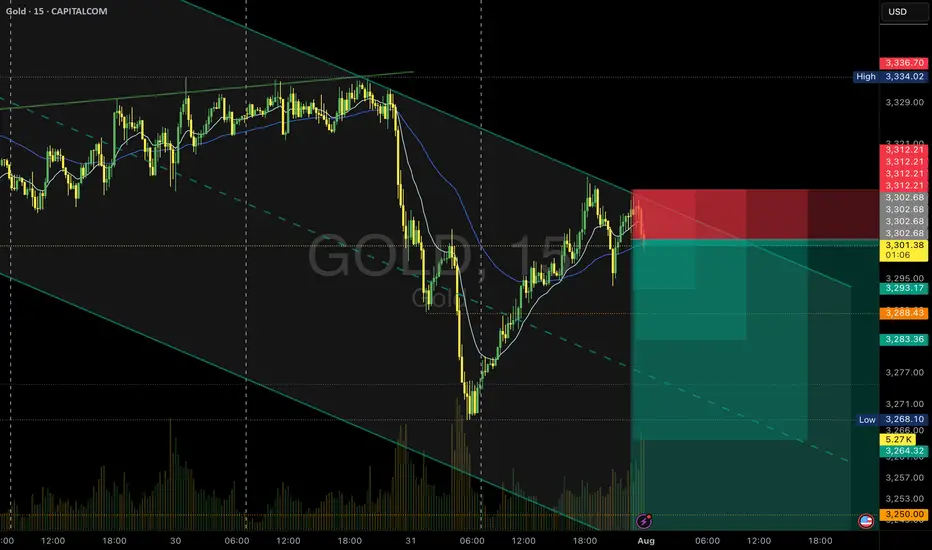
Gold Sell Setup - M15PEPPERSTONE:XAUUSD
Timeframe: m15
Risk Level: Medium
🔹 Setup:
Price is testing the upper boundary of the descending channel.
📈 Entry:
Current price zone: 3302.5
🎯 Targets (TP):
TP1: 3393
TP2: 3283
TP4: 3264
TP6: 3244
⛔ Stop Loss (SL):
3312.2
#XAUUSD #GOLD #SELL #Signal #MJTrading
Psychology Always Matters:
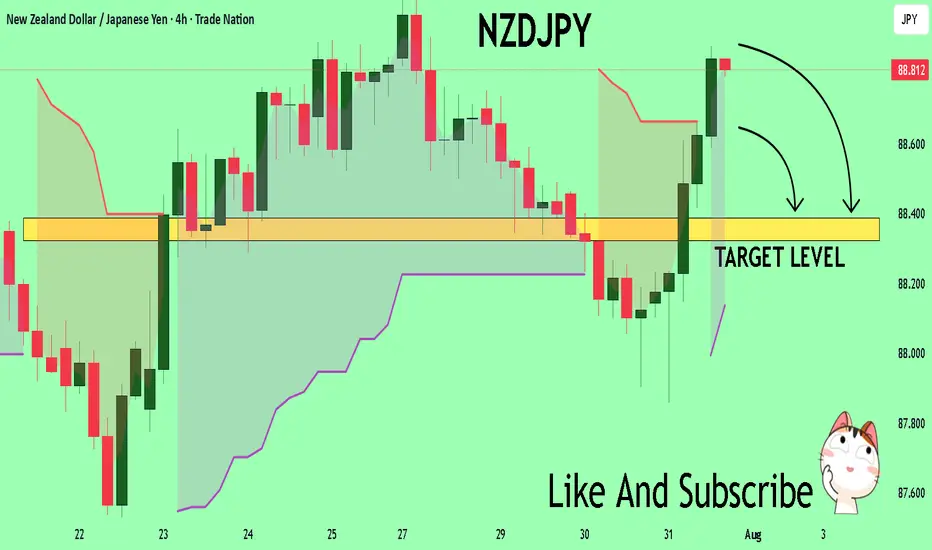
NZDJPY The Target Is DOWN! SELL!
My dear friends,
Please, find my technical outlook for NZDJPY below:
The price is coiling around a solid key level - 88.806
Bias - Bearish
Technical Indicators: Pivot Points Low anticipates a potential price reversal.
Super trend shows a clear sell, giving a perfect indicators' convergence.
Goal - 88.388
About Used Indicators:
The pivot point itself is simply the average of the high, low and closing prices from the previous trading day.
Disclosure: I am part of Trade Nation's Influencer program and receive a monthly fee for using their TradingView charts in my analysis.
———————————
WISH YOU ALL LUCK
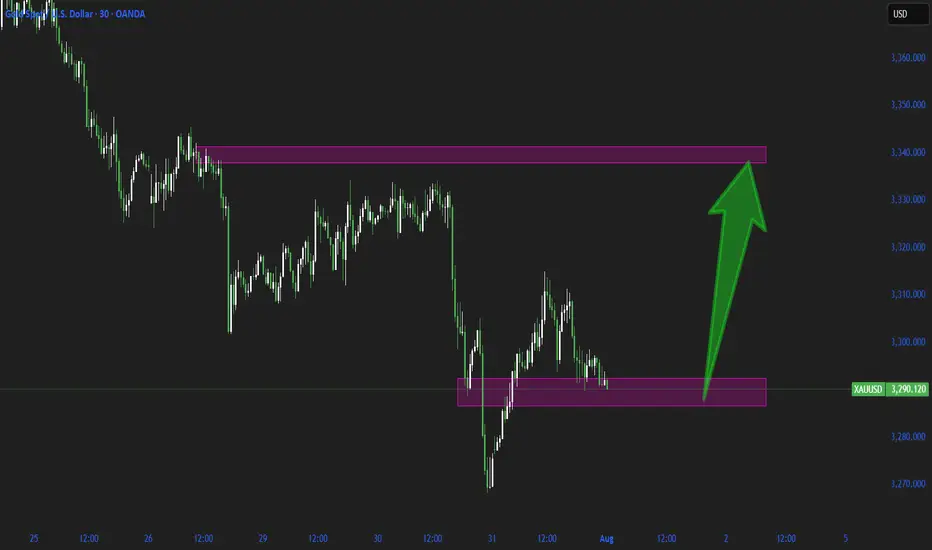
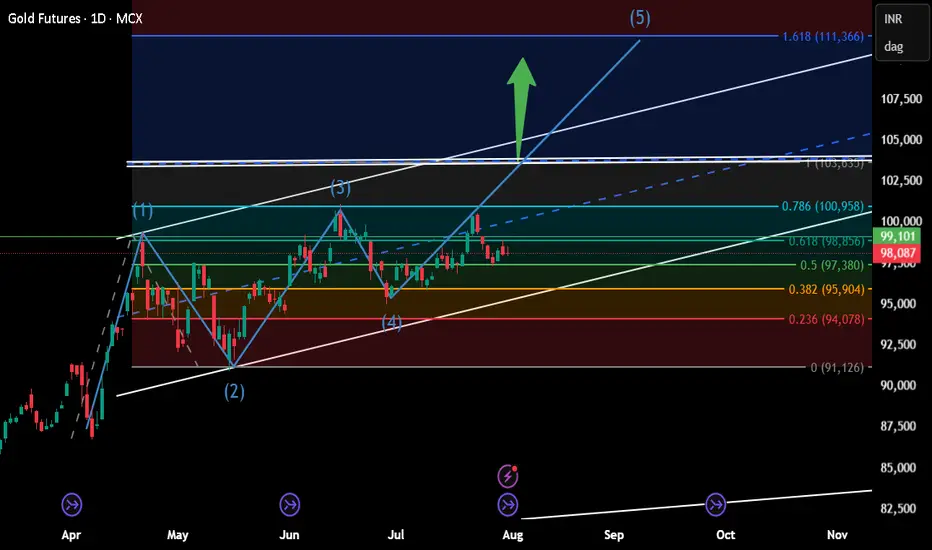
Market Expectations for Gold (XAU/USD)Gold is currently in a very critical zone, and in my view, it has room to rise toward the 3339–3345 level.
Once that zone is touched, I expect another drop to follow.
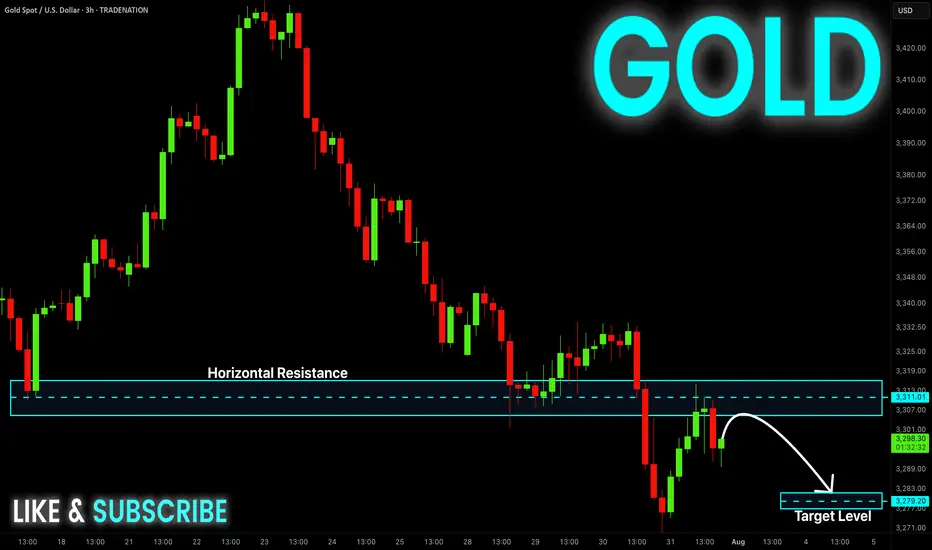
GOLD Local Short! Sell!
Hello,Traders!
GOLD made a retest
Of the horizontal resistance
Of 3313$ and we are already
Seeing a bearish reaction and
We will be expecting a further
Bearish move down
Sell!
Comment and subscribe to help us grow!
Check out other forecasts below too!
Disclosure: I am part of Trade Nation's Influencer program and receive a monthly fee for using their TradingView charts in my analysis.
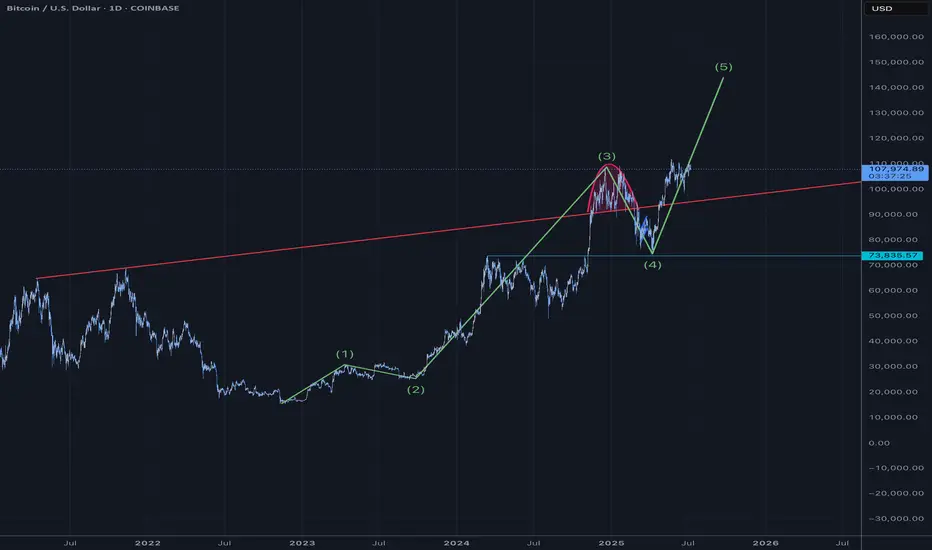
Bitcoin Elliot Wave CountBullish for the next 90 days
Blow off top thesis
Pump into rate cuts and Big Beautiful Bill.
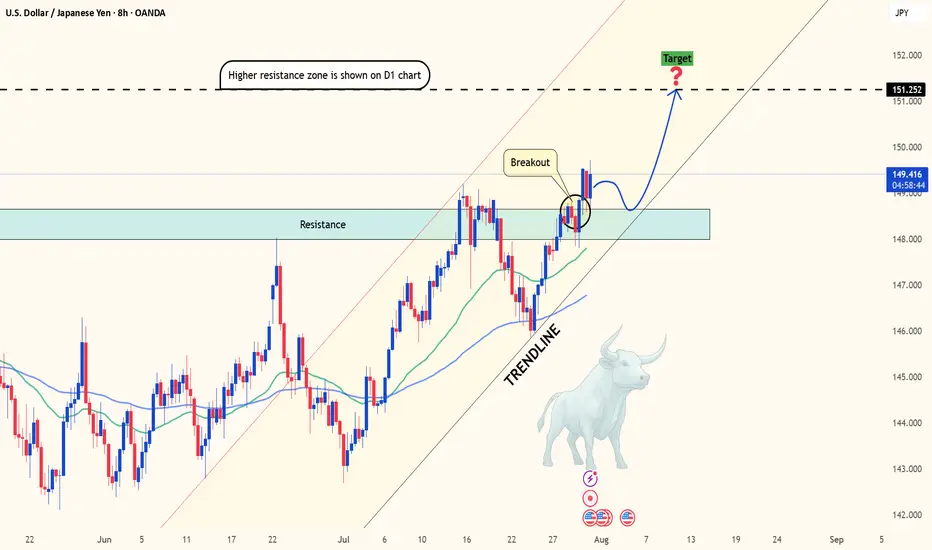
USDJPY breaks out as US data crushes forecastsHello traders! Do you think USDJPY will continue its upward momentum?
From a technical perspective, after several sessions of "building pressure," this pair has finally broken through a key resistance zone—opening the door to what could be the next bullish breakout.
Current price action suggests the uptrend remains firmly intact. The market continues to respect the rising trendline and finds strong support near the 34 & 89 EMA – a powerful technical combination that buyers often rely on. This isn’t just a typical breakout; it could be the start of a brand-new bullish cycle.
On the fundamental side, the U.S. dollar remains strong, supported by a string of solid economic data: employment, PCE, and consumer spending have all exceeded expectations. Meanwhile, the Japanese yen remains in “hibernation” as the Bank of Japan shows no sign of shifting away from its ultra-loose monetary policy. This divergence makes USDJPY one of the hottest pairs on the radar right now.
What’s next? If bullish momentum continues, the 151.25 level is likely the next short-term target. However, if the price encounters strong resistance at that level, a minor pullback could occur before the uptrend resumes.
So, what do you think? Is this the beginning of a major rally – or just a false breakout? Share your thoughts in the comments!
Wishing you successful and well-timed trades ahead!
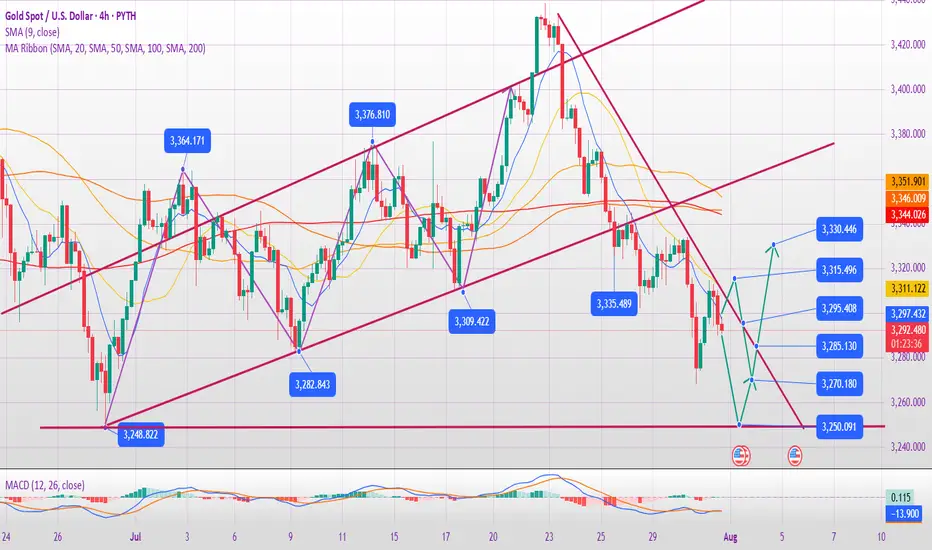
Will gold prices continue to fall on August 1st?
Core Logic Analysis
Negative factors dominate
The Federal Reserve's hawkish stance: keeping interest rates unchanged and Powell suppressing expectations of a rate cut have weakened gold's safe-haven appeal.
Strong economic data: ADP employment data exceeded expectations, and coupled with the upcoming PCE and non-farm payroll data, market expectations of an early Fed rate cut have cooled.
Technical Breakdown: Gold prices fell below the key support level of $3,300, hitting a new monthly low. A large weekly bearish candlestick chart indicates bearish dominance.
Key Support and Resistance
Resistance: 3315 (hourly rebound resistance), 3333 (previous high and daily resistance).
Support: 3280-3290 (short-term), 3250-3245 (strong monthly support).
Potential Risks
Unexpectedly weak non-farm payroll data or escalating geopolitical tensions could trigger a short-term rebound, but a break above 3330 is required to reverse the downward trend.
Today's Trading Strategy
Short-Term Trading
Primarily short at highs: Short lightly on a rebound to 3310-3315, stop loss at 3325, target 3290-3280.
Aggressive Short: Add to short positions if the price reaches 3330-3333, stop loss at 3340, target 3280.
Cautious Long: Try a long position on the first touch of 3250-3245, stop loss at 3235, target 3270-3280 (quick in and out).
Mid-term Strategy
If the monthly line closes below 3250, shorting at high levels can be continued in August, targeting the 3150-3100 range.
If the gold price rebounds above 3350 after the non-farm payrolls, the trend needs to be reassessed.
Events to Watch
Data:
Non-farm payroll report on Friday (if the data exceeds expectations, gold prices may fall further).
US June PCE Price Index (Federal Reserve inflation indicator).
Technical Signal:
A daily close below 3250 would confirm a medium-term downtrend.
Observe the recapture of the 3300 level, which serves as a dividing line between bulls and bears.
Summary
Gold is currently in a bearish phase. Prioritize shorting on rallies, but be wary of unexpected data fluctuations. If the mid-line breaks below 3250, the market could target the 3000-3100 range. Conversely, if it holds above 3330, strategy adjustments will be necessary. Strictly stop loss and control risks.
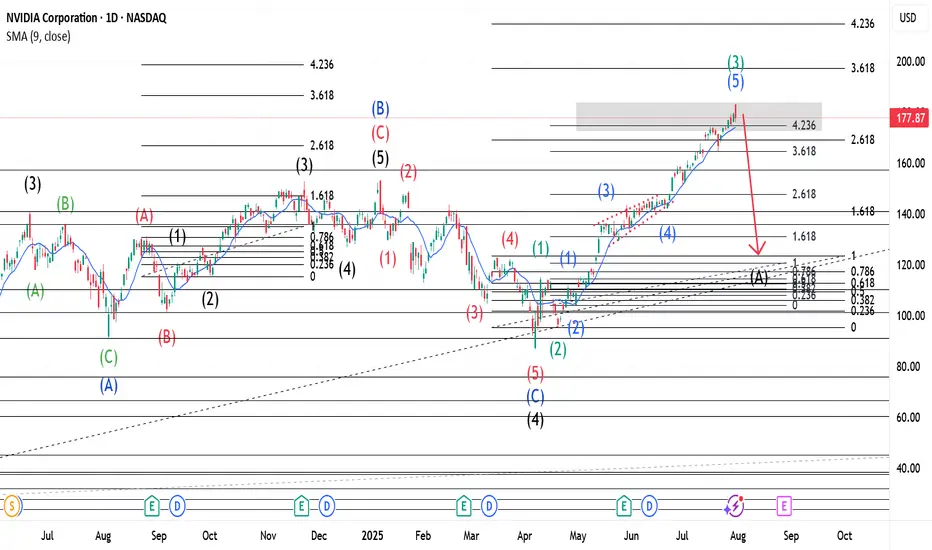
$NVDA ~ An Elliott Wave Breakdown.(Detailed Spectrum)Our Wave 2(Black) of the main wave was a Zigzag hence a Flat for Wave 4(Black). When Wave 3(Black) completed a three wave move, shown in Green, was made, hence A(Blue). Wave B(Blue) went beyond the end of 3(Black) and had 3 waves, shown in Red, also(as expected for Flats). The last of this 3 wave move(Wave c-Red) had 5 waves shown in Black. Upon completion, our Wave B(Blue) was over and we expected a Wave 4(Black). Our Wave 4 made a 5 wave move(Shown in Red) that retested at the 261.8% Fib. level. With Wave C(Blue) complete, it was coined Wave 4(Black). Wave 5(Black) was launched and has a 5 wave move shown in Green. With a Zigzag for Wave 2(Green), a Flat should be expected for Wave 4(Green). Wave 3(Green) has 5 waves with a triangle for Wave 4(Blue). A confirmation at its current location(423.6% Fib. level) would mean that Wave 3(Green) is complete and a Wave A(Black) of the previously mentioned Flat should be anticipated.
NB: The placement of Wave A(Black) of the Flat mentioned above is purely for demonstrative purposes.
NZDUSD Bearish towards .5925!1). Wave 5 drop needs a completion lower! 2). Risk is selling off! 3). Volume is falling! 4). Price appears to be heading towards lower market sentiment! 5). Trump is imposing more Tariffs, which is likely causing deeper corrections!

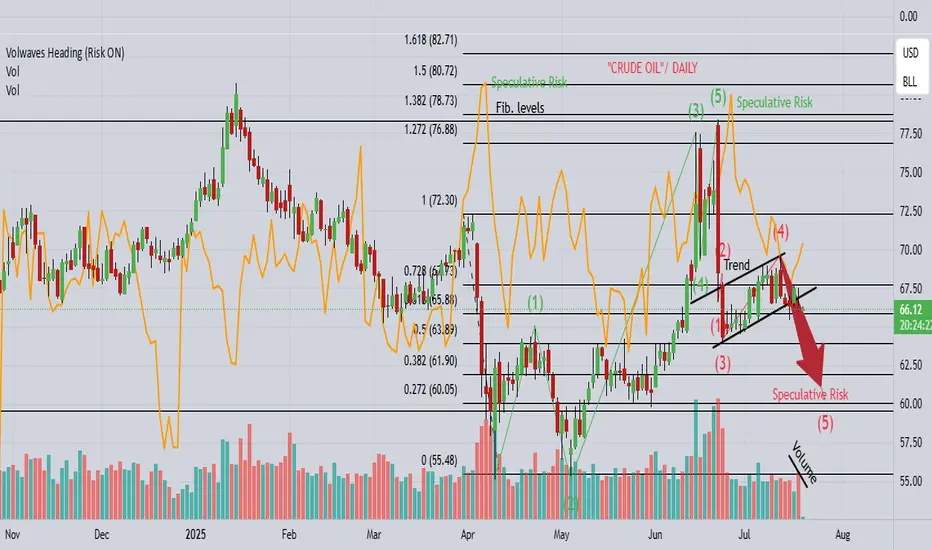
CL "OIL" continues the drop towards $60!1). Wave 5 drop needs a completion lower! 2). Risk is selling off! 3). Volume is falling! 4). Price appears to be heading towards lower market sentiment! 5). Trump is imposing more Tariffs, which is likely causing deeper corrections!
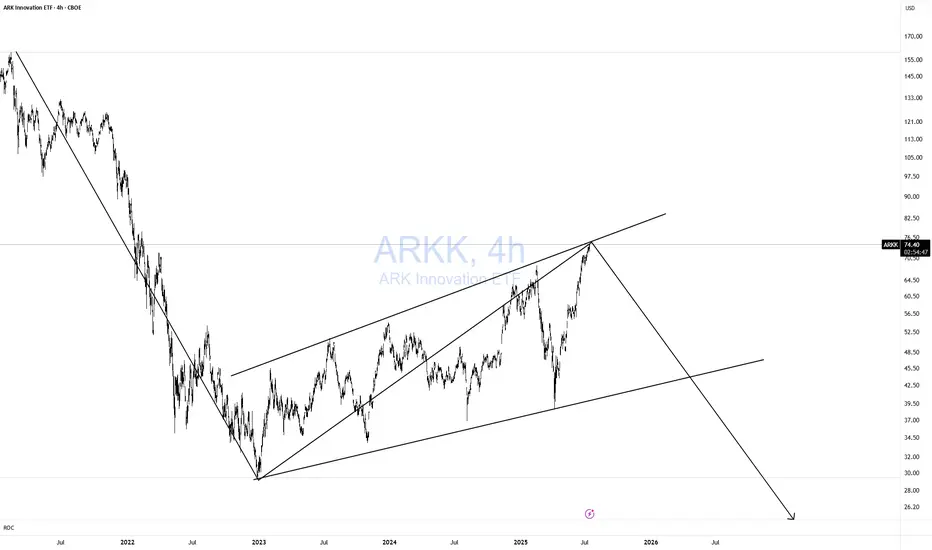
ARKK DOOMED!Classic 123 wave move down! As I like to say Short when no one else is looking! Not when everyone is looking. TOO LATE!
Simple but very effective pattern with excellent risk-reward. Remember, I am a macro trader, so don't expect to see a return on this investment tomorrow.
I won't get into the macro stuff.
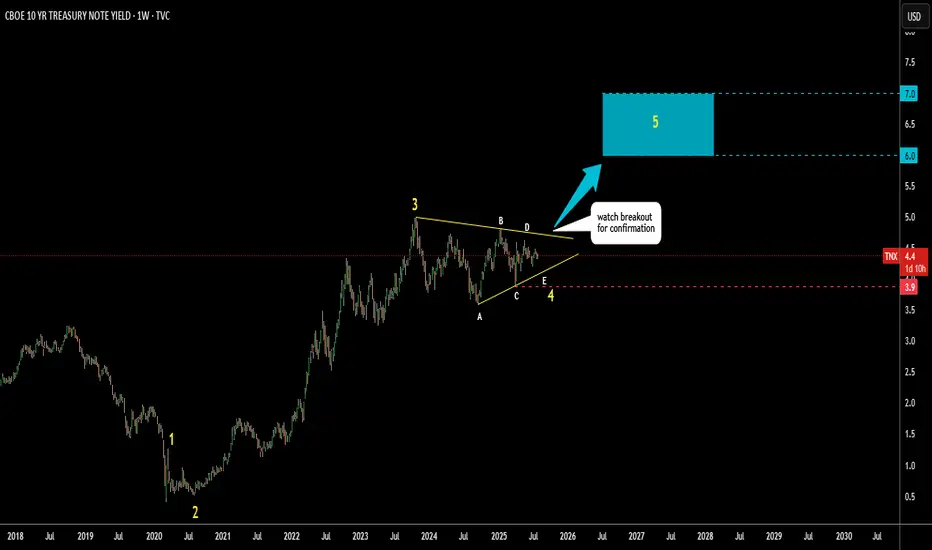
US 10Y yield: Triangular Consolidation, next 6-7%I’ve spotted a well-known triangular pattern forming on the US 10-year Treasury yield.
This appears to be the development of a large Wave 4.
Wave E of Wave 4 may still be unfolding.
Watch to see if it holds above the Wave C low at 3.9%.
A breakout above resistance near 4.7% would confirm the pattern.
The target zone is set between the 38.2% and 61.8% retracement levels of Waves 1 to 3,
highlighted with a blue box between 6% and 7%.
Could tariffs cause a major spike in yields—or will something else trigger it?
Share your thoughts in the comments below.
ton/usdt clear bullsih pattren dyor HERE u can get lot of help from here
TON/USDT a graphically bullish chart pattern and fundamentals are good
long term hodl good and futures 2-4x lev is enough for entire cucle here we can see a 70% potential in this
dis: im not finanicail advisor

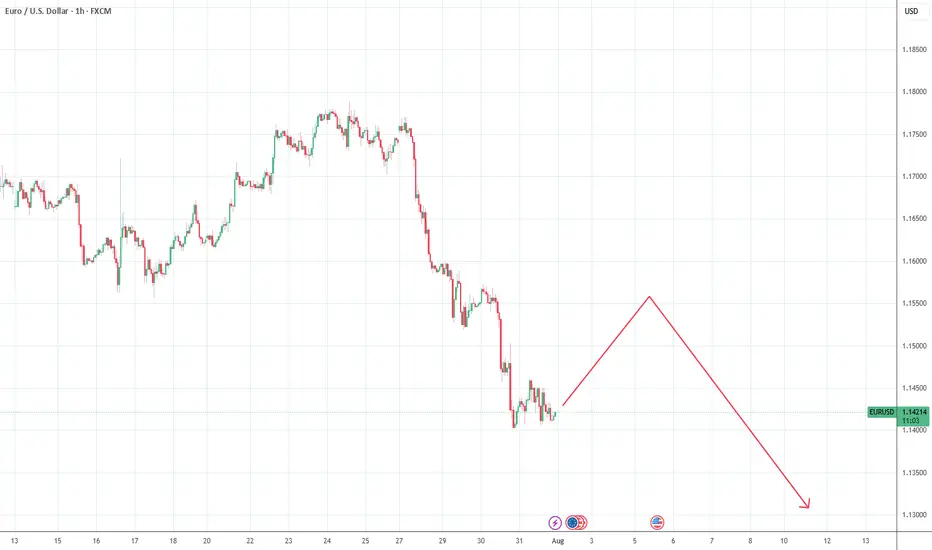
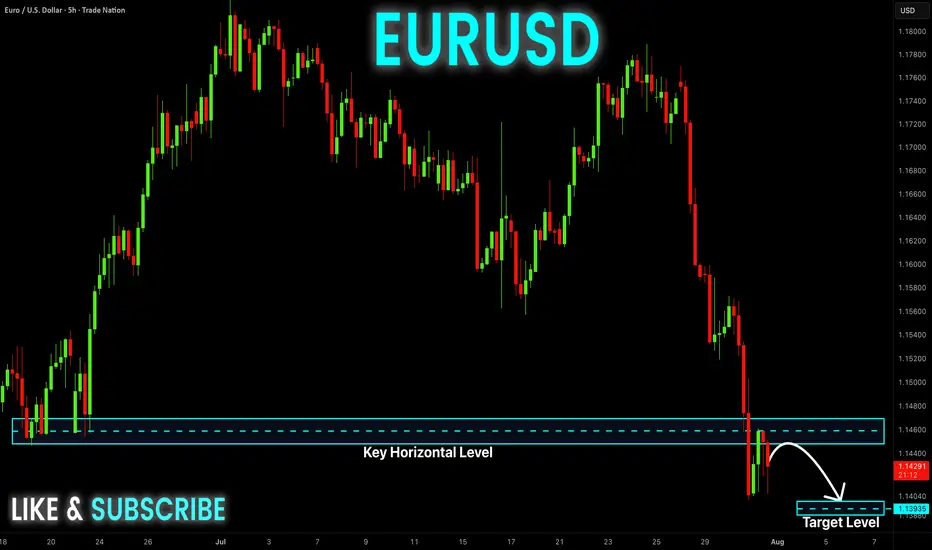
EUR-USD Bearish Breakout! Sell!
Hello,Traders!
EUR-USD made a bearish
Breakout of the key horizontal
Level of 1.1460 then made
A retest and a pullback so
We are bearish biased and
We will be expecting a
Further bearish continuation
Sell!
Comment and subscribe to help us grow!
Check out other forecasts below too!
Disclosure: I am part of Trade Nation's Influencer program and receive a monthly fee for using their TradingView charts in my analysis.
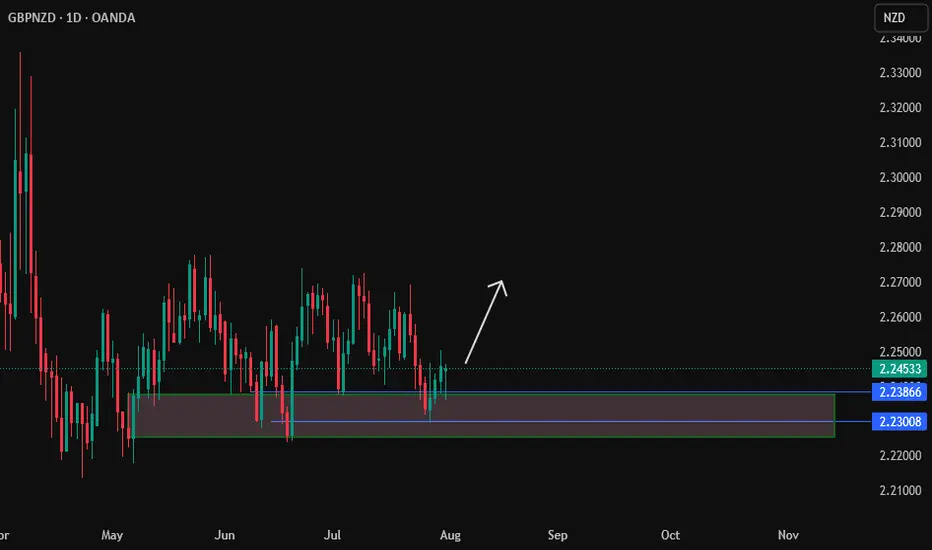
gbpnzdGBP/NZD – Set to Breakdown. Forex Strategy is Bearish: GBP/NZD is currently at 2.2479 in a range. With this breakout, we are looking for a small pullback ..
sl
down support
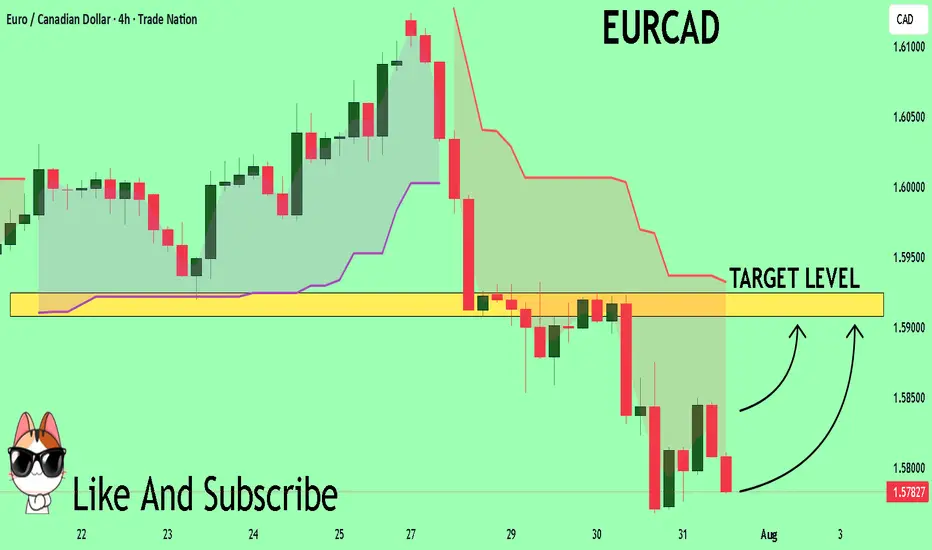
EURCAD What Next? BUY!
My dear friends,
My technical analysis for EURCAD is below:
The market is trading on 1.5784 pivot level.
Bias - Bullish
Technical Indicators: Both Super Trend & Pivot HL indicate a highly probable Bullish continuation.
Target - 1.5907
About Used Indicators:
A pivot point is a technical analysis indicator, or calculations, used to determine the overall trend of the market over different time frames.
Disclosure: I am part of Trade Nation's Influencer program and receive a monthly fee for using their TradingView charts in my analysis.
———————————
WISH YOU ALL LUCK