BTC UPDATE Hello traders
As we mentioned in the previous analysis, there is a possibility for the continuation of the rise of Bitcoin near the levels of 19 thousand. Based on that, we bought Bitcoin from the block of orders responsible for causing the change in structure, but now the stop loss must be placed at the entry point because we have a strong supply area formed, from which the price may fall to the demand area Before the ascent, if the bitcoin can overcome it, the ascent may continue for the target
previous analysis:
Waves

Waves. Unhealthy. Wild price fluctuations for 10 months speak of the extreme degree of unhealthy for this token. If public pressure continues, we will see lower prices. But RSI is talking about oversold. Market sentiment is conflicting. Also, remember, Waves algorithmic stablecoin is in trouble.

HDFC BANK, GREAT FLAG PATTERN!!a great formation has been formed by hdfc stocks.
its a great bullish pattern, and as i have mentioned the waves, and the trend of waves, a long back in one of my idea(linked it below), the stock is following in the same way. it yet needs to go up by 10%, there is 3rd wave pending, and stock will go up soon.
but the risk part is that bank nifty, has been very overbought position, and it yet needs to be falled about 7%, i will bring a detailed analysis, in further coming ideas. but yet, this risked, is hedged, by the fall of SBI & ICICI banking stocks. this 2 very stocks had kept bank nifty at its ATH.
bank nifty will trade between the range of 43000-40000. its just that it needs to come to its major trend, since now it is in an overbought position.
yet this range will be maintained by great weighted bank nifty stocks, like hdfc bank, icici, kotak and sbi.
LAST POINT: have a look a volume bars too, for month, week and day time frames.
so i am bullish on hdfc bank as of now for this month.
(below i have just dropped some idea links related to banking sector for your own analysis).

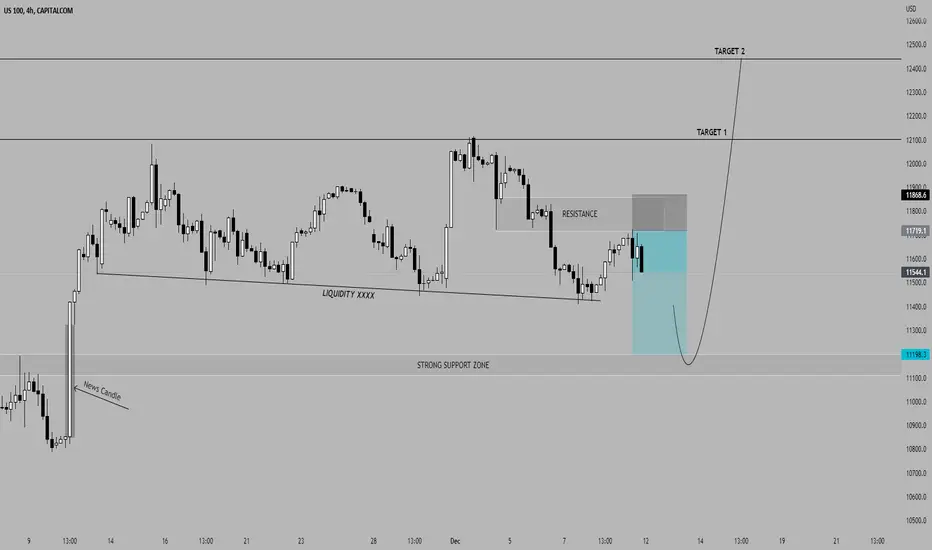
US100 4H Analysis wave
price action
liquidity
supply and demand
support and resistance
break out
retest
key level
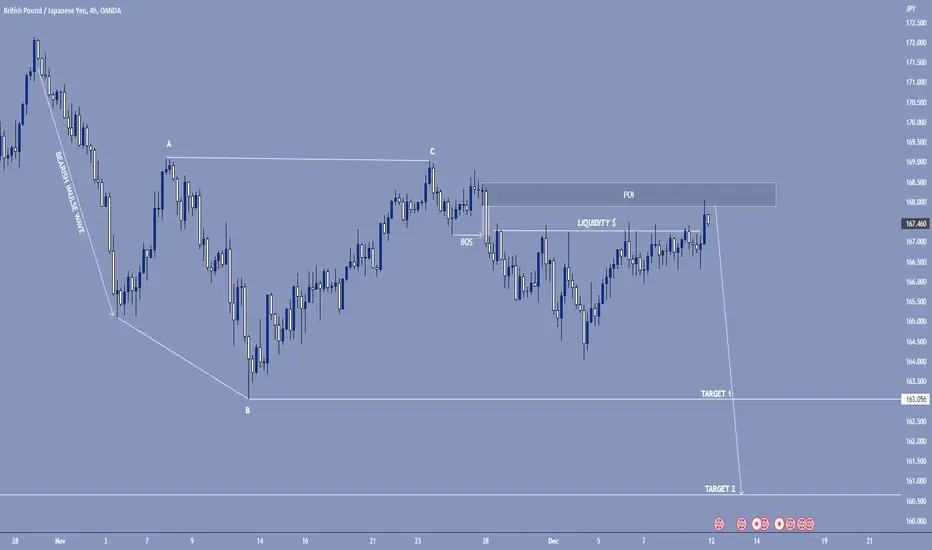
GBP JPY (SHORT) wave analysis
price action
market structure
liquidity
supply
impulse wave
correction pattern
IMbalance
WAVESUSDWAVESUSD
The price goes into long-term accumulation until it is worth buying, if you buy then from the lower border of the channel
If you like the idea, don't forget to subscribe and rate like👍


THE BLUEPRIINT OF THE DOLLA (DXY) Wave 1 is equal to wave 5. It signifies that the high distance of wave 1 is the same high distance with wave 5. The question is what will be the DTD of US dollar next year?. As from the above analysis, I expect a crash in the dollar as of next year. I guess non of us will see it coming.

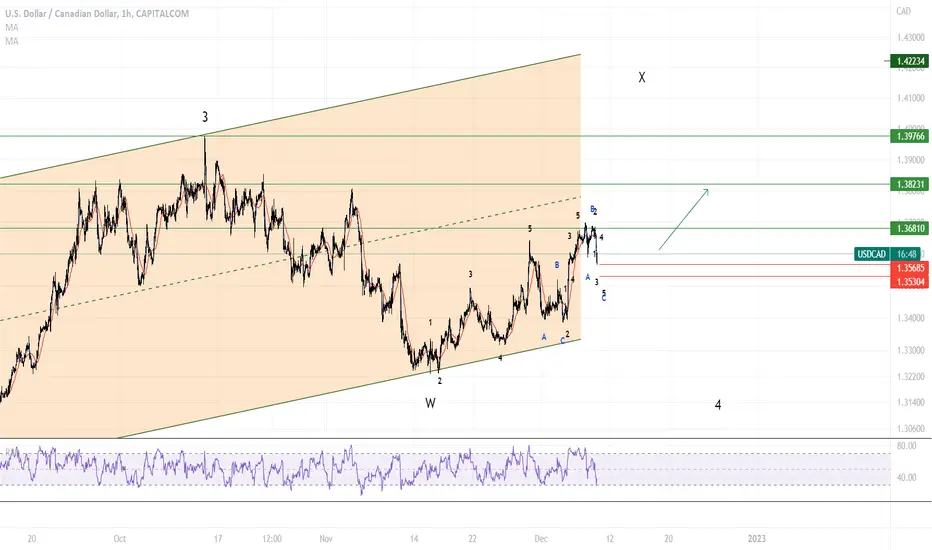
USD/CAD short term correctionUSD/CAD - EW Analysis - on a short term perspective, price is correcting. It is now forming a smaller Wave C on the downside from a bigger Wave X (on a bigger timeframe) on the upside. We should see a long term uptrend on USD/CAD, but for now the price will correct on the downside.
Disclaimer: This is not a financial/investment advice. The information here is just a view and a technical analysis with informational purpose only. You take responsibility for your own actions. Have a nice day.
CHECK WAVES OF WAVESBefore anything else, I would like to announce that the data in this chart is incomplete and I received the original data from another source and counted the waves and transferred the same wave count to the trading view, so you know why I took the first falling wave as C And I didn't get an A
I think we are inside the large log E and the structure of the log E is diametric. I think I am in wave E of E.
The larger structure of which the larger log E is a subset is also a diametric.
Fluctuations in the daily time frame are expected from views like this. This is the structure for trading, you must check the behavior of the price

Waves can see a rebound from support Waves has been heavily dumped, it has a support locally and can rebound, IF BTC continues to dip then we expect a break in the support and lower lows, but for now expecting a rebound

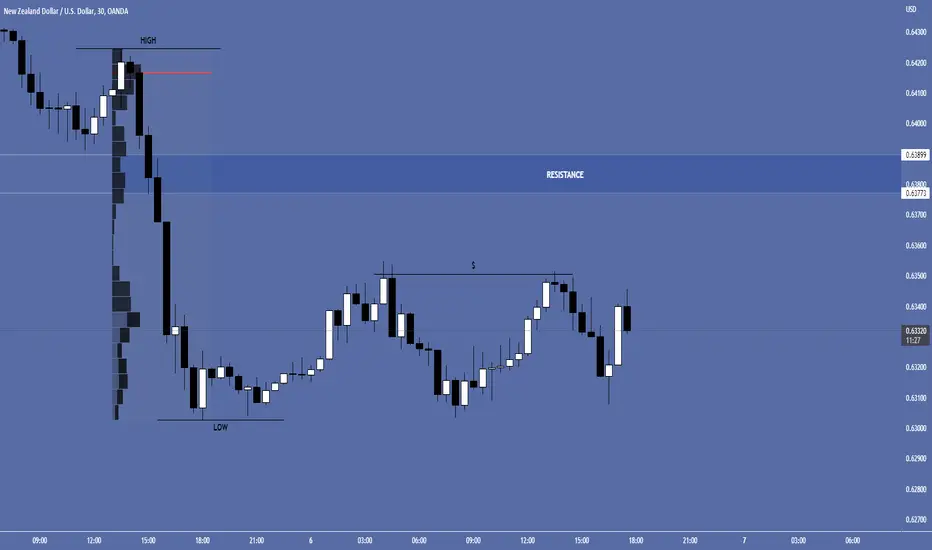
Potential selling opportunity for nzd usdHello traders
Potential selling opportunity for nzd usd
If the price reaches the resistance area before breaking the low, we look for confirmation on the one-minute frame to execute a short-term sell trade
BTC cycle based Wave CountsThis is our macro view on BTC based on cycle based wave counts.
--> BTC is in the final leg down of a full macro corrective wave 4, nobody knows what the excact low would be.
Based on wavecounts, Fibonacci extension + retracement targets the most confluence is founded in the 13-11.5k zone (also the launchepad of the previous bullrun) with an potential overshoot towards 10k
We dont want to try buy the exact bottem, we always waiting to get conformation on a bottem formation or we buying at prices where we feel comfort with to hold for the next wave up.
--> BTC never was able to make new ATH's before the halving date. The next logical top should be in 2025
This is just one of the many scenario's we could think of, along the way with having more chart data our vieuw on this TA could change.
On wich prices are you feeling comfort to buy in without having any regret over the next years?
What is your trade plan?
Cheers,
Team Quantistic

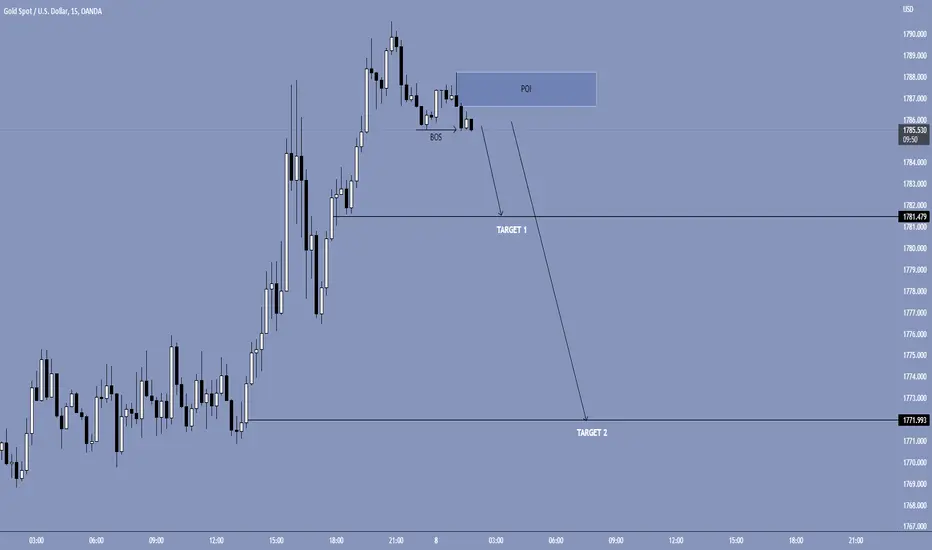
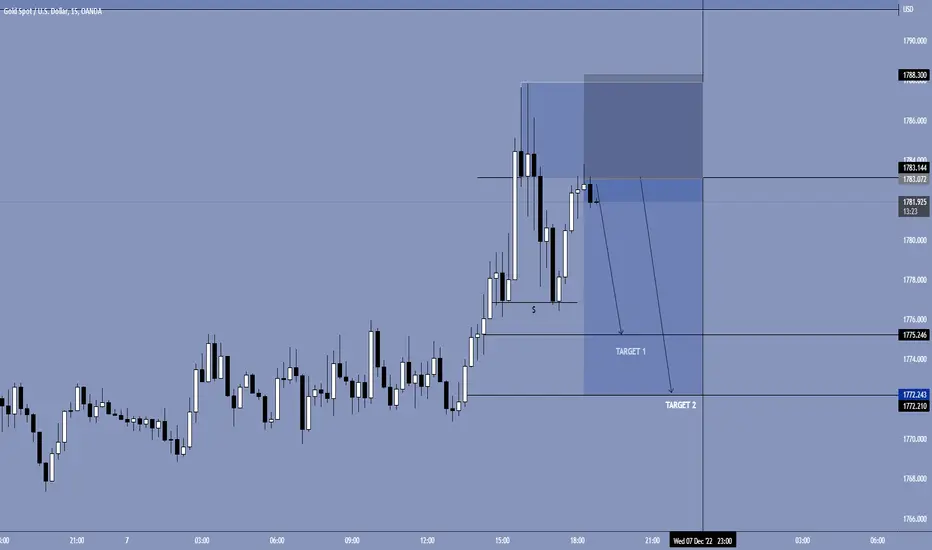
XAUUSD SHORT TRADE Hello traders
In today's session, we sold gold, the first target 1775.246, the second target 1772.243
Note: the trade closes with the end of today's candle
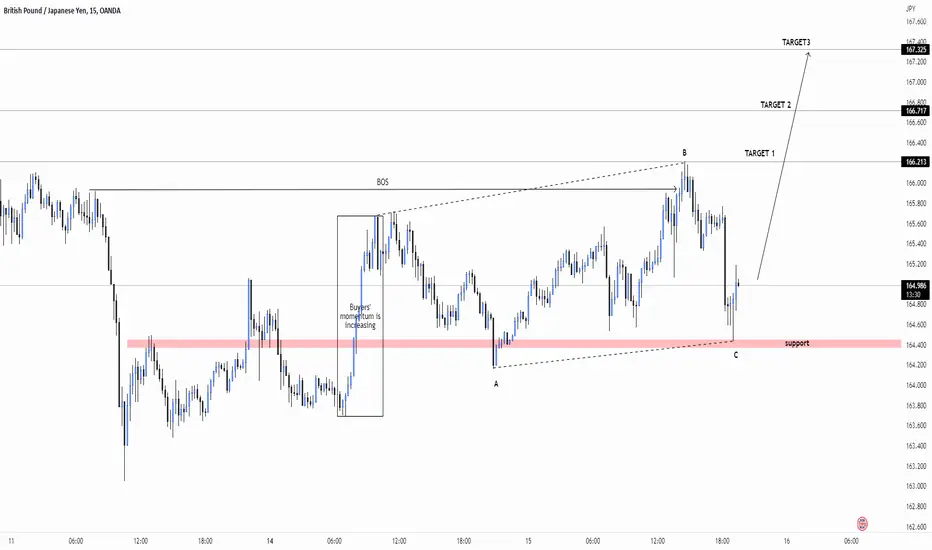
GBP JPY ANALYSIS Hello traders
Our analysis of gbp jpy is to buy in the short term to target the supply area and if we get confirmation from the supply area we can sell to target the bottom


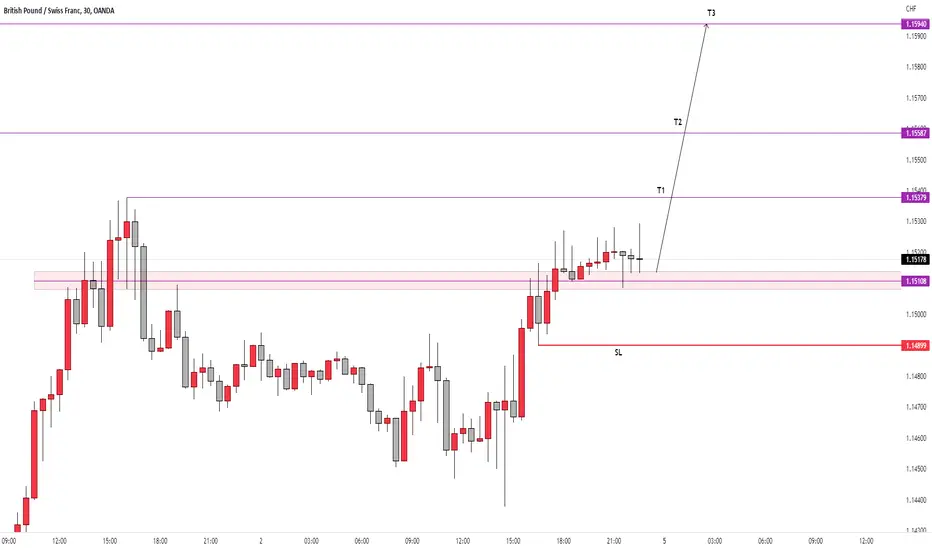
GBP/CHF LONG TRADE Hello traders
In the next trading session, we await GBP/CHF for a buying opportunity if we get confirmation that the trade will be executed
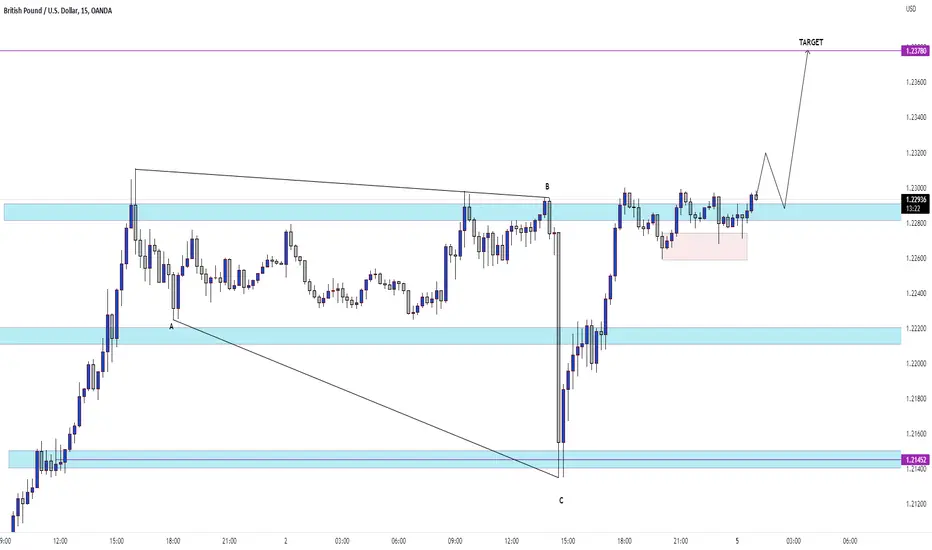
GBP/USD LONG TRADE Hello traders
In today's trading session we are buying GBPUSD
Target
Level 1.23780
Possible selling opportunity for CADCHFHey traders
Possible selling opportunity for CADCHF If we get a change in character from the supply area, we can sell CADCHF
Bottom is the first target
