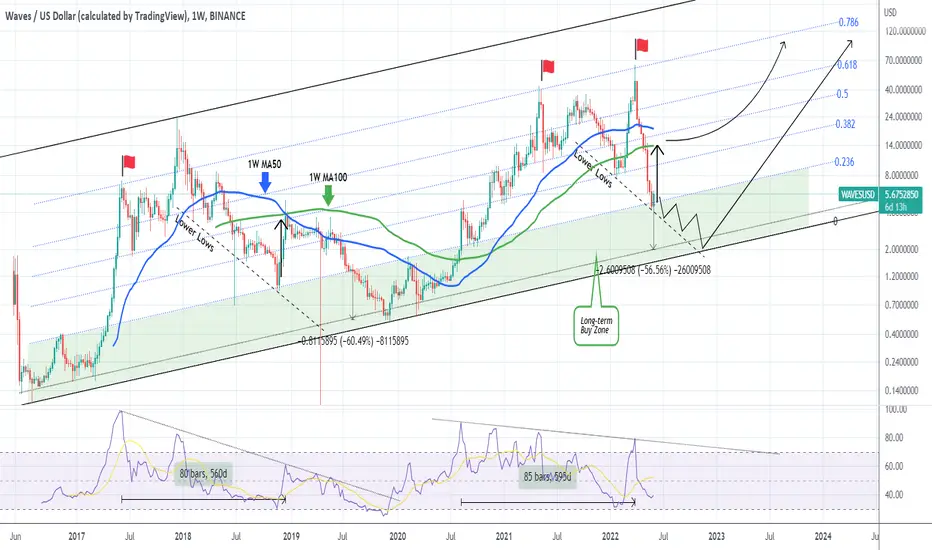
WAVESUSD entered the multi-year Buy Zone but can go even lower.Waves (WAVESUSD) has been trading within a long-term Fibonacci Channel. All major Fib retracement levels have played a key role to its trend, forming clear Support and Resistance levels.
This analysis is on the 1W time-frame, where last week, the price entered the Channel's long-term Buy Zone (green area), which has been holding since July 2016. Waves immediately rebounded this week, which is technically justified as this has happened another three times (June 25 2018, November 26 2018 and October 05 2020 1W candles).
However, the late July/ early August 2019 Buy Zone test failed and the price slowly but steadily declined another -60% to reach the Higher Lows (bottom) trend-line of the Fibonacci Channel. As a result, if we don't close back to last week's level, this rebound can be sustainable on the medium-term but only a 1W candle close above the 1W MA100 (green trend-line) seems able to technically reverse the trend to long-term bullish again.
P.S. Notice the near perfect symmetry between Cycles as portrayed by the 1W RSI.
--------------------------------------------------------------------------------------------------------
Please like, subscribe and share your ideas and charts with the community!
--------------------------------------------------------------------------------------------------------
Wavessignals
WAVESUSD This time is different...Waves (WAVESUSD) has posted an incredible rally ever since the February Low and made yesterday a new All Time High. Needless to say that the $43.00 target we suggested in our most recent idea, was hit:
What we should focus on now is the 1D Golden Cross (when the 1D MA50 crosses above the 1D MA200), which was formed yesterday. This pattern is technically bullish, however the last two formations (January 06 2019 and February 09 2020) marked strong corrections instead of bullish trends. We can argue though that Feb-March 2020 was a 'Black Swan' event, the COVID pandemic crash, which is an irregularity happening outside the technical borders.
During these Golden Cross formations though, the 1W MA50 (red dotted line) was above the price action and in fact rejected the peaks, while in contrast now is below acting as a Support. This is a strong indication that Waves is in a different phase now, being in a new Bull Cycle.
If true, that should draw comparisons with the previous Bull Cycle:
As you see in the wider chart above, the targets of that Bull Rally were first the 1.5 Fibonacci extension and then the 1.786 Fibonacci extension. If history gets repeated in a proportional way, then currently the 1.5 and 2.0 Fib targets are around $80.00 and $126.50 respectively.
Do you think those could be rather conservative estimates for WAVESUSD this time?
--------------------------------------------------------------------------------------------------------
** Please support this idea with your likes and comments, it is the best way to keep it relevant and support me. **
--------------------------------------------------------------------------------------------------------
