XAU/USD Setup According To Middle East EscalationHello Friends.
Im back with a broad perspective on GOLD.
According to happening these days in Middle East
(Hamas Terrorists against Israeil war) there are a perfect
catalyst for Gold to See Upper levels.
Lets take a look at Multi timeframe charts:
1)Daily chart
In 1D chart we can see a bearish trendline that price will see it again in coming days.
Here is where MAs meet each other (200 and 100 MAs are more important) and also there is
a strong resistance level there (1900 level).
after fall into 1800 - 1810 support level we saw a Strong Demand in Gold market
and price started to rise with a Bullish Engulfing pattern occurs in this level.
You can see my explanation in chart below :
2)Elliot Wave Count (15m Timeframe)
When we look at Gold Elliotly (:D) we can see a 5wave impulsive wave being completed as
1st wave of an upper degree Wave.
So you can see my wave count in chart below and due to Market Catalyst the correction wave
Supports at 23.6% Fibo level.
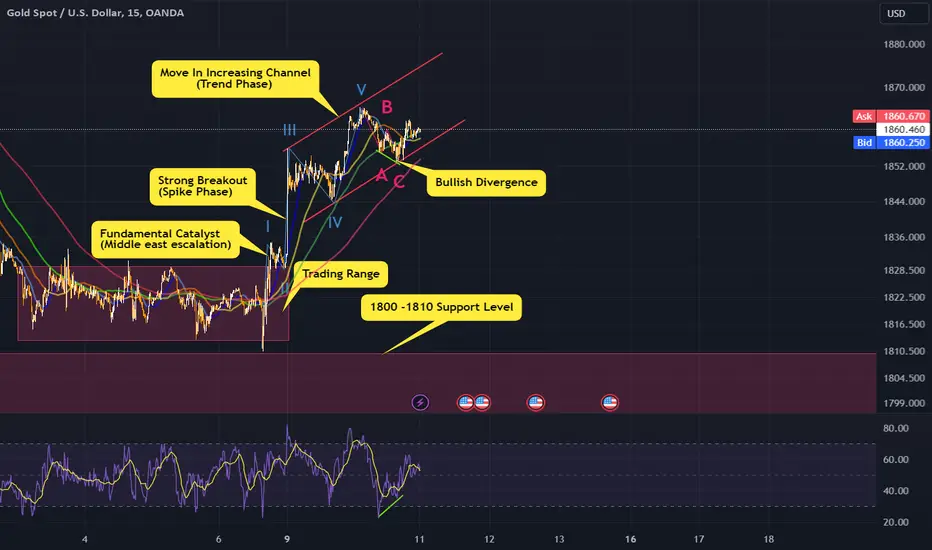
3)15m Price Action
As you can see in my main chart , near the 1800 support level , a Trading range shaped
and we see a strong Breakout after the News abot war.
This made a Spike phase (With an UP GAP at market opening).
Now we passed spike and go throgh an increasing channel.
Whats more is that we saw a Bullish Divergence between Price action and RSI.
Finally , I think Gold going to be bullish in cimig days and at least reach the 1900 level.
I hope you enjoy my idea.
PLZ share your opinion with me in comments.
Thank you ALL
#Worldpeace
Wavetheory
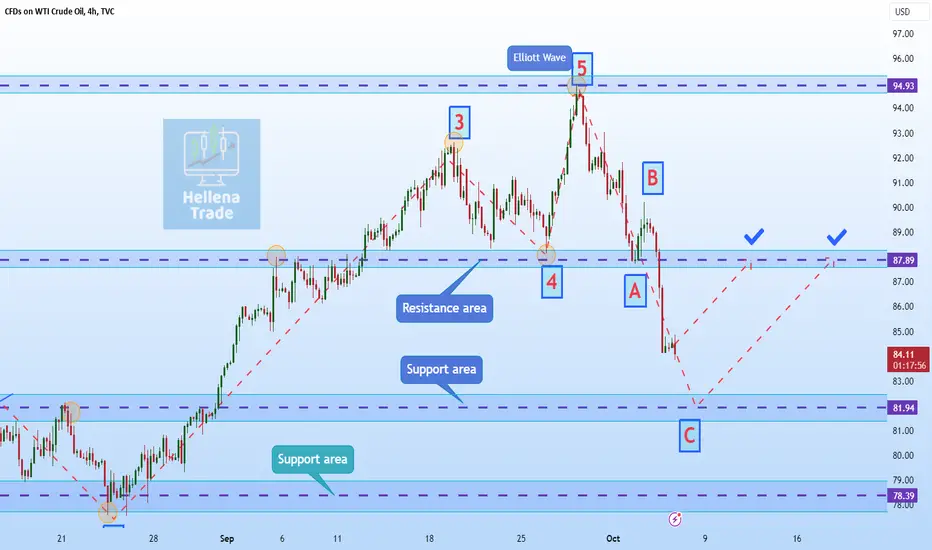
Hellena | Oil (4H): Long to resistance area at 87.89.Dear colleagues, I assume that the price will still make an upward movement at least to the resistance area of 90. It will do it either immediately or after correction to the support area at 84.26. In any case, I expect the price to rise in the coming week.
Manage your capital correctly and competently! Only enter trades based on reliable patterns!

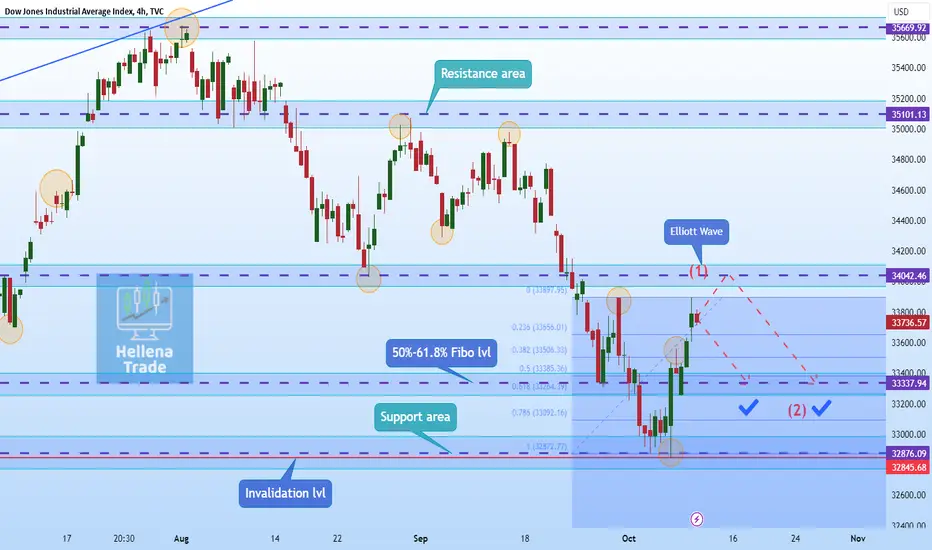
Hellena | DJI (4H): Short to 50%-61.8% Fibo levels 33337.94Dear Colleagues, I assume that the price will make a wave 2 correction to the area of 50%-61.8% Fibonacci levels 33337.94. In general, I assume that the price will rise after the correction.
Manage your capital correctly and competently! Only enter trades based on reliable patterns!
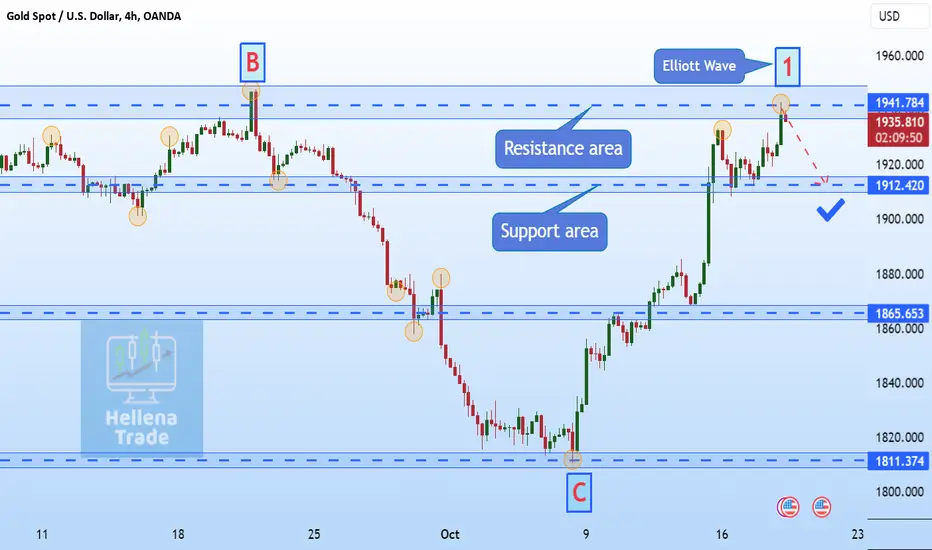
Hellena | GOLD (4H): Short to support area 1912Dear colleagues, I assume that the price will move to the support area of 1912. This movement is the beginning of corrective wave 2.
Manage your capital correctly and competently! Only enter trades based on reliable patterns!
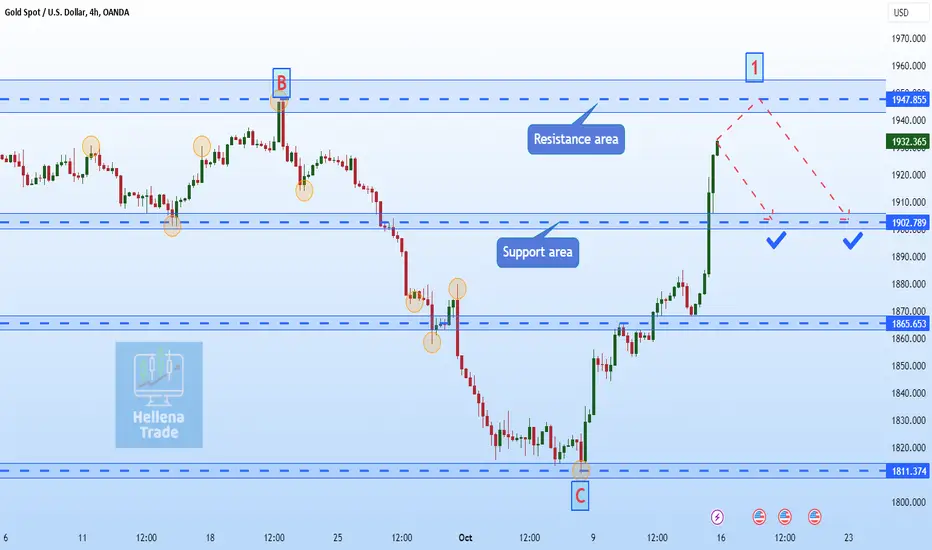
Hellena | GOLD (4H): Short to support area 1902.Dear Colleagues, I assume that in the coming week the price will correct to the support area of 1902. It is quite possible that before that the price will update the maximum of the previous week and move to the resistance area of 1946.
Manage your capital correctly and competently! Only enter trades based on reliable patterns!
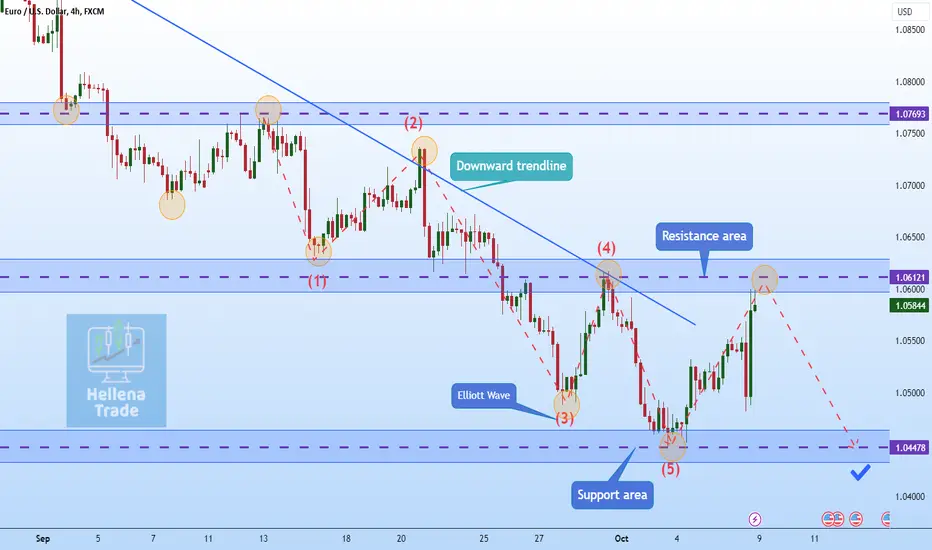
Hellena | EUR/USD (4H): Short to support area is 1.04000.I assume that the price will continue to move in a sideways movement. The resistance area is 1.06121, support area is 1.04000. I expect movement to the support area and consider only short positions.
Manage your capital correctly and competently! Only enter trades based on reliable patterns!
Hellena | GBP/USD (4H): Short to minimum of wave 3 at 1.20410.I assume that wave 4 is completed, but it is possible to update the local maximum in the area of 1.23023. In any case, I consider only short positions with the aim to complete the 5 wave structure. The nearest target is the minimum of wave 3 at 1.20410.
Manage your capital correctly and competently! Only enter trades based on reliable patterns!

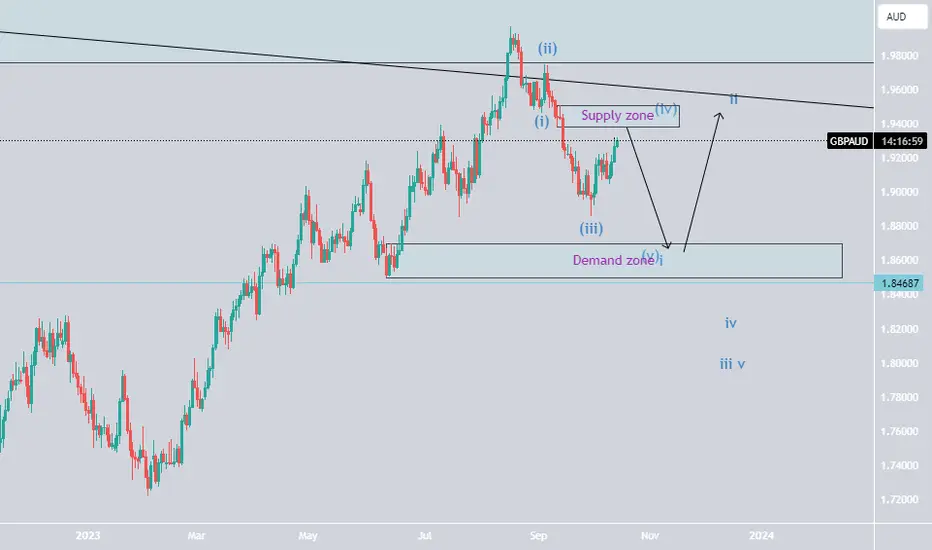
GBPAUD sellThere is a weekly supply in control. In daily, we are currently on wave (iv) of i. We look to see a bearish continuation move once it taps daily supply at 1.93810. See you at 1.8700 Bingo!
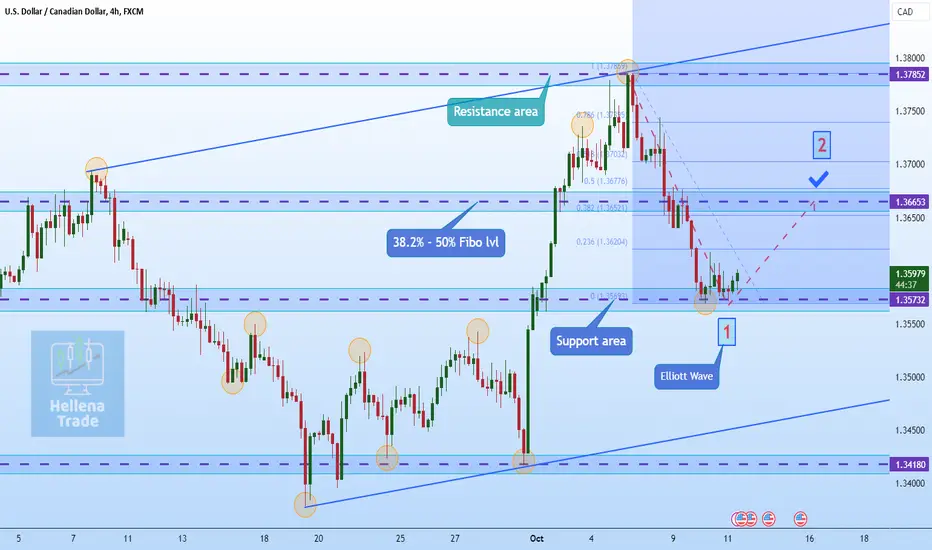
Hellena | USDCAD (4H): Long to 38.2% - 50% Fibo levels 1.36646.Dear Colleagues, I assume that the price will make a correction of wave 2 to the area of 38.2% - 50% Fibonacci levels 1.36646. In general, I assume that the price will fall after the correction.
Manage your capital correctly and competently! Only enter trades based on reliable patterns!
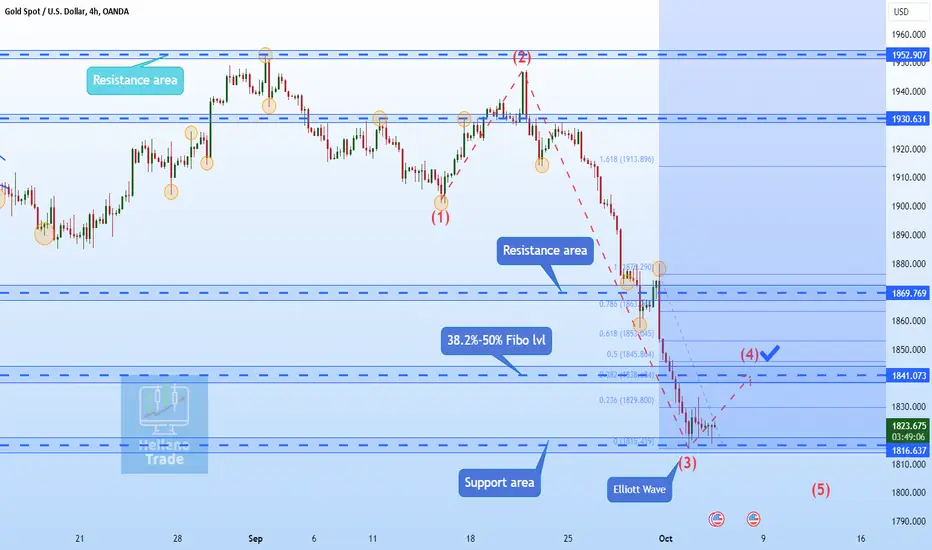
Hellena | GOLD (4H): Short to 38.2%-50% Fibonacci lvl 1840.Dear colleagues, I assume that the price will make a small correction to the 38.2%-50% Fibonacci level area of 1840. Once the target is reached, I will scrutinize the situation. It is quite possible that after that the price will renew the high of 1865. 1865 is the level of zeroing and in this case we will have to redraw the waves.
Manage your capital correctly and competently! Only enter trades based on reliable patterns!
DXY Expanding flat is not yet completeDXY Expanding flat is not yet complete.
A more room for down till IMBALANCE GAP area, from which to bounce up.
Target 1 is the expanding flat pattern completion point, where abc started.
Target 3 is a measured move.
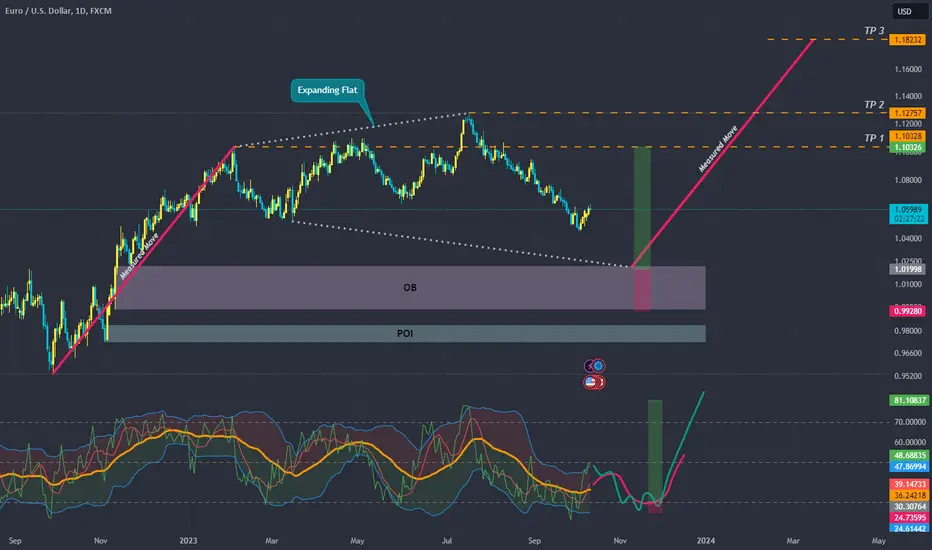
DXY Expanding flat is not yet completeDXY Expanding flat is not yet complete. More room for up move till Imbalance Gap area, from which to bounce down.
Target 1 is the expanding flat pattern completion point, where abc pattern started.
Target 3 is a measured move.

Hellena | Oil (4H): Long to resistance area 87.89.Dear Colleagues, The price continued downward further than I thought it would. I believe that wave C may reach the support area of 81.94, then I expect the price to rise. The nearest target is the resistance area at 87.89.
Manage your capital correctly and competently! Only enter trades based on reliable patterns!
euraud is strong sellhi guys how are you
euraud is sell by smc and rtm in my structer
please suppoet me by like and comment

Hellena | USDCAD (4H): Short to support area at 1.36293.Dear Colleagues, I assume that the price has completed wave 3 and is starting the correction in wave 4. The nearest target is the support area at 1.36293. The price may update the maximum, then the target will not change.
Manage your capital correctly and competently! Only enter trades based on reliable patterns!

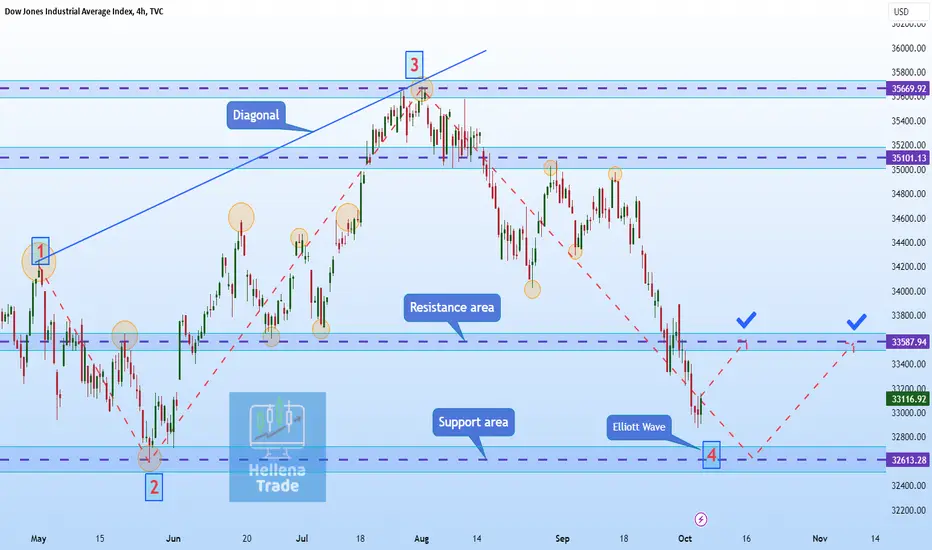
Hellena | DJI (4H): Long to 38.2% Fibonacci level 33888.Dear colleagues, I believe that wave 4 is complete. I expect that wave 5 will go minimum to 38.2% Fibonacci level 33888. Updating the minimum and reaching the Invalidation level will mean canceling the scenario, because wave 4 cannot update the minimum of wave 2.
Manage your capital correctly and competently! Only enter trades based on reliable patterns!

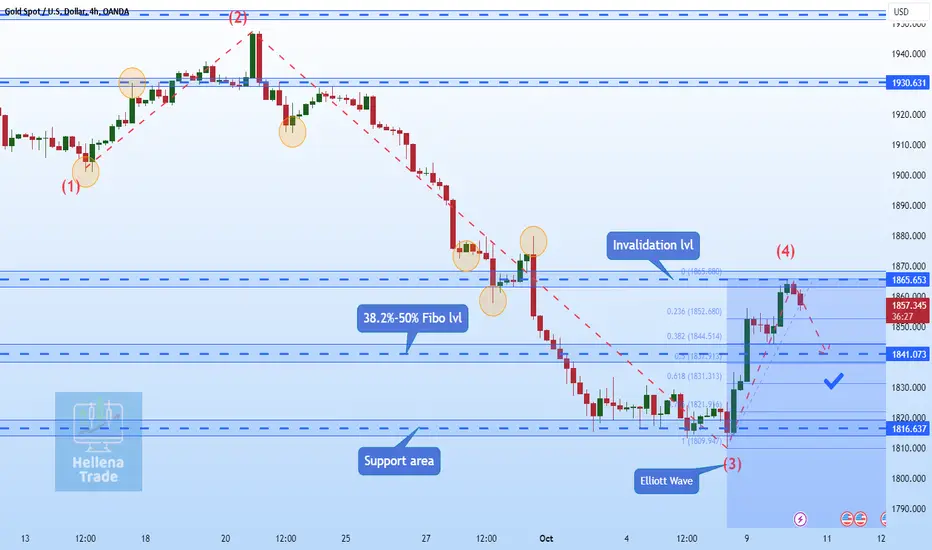
Hellena | GOLD (4H): Long to 38.2%-50% Fibonacci levels 1840.Dear colleagues, I analyzed gold for a long time and realized that the price has updated wave 3. This means that I am waiting for a correction of wave 4, after which I assume that there will be an update of the low of wave 3.
At the moment I expect correction of wave 4 with the aim to reach the area of 38.2%-50% Fibonacci levels 1840.
Manage your capital correctly and competently! Only enter trades based on reliable patterns!
Hellena | DJI (4H): Long to sresistance area 33587.Dear colleagues, the price continued its downward movement. This means that wave 4 is stretching further than I thought. At the moment I assume that the price may reach the support area 32613.28. Then I expect growth and the beginning of the formation of wave 5. The nearest target is the resistance area 33587.94.
Manage your capital correctly and competently! Only enter trades based on reliable patterns!
BTC/USDT Short-Term: A spot for 14:1 Reward Ratio!!!Upon analyzing the 4-hour chart of Bitcoin, a significant price pivot at the $24800 (A) in the past September is revealed, underscored by a bullish RSI divergence within the same timeframe. This insinuates that the preceding wave, which oscillated between $30000 and $25000, has tapered off, paving the way for a prospective trend shift.
Nonetheless, it remains ambiguous whether wave (B) has come to a close, leading to two plausible trajectories for the impending bearish tenor of wave (C).
In the first scenario, the price plummets, breaching the $25000 support level promptly.
Conversely, the second scenario anticipates a bounce above $25000, thus elevating our present high point for wave (B) at $28.5K. This unfolds into a well-defined head and shoulder pattern initiated in March 2023.
Examining Ethereum's price motion could lend insight into the likelihood of the second scenario unfolding.
The Ethereum daily chart traces the wave at the pinnacle of $4900 in December 2021, culminating at $880. This segued into the subsequent wave (B) terminating at $2100.
Post the trend alteration at $2100, it's logical to envisage the onset of a new wave. A descending wedge pattern has recently been observed, alongside a daily RSI divergence between waves C and E within this pattern. When perceived as a falling wedge of a leading diagonal, the rally from $1550 to $1750 appears lackluster, both in magnitude (Fibonacci .382) and duration, relative to the leading diagonal's dimension. Consequently, a more feasible hypothesis is the formation of a double bottom pattern post a rally to our preceding apex near $2000.
In light of the current analysis, initiating a short position around $28K BTC is enticing due to the favorable risk/reward ratio of nearly 14, with a stop loss meticulously placed at $28.5K.
For the sake of simplicity and easier understanding, I have abbreviated the Elliott Wave counts as (A)(B)(C) throughout this analysis.

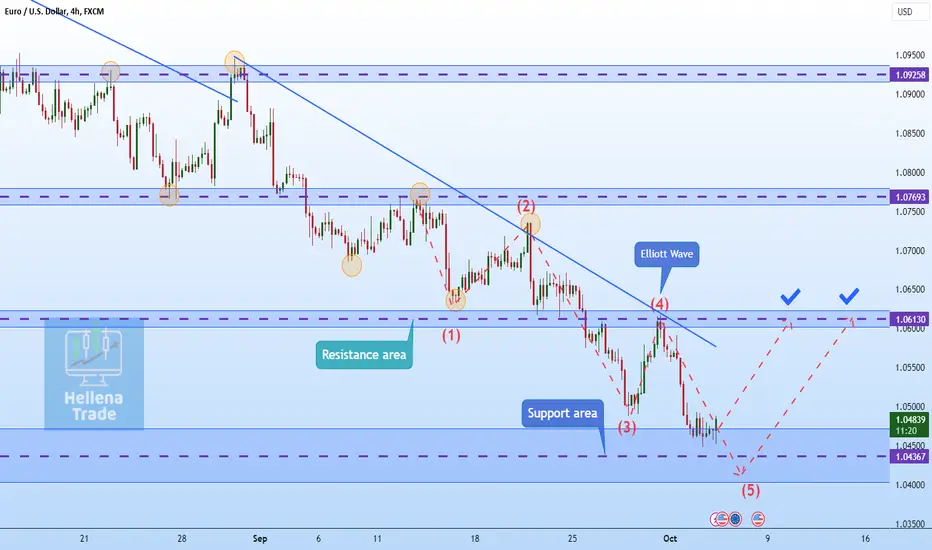
Hellena | EUR/USD (4H): Long to resistance area 1.06130.at the moment the price is completing wave 5. It is possible to update the low, so I am marking a wide area for a set of long positions. The nearest target is the resistance area at 1.06130.
Manage your capital correctly and competently! Only enter trades based on reliable patterns!
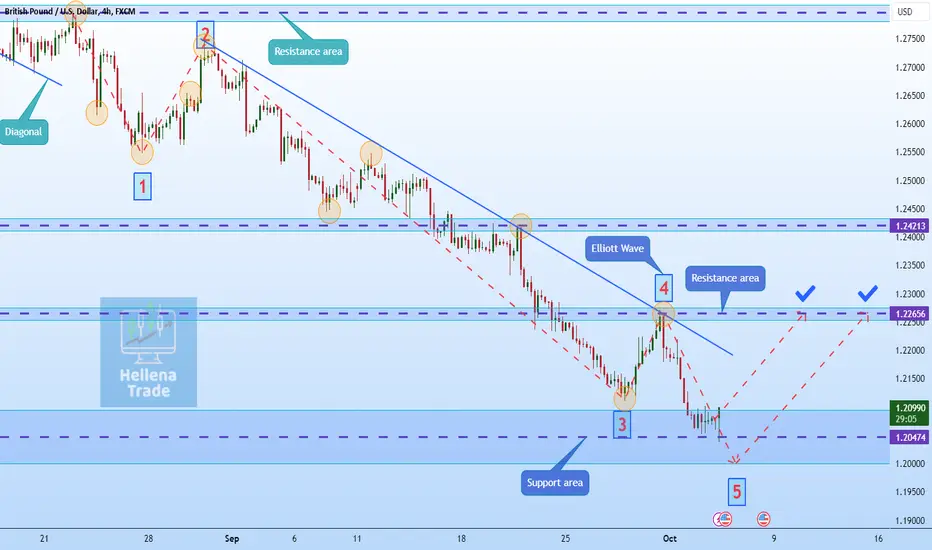
Hellena | GBP/USD (4H): Long to resistance area at 1.22656. Dear Colleagues, at the moment the price is completing wave 5. It is possible to update the low, so I am marking a wide area for a set of long positions. The nearest target is the resistance area at 1.22656.
Manage your capital correctly and competently! Only enter trades based on reliable patterns!
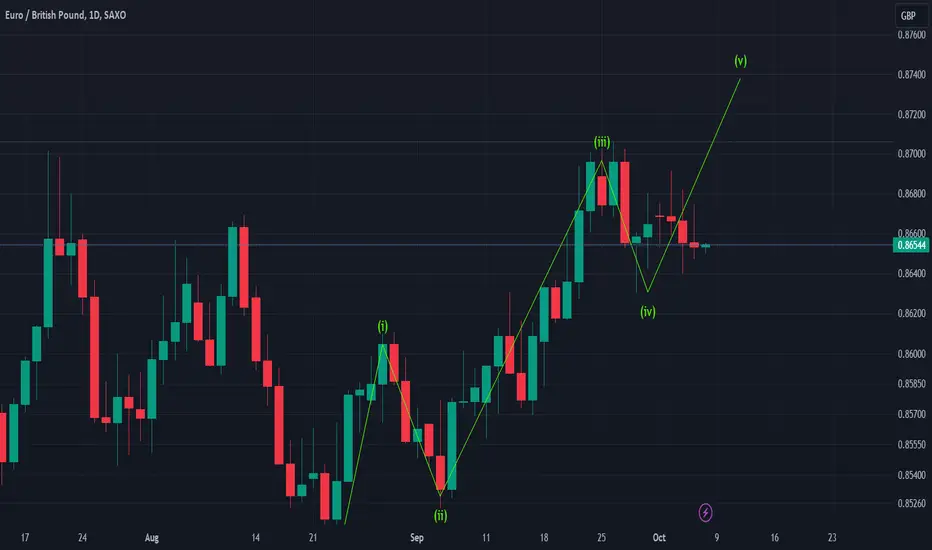
All in Long EURGBPOn the weekly, #EURGBP
is very bullish and it is making a corrective wave 4, take a buy from here to 0.88 and possible to the moon.
Sellers are finding it difficult for them to push the price down because it is very bullish.
Never counter a trend,
Follow the bullish trend and go long!!!!
Don't miss out of such breakout trade as weekly is very bullish.
Always buy on a correction.
Trading with the trend is easier than being against the tide.
#forex FOREXCOM:EURGBP SAXO:EURGBP #elliottwave #wave theory
Ichimoku Wave, entering Second set of Cycles (Round Two) Each round contains three cycles of waves. We are looking for a correlation between Wave one in Round Two compare with behavior of Wave One in the first cycle of Round One.
Im expect that AUD go lower till the place marked for reveres to bullish or continuation of bearish.
