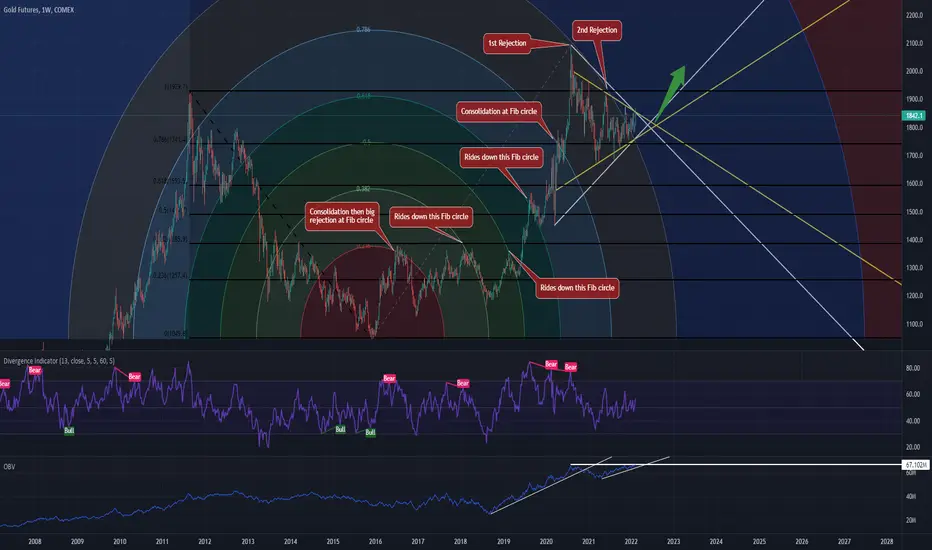
Gold coiling up for a big moveIt's been a long time coming but it looks like the Gold break out is getting very close now.
On the chart there is 2 visible wedge patterns, one takes the extremes / outliers into account (trend lines marked in white) and the other excludes the outliers (trend lines marked in yellow), both are near the end.
There is further confluence with the OBV indicator also in a tight wedge pattern. Using trend lines on the OBV is great for picking breakouts and breakdowns in price. Question here is which way will it break???
With the economy slowly turning to poo there is a strong fundamental case for increase in Gold prices but another clue may lay in the Fib Circle chart that I have used. With the Fib Circle centred at the 2016 low this chart shows that at each new band the price has had two distinctive reactions. First the price typically touches or goes marginally across / through the band and then has a fall, there has been only one band which had some consolidation but no major fall. The second reaction after the fall, when price has somewhat stabilised and moved into the new Fibonacci Zone the price then strongly climbs up again. It has only been the most recent run (within the grey Fib zone) that has experienced price falling back deeper than the original dump when it moved into this new zone.
To sum up I'm bullish on Gold. Price has just entered a new Fib Circle Zone and I think a breakout to the upside within a month (or perhaps two) is highly likely and then a run up to make new highs could follow.
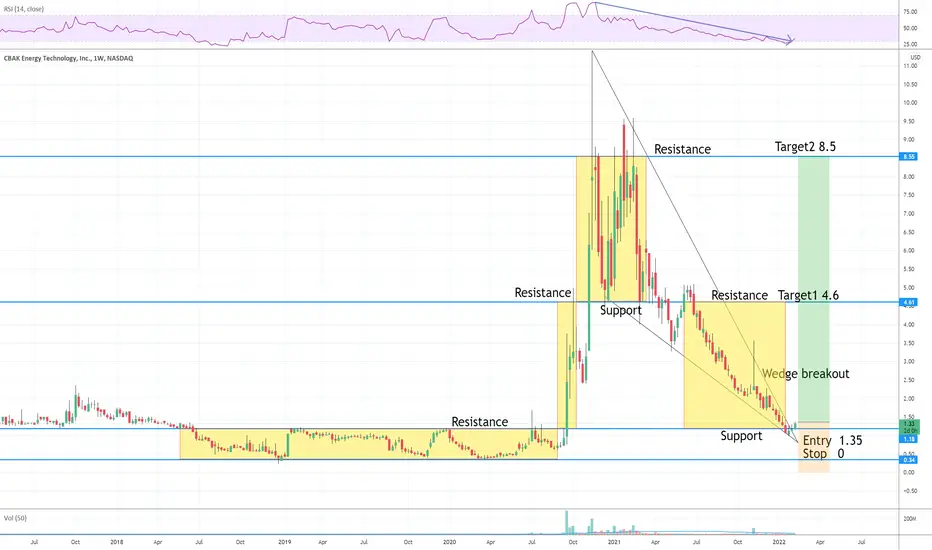
Wedgebreakout
CBAT LongDowntrend Wedge breakout
Weekly Support line confirmation
Entry 1.35
Stop 0 -- no Stop, this is gamble
Target 4.6, 8.5
Risk management is much more important than a good entry point.
I am not a PRO trader.
In my trading plan, the Max Risk of each short term trade should be less than 1% of an account.
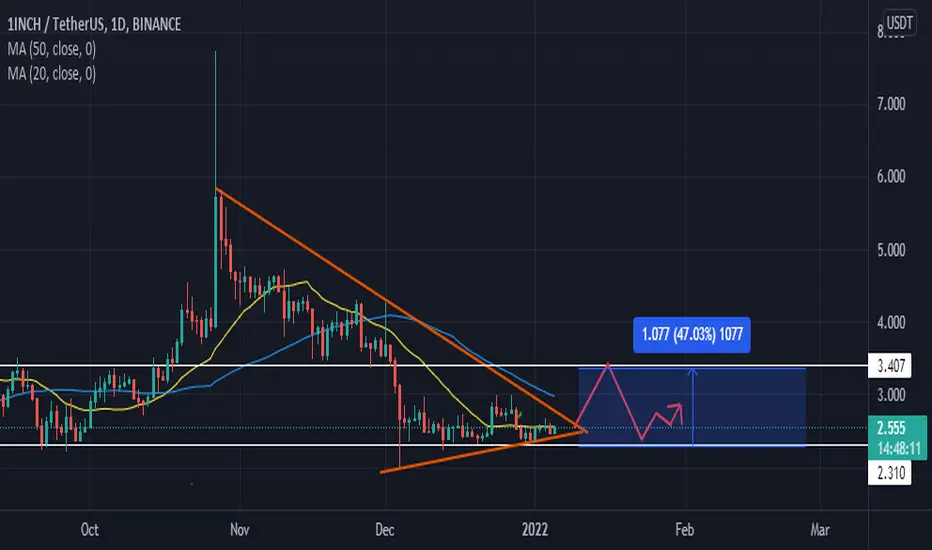
Breakout complete, need a retracementband broke out of this wedge and now it needs to step back a bit. rsi helped me confirm this idea and now just need to wait and then go long.

Bitcoin movement on hourlyWe're seeing our upwards trend continue this could confirm the beginning of a giant breakout. Obviously don't take this as advice this is just a look at chart, this is not advice on wether to sell or buy. BINANCE:BTCUSD

Trend Reversal- Wedge PatternAfter a down fall of last week, Nifty taken a support on extended trend line of previous downward channel and consolidated for last 4 sessions. Today, it given a breakout of wedge pattern. It is a reversal pattern.
Short term view of next 4-5 session suggests, nifty to move at 18000 level.
consider, 17450 as support

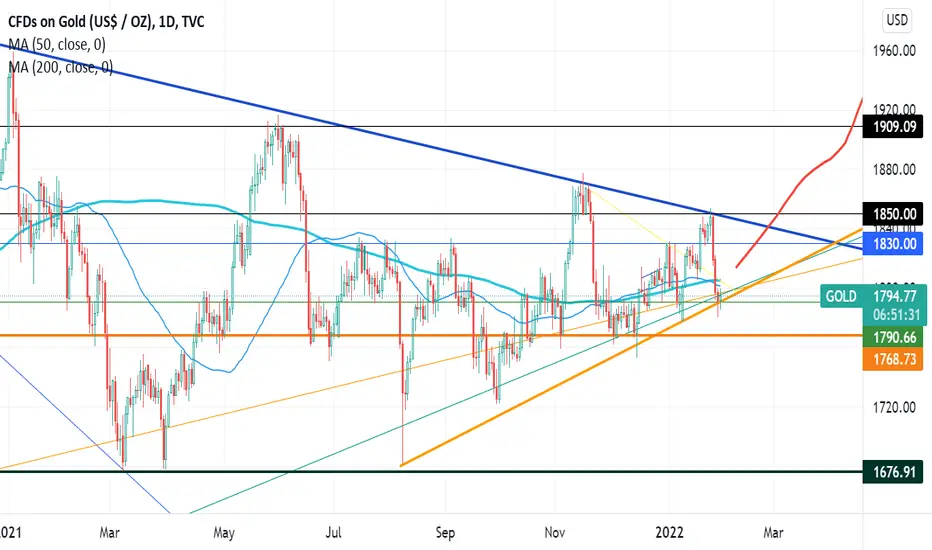
Lower highs and higher lows mean higher prices in goldIn 2005 breakout, we saw lower highs and higher lows,
In 2009 breakout, we saw lower highs and higher lows. This didn't reach it's peak until 2011.
What will come next with our current setup?
SPX500 about to breakout of wedge !? Looking at RSI and VOLSPX is right now about to break the Resistance of its falling broadening wedge.
We have solid support underneath.
Printed bullish divergence on RSI 4h
And for the first time since dumping we see buying Volume coming in.
Also divergence on Volume turning around (wyckoff style) moderate Volume easily drives price up

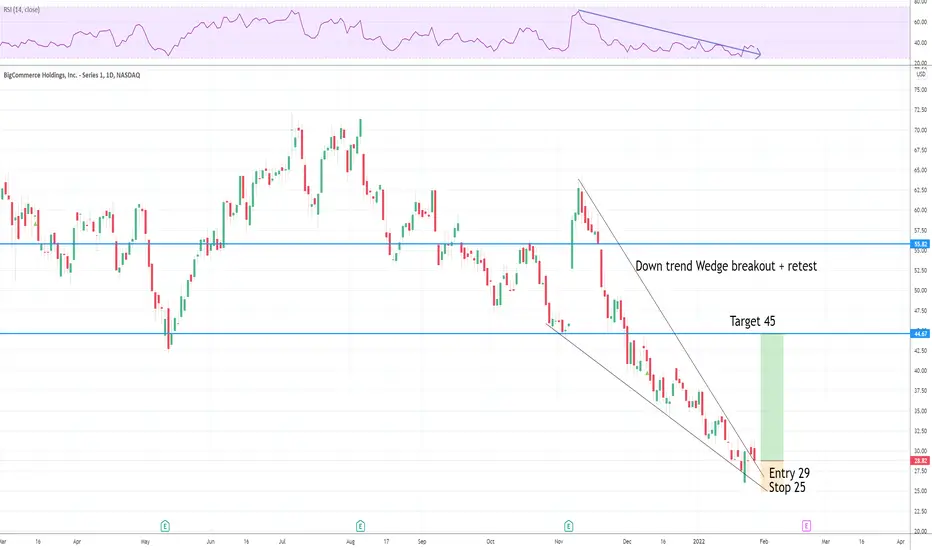
BIGC LongDown trend Wedge breakout + retest
Entry 25
Stop 29
Target 45, 55
Risk management is much more important than a good entry point.
I am not a PRO trader.
In my trading plan, the Max Risk of each short term trade should be less than 1% of an account.
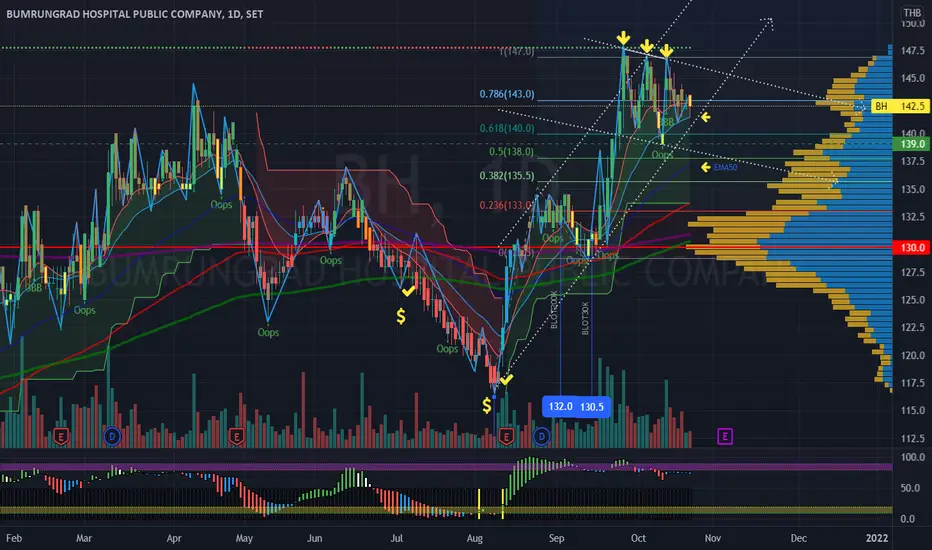
BH | 1st Target Reached | Triple Top Pattern - Take ProfitBH | Thailand SET Index | Health Care Sector | Price Action Analysis
First Target Reached with triple top chart pattern - Take Profit recommendation - Sell 50% or all out
> Currently forming downtrend wedge pattern structure.
EGLD - Breakout of falling wedge expected soonEGLD has been on a downward trend so long after it hits its all time high. Now expecting it to breakout of the falling wedge, HA candles are turning green and RSI coming out of over sold territory. As long as BTC stays positive the previous ATH can be seen quicker

AUDIOUSDT is creating a falling wedgeThe price is creating a falling wedge on the daily timeframe, after a bounce on the weekly support.
On the lower timeframe, we can see that market had a breakdown from 4h support now new resistance
How we can trade this scenario?
I'd like to see a breakout from the falling wedge and 4h resistance with volume, Wait for a successfully flip of 4h resistance into new support.
If that WILL BE THE case we ARE GOING TO apply our Plancton's rules and look for a new long position.
Beware of weekly resistance (red one) because the price could get a rejection.
–––––
Follow the Shrimp 🦐
Keep in mind.
🟣 Purple structure -> Monthly structure.
🔴 Red structure -> Weekly structure.
🔵 Blue structure -> Daily structure.
🟡 Yellow structure -> 4h structure.

SAWAD|Powerful 3 Drive Harmonic Breakout|Med-term Buy SetupSAWAD | Thailand SET Market > Financial Sector | Price Action & Chart Pattern Trading
> A powerful breakout from weekly timeframe 3 drive harmonic pattern
> Med term run trend ENTRY position with an estimated minimum target of 3 drive harmonic pattern
> RSI bullish signal crossover MA above 50.
> MACD golden cross signal above baseline
Trade with affordable risk ratio 3.5:1
Always respect your stoploss
Good Luck

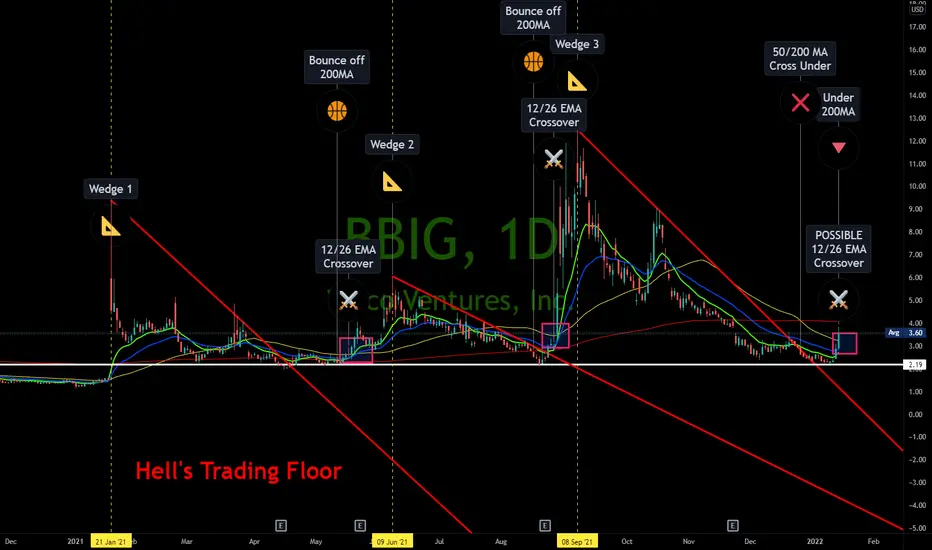
BBIG on a breakout? Testing 200 MA?Wedge 1, retracement after run up, break out of pattern using underlying support, bounce off 200 MA, 12/26 EMA crossover, run up
Wedge 2, retracement after run up, breakout of pattern using underlying support, bounce off 200 MA, 12/26 EMA crossover, run up
Wedge 3, retracement after run up, breakout of pattern using underlying support, 12/26 EMA cross over possibly coming, this time trading under 200 MA
200 MA major resistance but a break above is BULLISH to me - look for golden cross if bulls maintain control.
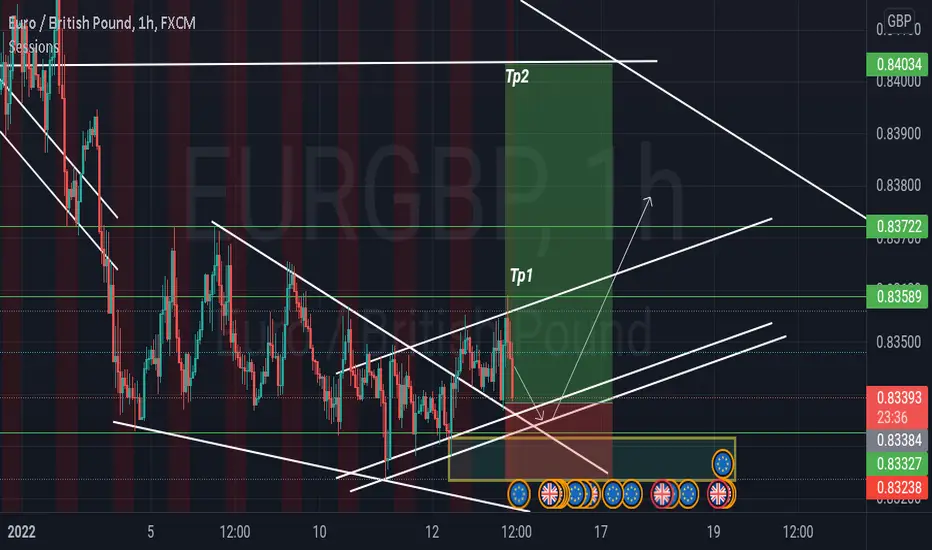
Wedge pattern breakoutSo we just broke out and about to follow through with a retest of the rejection level. Price has been grinding downward for quite some time so it is likely a nice pullback or momentum shift that is about to occur. I have profit levels set in the picture as well as entry and stop loss levels. Good luck traders.
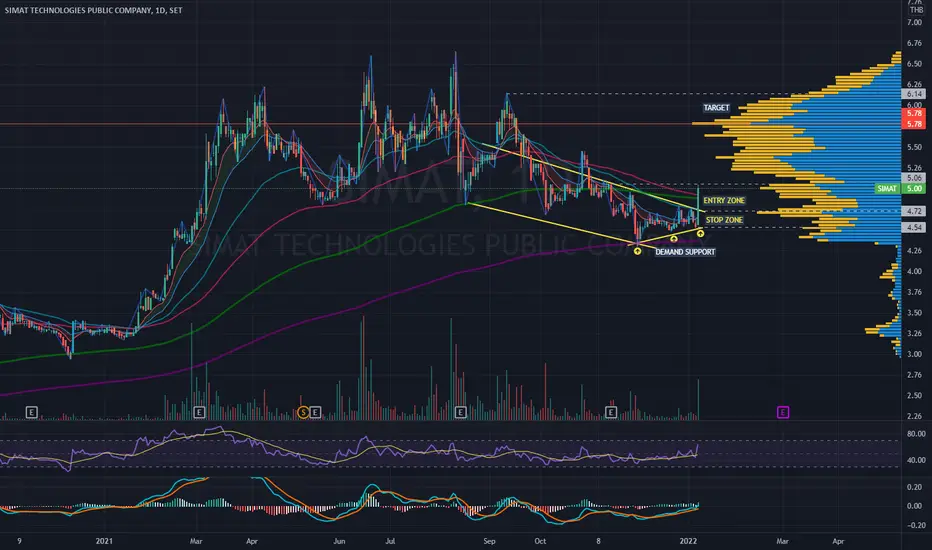
SIMAT | Bullish Wedge Breakout | Entry @ Pullback PositionSIMAT | Thailand SET Index | Price Action & Chart Pattern Trading
> Falling Wedge Reversal Pattern - Breakout with strong momentum candlestick
> Entry @ Pullback position - strong resistance volume on top of breakout candlestick
> RSI bullish cross up MA line above 50
> MACD bullish signal crossing up baseline 0
Trade with affordable risk ratio 3:1
Always respect your stop-loss
Good Luck
Bitcoin DivergenceHello everyone
Before we start a discussion, it is my pleasure to read your opinion on this post's comment section and support this idea with your likes if you enjoyed it !
BTCUSDT :
bitcoin was printing a descending wedge and meanwhile, a divergence between the price and MACD was seen.
the price reacted to the very important support zone and then, braked the descending wedge pattern.
A short term rising trend is possible.
I determine the SL and TP for a good R/R ratio.
please remember any analysis can be failed. so, manage your risk and respect your stop loss.

Double bottom in AMCA textbook double bottom is forming in AMC . With no particular news coming out today regarding the stock, this is a opportunity to add to your long position. Some good news could see this stock back to $33.05.

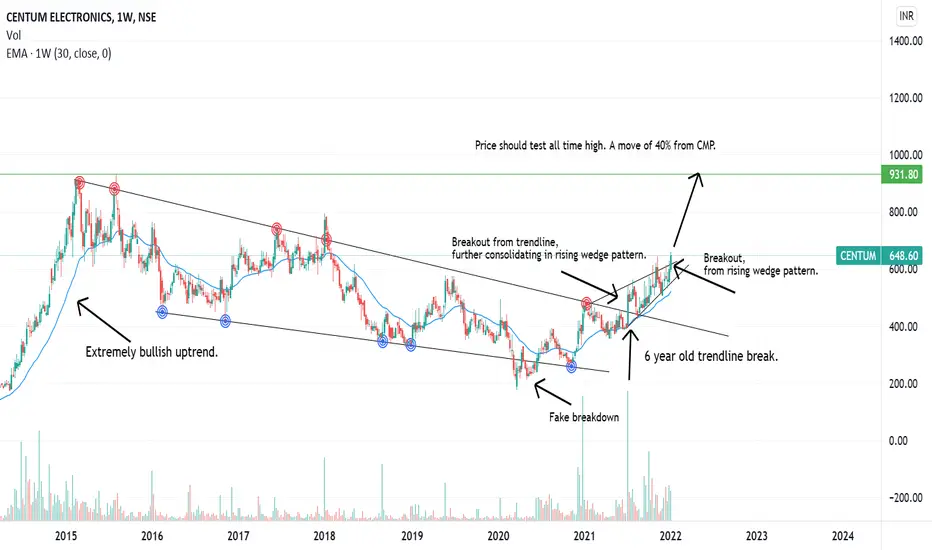
CENTUM ELECTRONICS PRICE ACTION ANALYSIS 🔥📈NSE:CENTUM is forming beautiful price action patterns. Much of analysis is given on chart.
Targets- 900/1000+
Sl- 500, Trail below preferred MA's
DISCLAIMER: IDEA POSTED DURING OPEN MARKET. PRICE COULD LEAVE HUGE WICK.
Ford of the EDGE of a Breakout!F
Ford is on the cusp of a breakout to the upside IMO:
Sitting above its:
(3day Chart)
20/50/100/200 MA
12/26 EMA
(3day Chart)
MACD strengthening the last 2 trading days (was about to flip but did not)
Currently breakout out of its wedge for the past 1.5 months
Recent consolidation in the 119-20 has been broken
Ford yesterday (1/3/22) reached price levels that it has not seen in 20 years!
ALL NEWS IS POSITIVE on Ford -with the exception of overall car sales not rebounding to expectations in 2021
Ford has reissued dividends
Insider buying > selling
Ford bumping up production of the fully EV F-150 Lightning
seekingalpha.com

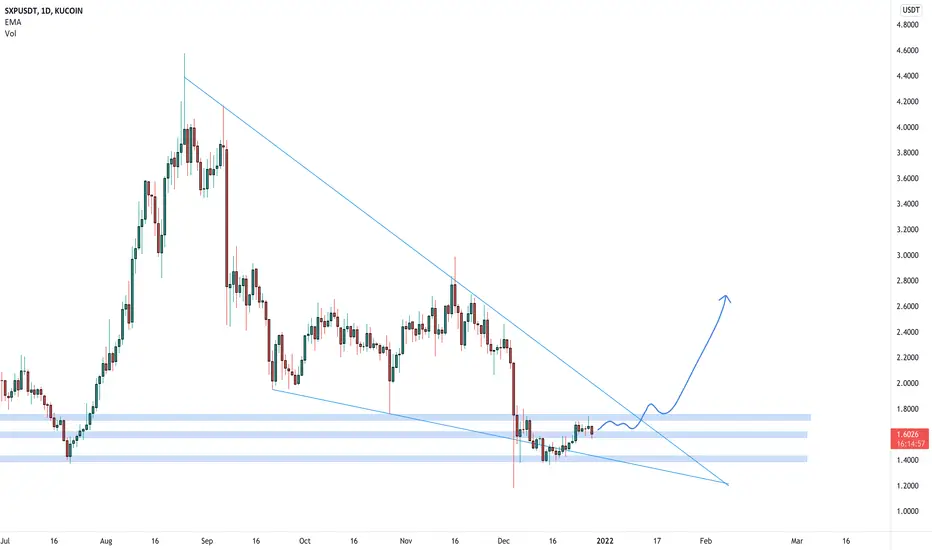
SXPUSDT is testing the daily resistanceSXPUSDT is testing the daily resistance inside a falling Wedge.
IF the price is going to have a breakout from the daily resistance and retest as new support, According to Plancton's strategy (check our Academy ), we can set a nice order
–––––
Follow the Shrimp 🦐
Keep in mind.
🟣 Purple structure -> Monthly structure.
🔴 Red structure -> Weekly structure.
🔵 Blue structure -> Daily structure.
🟡 Yellow structure -> 4h structure.
⚫️ Black structure -> <4h structure.
GJ pullback imminent.. longterm bullishFrom my analysis this is clear as day an ascending wedge on GBPJPY. I'm expecting a pullback (IF price doesn't break 156.000 resistance retests and proceeds bullish)
The bullish run looks to be exhausted from the wedge forming. From my experience it has to pullback to continue.
Overall, my analysis indicates a pullback starting the new year but looking bullish for the longterm of 2022.
Check it out let me know your thoughts. May 2022 be the most prosperous and successful year yet for you all!

IRPC | Bullish Wedge Breakout | Target for uptrendIRPC |Thailand SET Index | Energy Sector | Price Action Trading
Price Action | Bullish Breakout
Chart Pattern | Reversal Wedge
Indicator:
> MFI - Money Flow-in support
> RSI Bullish Signal
> MACD golden cross - crossing up 0
Fundamental Factor: Oil price bullish trend
Risk Ratio: 3:1 minimum
Always respect your stop-loss
Good Luck
