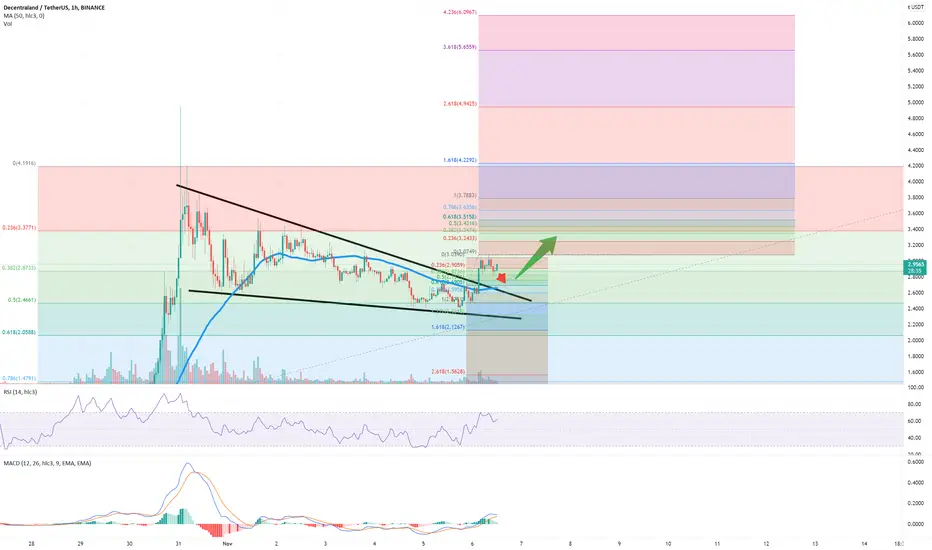
Wedge & Pullback ($MANA)If we consider MANA past leg , chart gone from 0.6 to 4...
We see a Ascending Channel Pattern
Fibo is saying everything ()
TP : Fibo extention of the break out leg from wedge
SL : Fibo retracement
Note : As always this is just an idea open positions at you own choice of risk
Wedgebreakout
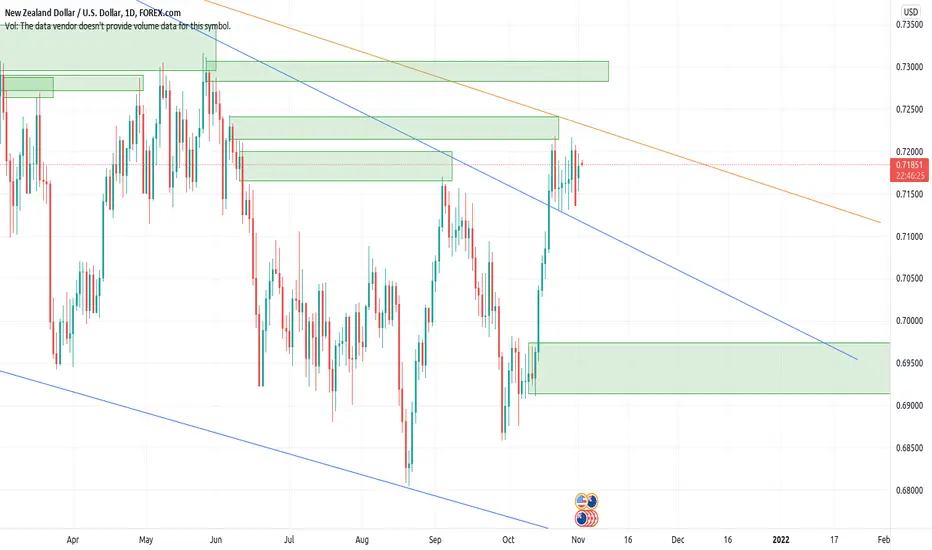
NZDUSD Daily OutlookNZDUSD broke out of the falling wedge, then it tapped the head of the range multiple times and then reverses.
Resistance turns to support on the wegde pattern.
Price finding it hard to break into the range again, will it break. touch the resistance of a new downtrend or the Bulls comes in one more time?
Anticipating a clearer view....
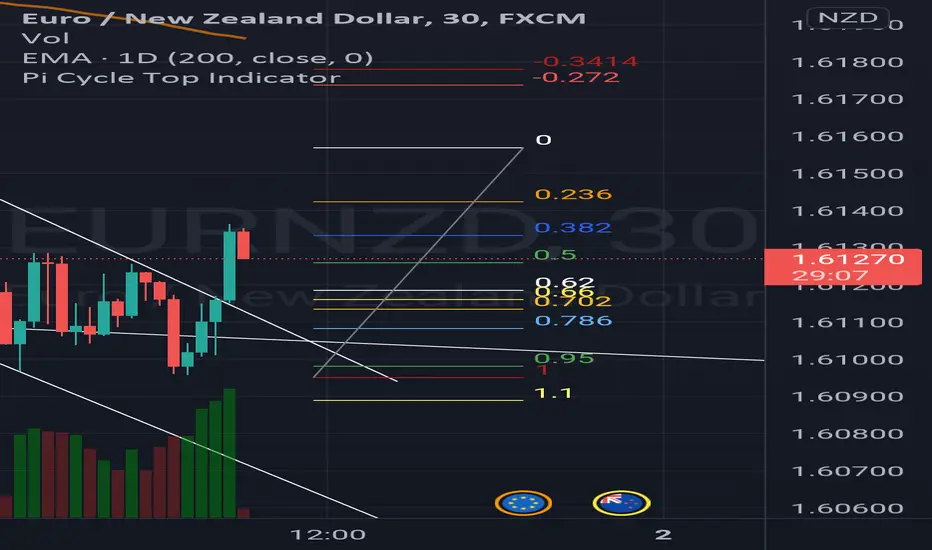
EURNZD IS READY FOR THE LEG UP😊After the wedge breakout, EURNZD should rise up to price 1.61550 with SL at 1.61050
Feel free to adjust your SL and TP
Trade it wisely😎
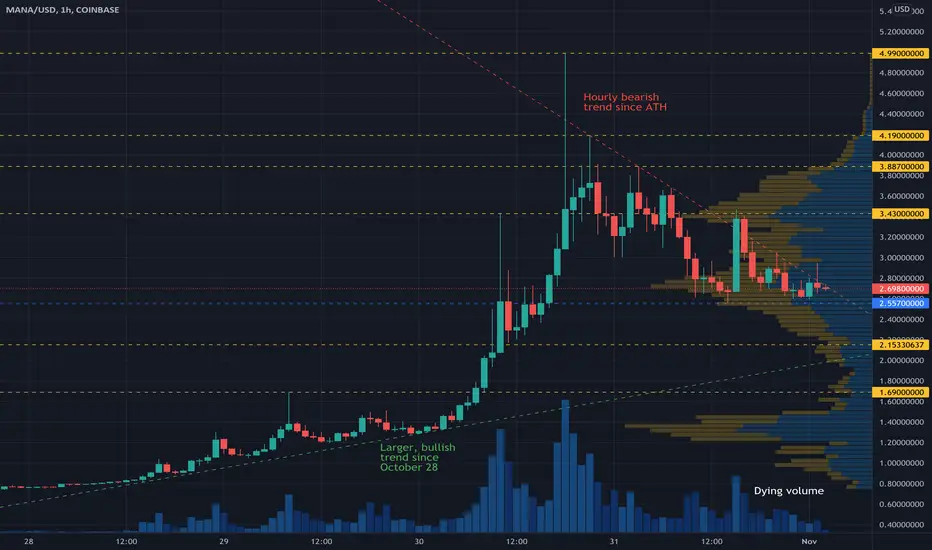
MANAUSD Descending WedgeA descending trend line since the ATH yesterday is visible on the hourly chart with multiple spikes occurring due to pump and dumps and/or covering of short positions (though I have not done enough research on short interest on MANA - likely bag holders are exiting positions with each new spike). $2.557 seems to be a crucial price of supply meets demand since October 30. Combine this price with the aforementioned descending trend line we see a descending wedge forming.
I anticipate a breakout from this pattern in the next few hours. A breakout down might imply further sell off to $2.1533, then further to $1.69. This collapse may be interrupted by the larger, bullish trend (which, from my interpretation, began on October 28). On the other hand, a breakout up may be met with supply/resistance at $3.43, from where a parallel channel may form (with $2.557 being support/demand zone) until the next large influx or efflux of volume. A breakout above $3.43 may imply further price movement toward $3.887, then potentially a retest of the ATH ($4.99).
The price targets I provide are my own anecdotal opinions and I observe them making room for error.
Regardless, volume is dying. The hype is waning. MANA volatility may wane similarly to other meme assets such as DOGE and GME. The purpose of this post is so future me learns from what I theoretically predict and what actually occurs.
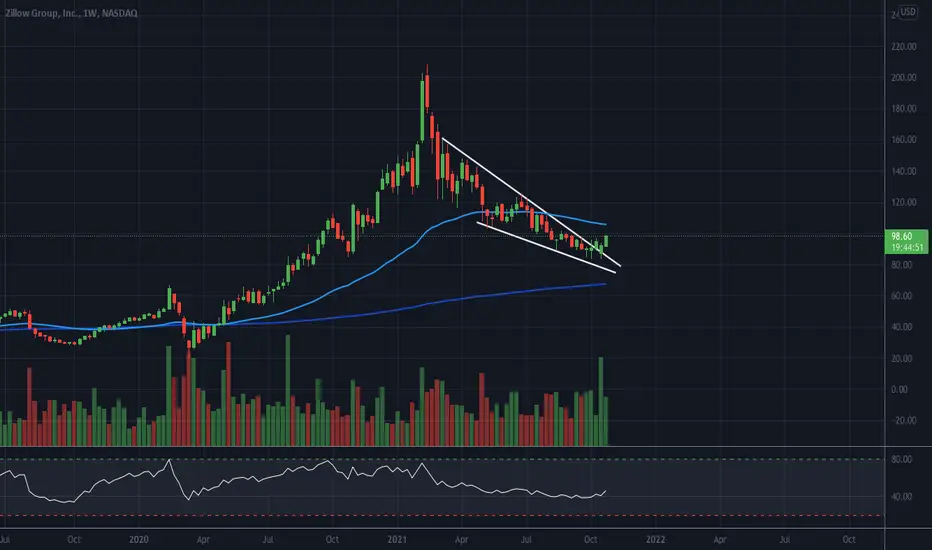
Z - Falling Wedge for the Win?!WEEKLY CHART
This is a classic falling wedge pattern! (I'm a little late to the party.)
- Strong volume
- Break above $107.10 (break above 50MA) should confirm a continuation of the bullish trend.
- 50MA could create some resistance around $101-$103.
I like Z $120 Call 1/21/22. I'm already in. (avg. $2.40)
CRV Hold #CRVUSDT Waiting for the Breakout
Follow our Tradingview Account for more Technical Analysis Update, | Like, Share and Comment your thoughts.

AMD LongWedge breakout
Entry 107.5
Stop 100
Target1 120
Target2 135
Risk management is much more important than a good entry point.
The max Risk of each plan should be less than 1% of an account.
I am not a PRO trader. I trade option to test my trading plan with small cost.

ATOM perfect time for entryAfter clearly respecting uptrend, price formed bullish wedge atop previous ath levels. Price broke down trend consolidation as well as middle zone, and is headed to new all time highs. My target profit is located at 1.618 fib level (highly respected level among cryptos). Perfect time for entry imo!

AUPH LongWedge breakout, revisit trendline
ABC Patten:
Swing A crossed SMA50 (1st) and SMA200 (2nd), Wave#1
Swing B tested SMA200 as support. Wave#2
Swing C will be not less than A; Wave#3
Entry 16
Stop 14
Target 22
I am not a PRO trader. I trade option to test my trading plan with small cost.
The max Risk of each plan is less than 1% of my account.
If you like this idea, please use SIM/Demo account to try it.

AXS UPDATE TARGET 1 MET!ALICE UPDATE!
Cleaned up the chart.
Target 1 met, we have 2 more short/medium targets to hit.
Long term target $190, NFA.

TCP TARGET MET!TCP broke out of the wedge and hit my target of $0.3500.
7 DAY SPOT PROFIT OF 135%, NOT FINANCIAL ADVICE.

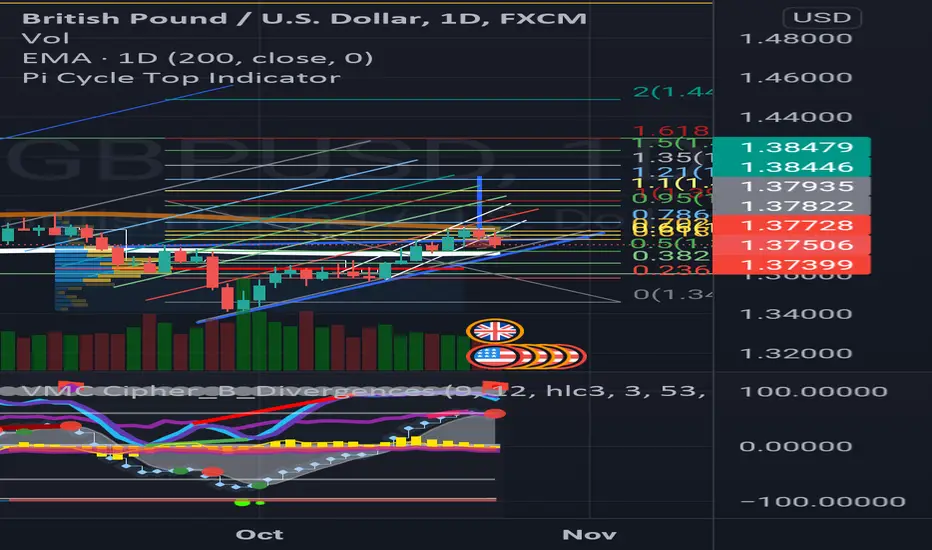
3000 PIPS POSSIBLE PROFITS ON THIS TRADEA break on the Wedge on GBPUSD daily timeframe could be a great opportunity to get upto 3000 pips
A sell order should be placed when price goes below the 0.5 fib level.
TP and SL should be decided based on the nature of the trader.
Remember to trade wisely😎
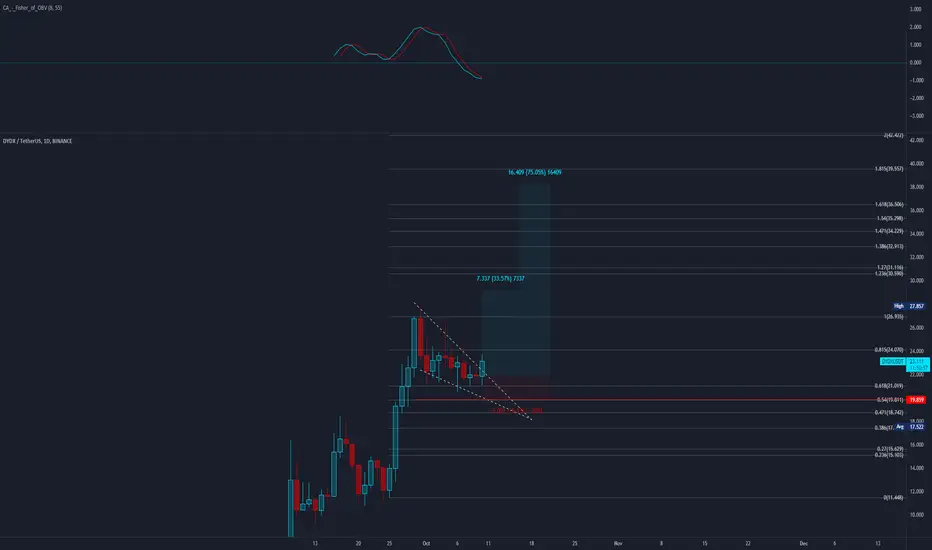
dYdX U.S. Dollars (T)After wicking itself a support, dYdX has coiled up and popped out of its descending wedge. I've taken the trade at $22.900, looking to take half profit after reaching $29.000 and the rest at $38.000.
Stop loss set at 19.900.
A retest would of been preferable but the wicked support gives me confidence in taking the trade.
Let me know your thoughts below.
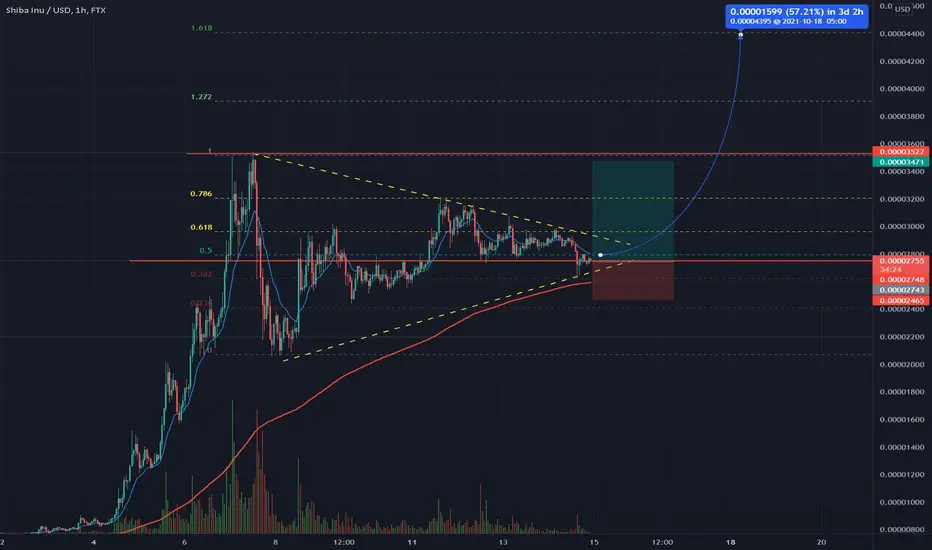
SHIBA pressure building into wedgeSHIBA INU, relatively new coin and "meme coin" has potential to break out of this wedge and range it has been stuck in for some time. With BTC and ETH starting to run, I think the altcoins and bigger named small cap coins will begin to run as well, from FOMO, meme potential, and just more and more people entering the crypto space.
I will be entering with a small position at this level, waiting for the break of the trendline and the 618 fib level.
Targets:
1) 0.000035, the previous high -> around 25%
2) the 1.272 fib around 0.000039 -> around 40%
3) 1.618 fib at 0.000044 -> around 55-60%
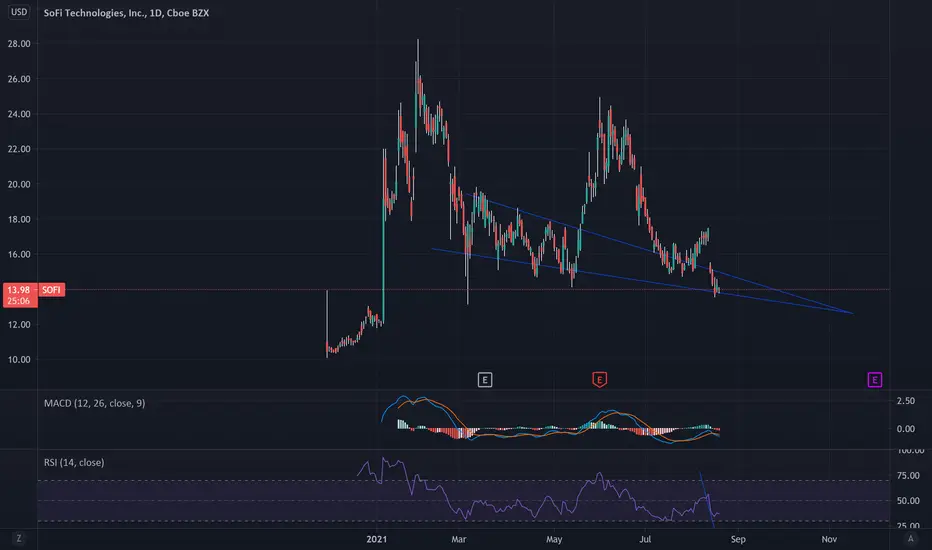
Wedge Breakout Setup for SOFISofi was on track to break ATHs but ran into some trouble at earnings (overreaction). The fundamentals are still solid and the bottom of the wedge is holding support. Last couple days the CEO bought $100K worth of Sofi ,institutional ownership has gone up, and last lockup period has expired this week.
Sofi is set up nicely to breakout and get back on track to hit it's 2021 PT of $30.
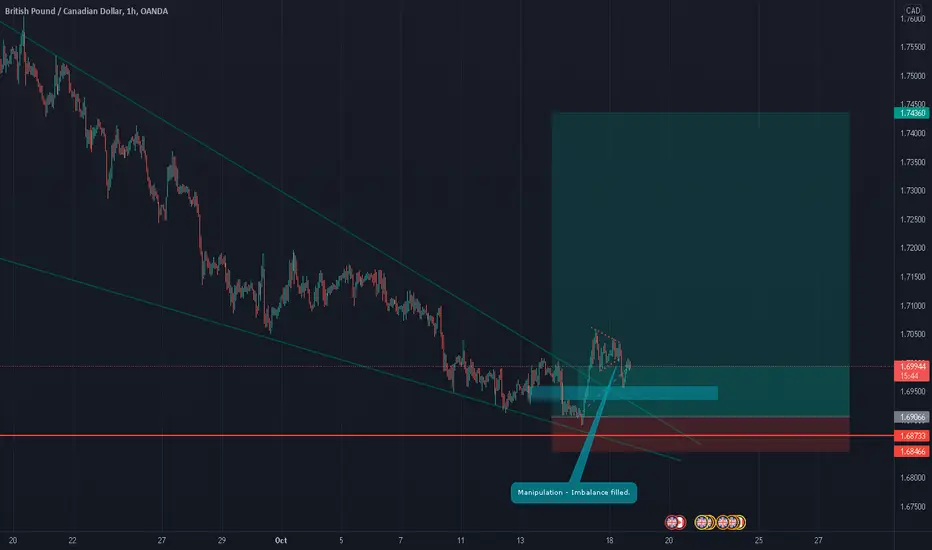
GBPCAD LONG POSITIONbreak out from wedge / ending diagonal pattern/ - break out and price manipulation - imbalance filled - targeting higher TF equal highs - potential 500pip move.
USDCNY Likely to Rebound From the 23.6% Fibonacci The price action of the USDCNY pair has been range-trading since the 16th of July, as underpinned by the ADX indicator. Bearish pressure has been slowly accumulating over the same period, which is illustrated by the current reading of the Stochastic RSI indicator.
The price action is likely to reach a new dip at the 23.6 per cent Fibonacci retracement level, which is the closest psychologically significant support level. A bullish rebound can be expected to occur there, given the current development of a Descending Wedge pattern. The latter represents a classic trend reversal pattern.
The first major target for the renewed uptrend would be the descending trend line (in red) just above the 38.2 per cent Fibonacci.

Bitcoin Rising Wedge Example-BTCRising Wedge, is a bearish pattern. i drew this simple wedge pattern last night before i went to bed. before it broke down/out.
(see linked chart below)

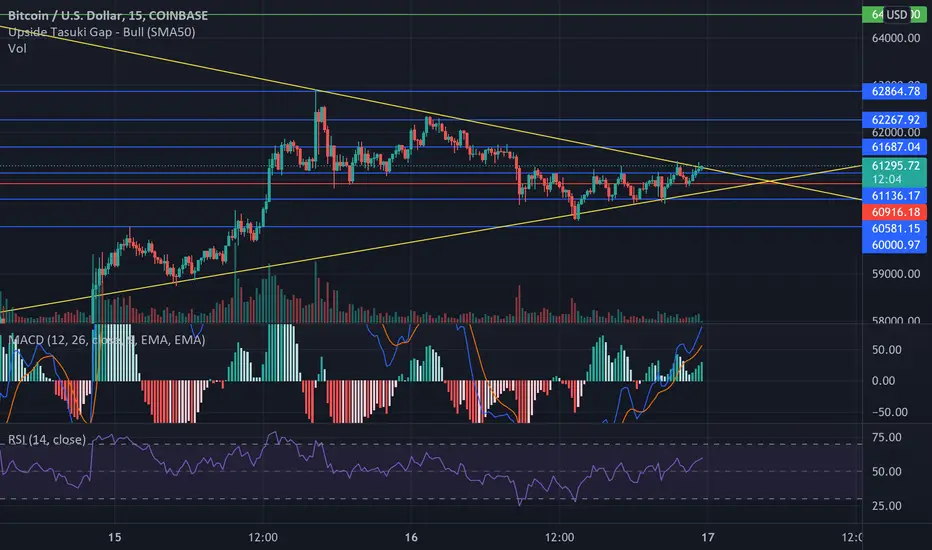
Bitcoin Breakout ImminentBlue Lines - Support / Resistance lines price action has bounced off of multiple times during the last bullion
Yellow lines - freehand lines trying to predict breakout to upside on Sunday or not
red line - purchase price
green line - breakeven from fees
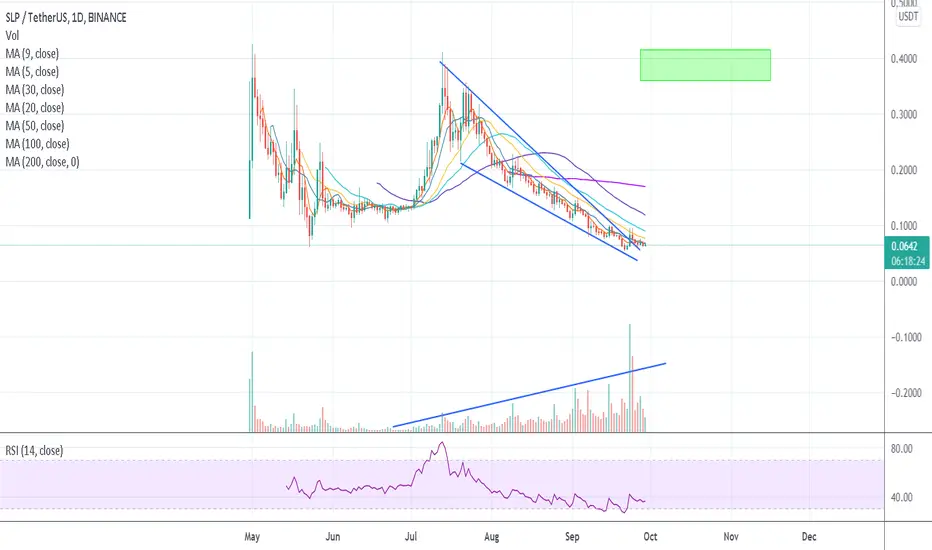
Smooth Love Potion (SLP), low is set and looking for +500%After its initial launch on Binance SLP has been regularly dropping for weeks.
- has reached oversold on several timeframes
- has reached new all time low
- just broke out from huge descending wedge with big volume
- Price and Volume are showing big bullish divergence
target of the next price action is top of descending wedge, more than x6 of current price. May take some weeks to be reached.
this post is for educational purposes and not trading advice. do your own research.
Potential Breakout Waiting for a bounce ot $25 and if that fails look for a bounce at $20.50 . Ultimately I'm waiting for a breakout from this wedge on the daily.

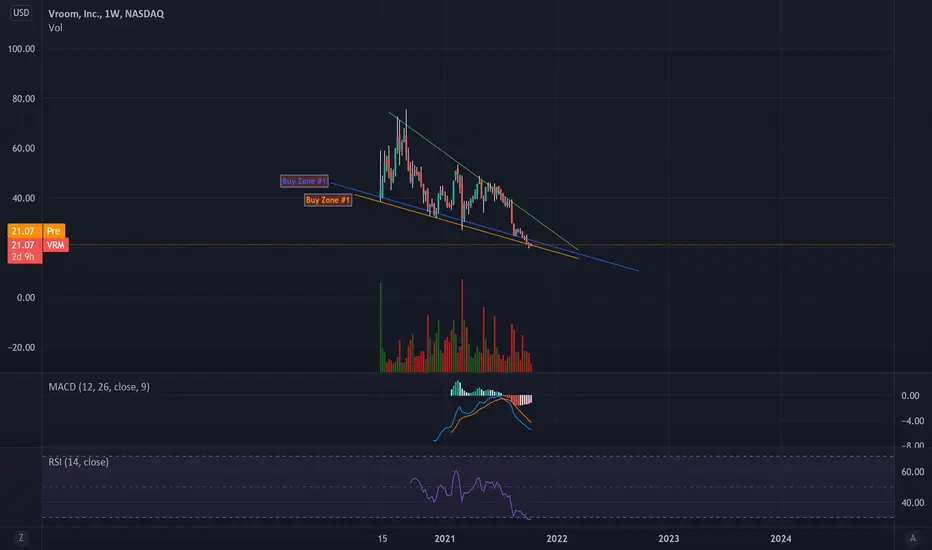
It's time to breakout!Looking to buy between zone #1 and #2. Oversold on all timeframes. Playing this position long from the weekly timeframe. Stops set at $18.
$APPS - Bullish Trade Set UpDespite the market being weak, $APPS is showing good relative strength. Definitely one to watch when the indices are green as it should really pop above $67.50! The whole $5B to $30B market range of companies is where I'll be looking for strength in the coming weeks.
Targets are in green, good luck & happy trading!
