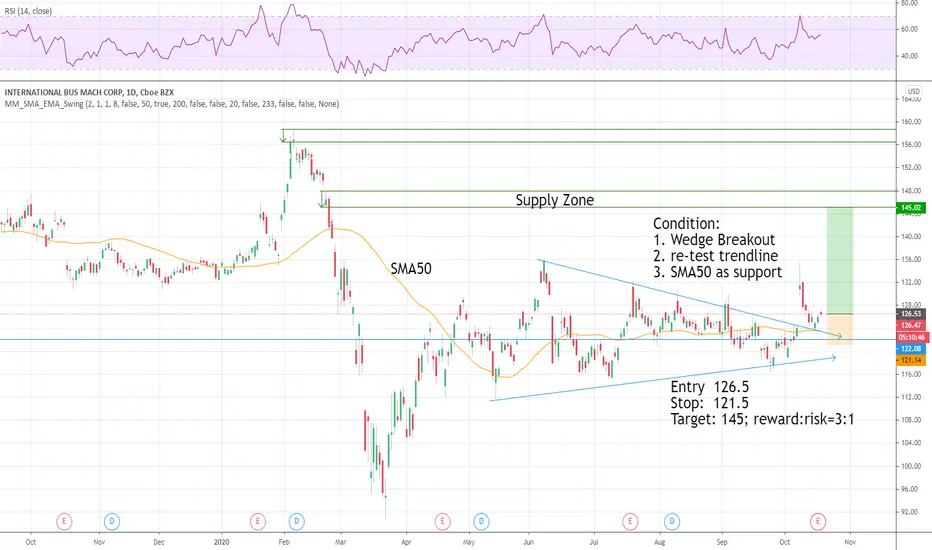
IBM to Long, Wedge BreakoutCondition:
1. Wedge Breakout
2. re-test trendline
3. SMA50 as support
Entry 126.5
Stop: 121.5
Target: 145; reward:risk=3:1
I am not a PRO trader. I need few months to practice trading strategies.
If you like this idea, please use SIM/Demo account to try it, until my trading plans get high winning rate.
Wedgebreakout
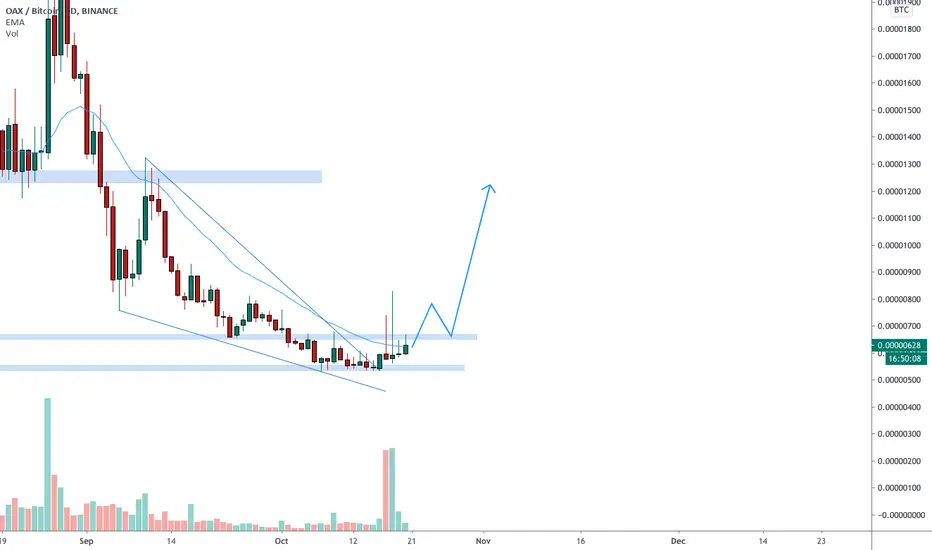
OAXBTC Nice breakout from the falling wedge 🦐OAXBTC Nice breakout from the falling wedge, and now the price is testing daily resistance.
IF the price will break the resistance and turns it into new support According to Plancton's strategy, we can set a nice order
–––––
Follow the Shrimp 🦐
Keep in mind.
🟣 Purple structure -> Monthly structure.
🔴 Red structure -> Weekly structure.
🔵 Blue structure -> Daily structure.
🟡 Yellow structure -> 4h structure.
⚫️ Black structure -> <4h structure.
Here is the Plancton0618 technical analysis, please comment below if you have any question.
The ENTRY in the market will be taken only if the condition of the Plancton0618 strategy will trigger.
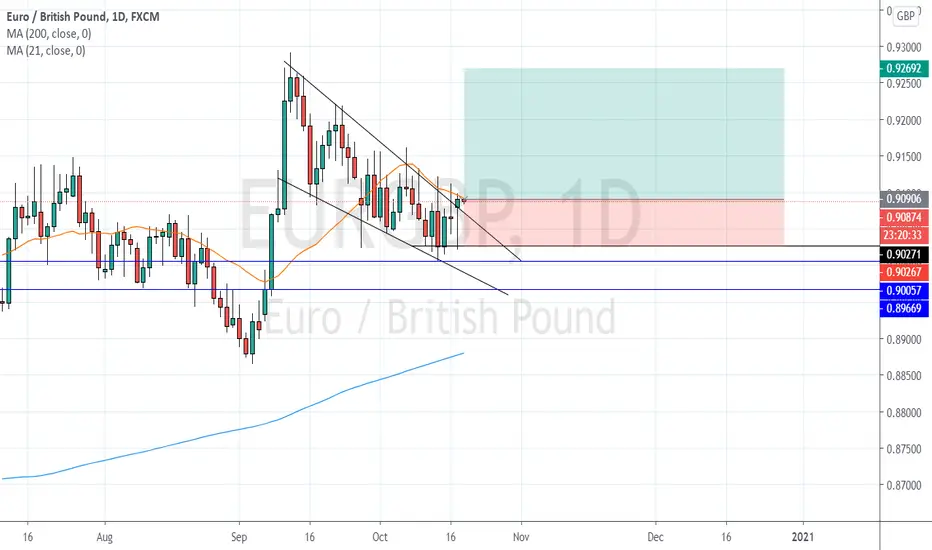
EURGBP Long PositionDownward wedge indicating the slow down of the bearish trend towards a monthly level. Price has broken out of the wedge pattern with a pin bar with a wick that is 3x larger than the candlestick body.
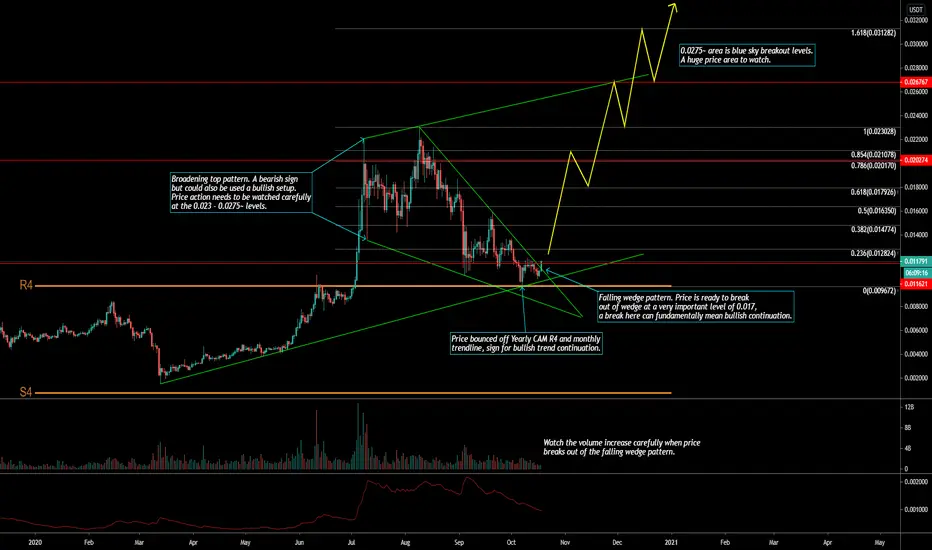
VET/USDT - A very BULLISH long term outlook on Vechain.After some previous ideas of trying to find the bottom with Vechain, I've decided to wait until a better set up arrives. Now that we've been waiting for some time now, we now have a lot of different patterns that could potentially give us a Blue Sky Breakout , one of the most fun breakout patterns in a ticker.
Some of the patterns are a broadening top pattern, something that is similar to the SPX, this could either mean life or death for a ticker but in this case we have a bullish Falling Wedge pattern that gives us confluence that this broadening top pattern could be used as a bullish setup. This will mean that we need to watch resistance breakouts at 0.023 to 0.0267 levels to confirm this case. Another bullish confluence is the nice bounce off the monthly trendline and CAM R4, a bounce off CAM R4 is a big telltale sign of bullish continuation which adds on to the breakout of the falling wedge pattern.
If these bullish patterns are confirmed then we'll be able to see a fun ride above the blue sky breakout levels. I will also keep an eye on other VET pairs, more importantly VETBTC and VETETH.
Leave a like/comment if this idea helped you at all!
I am not a financial advisor, trade at your own risk.
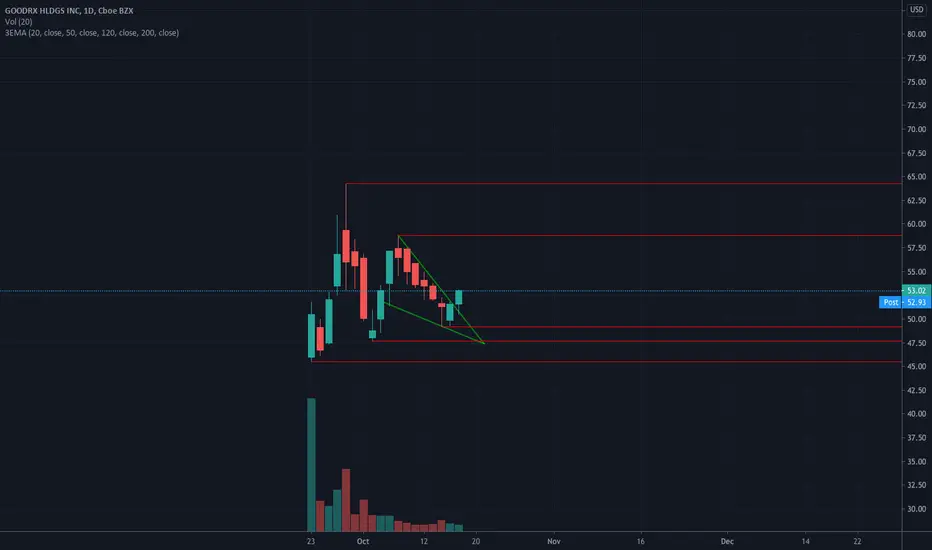
Unheard gross margins of 95% and a $800B TAM : $GDRXGoodRx is a free-to-use service that allows Americans to find the lowest-cost prescription drugs in their area. The company makes money by receiving a commission for every prescription order filled via its coupons, which are accepted by nearly all 70,000 pharmacies across the country.
-Most Downloaded medical app in US with 4.8/5 rating(700,000+ reviews)
-Partnership with Kroger
-Competing with TDOC with the launch of HeyDoctor
- Rising prices of pharmaceuticals and their mission is to lower the cost of healthcare
-95% Gross margin (What?!?!). 30% Operating margin.
- $75M Free cash flow.
- TAM $800 Mn
- NPS 86
- 4.6/5 Glassdoor
- Founder led
Concerns,
1. P/S of 37.1 and 201 PE. Average PE in healthcare is 24.
2. IPO hype(good for trades though)
3. 94% of top line revenue still coming in from prescription stream(concentration risk?) which grew 42% Q1.
4. Regulations
5. International expansion?
6. 4 holders own 60-65% of the company(Both good and bad)
TA,
1. Wedge breakout
2. Potential base of Cup.
3. Low volume on Pullback
Not a long term position yet. Swing trade.
Entry : break of 52
Stop loss : 49 (-7.8%)
CALX - gorgeous engulfing candleCALX made a strong reversal, green candle on a red day.
Nice bullish wedge from mid july
Expectiing continuation coming closer to the next earnings.

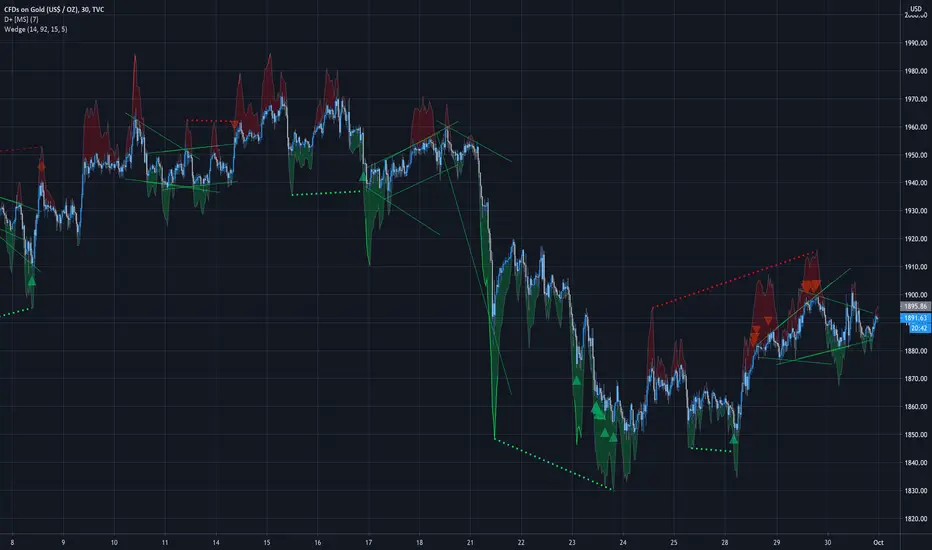
Small gold breakout incoming?Gold price action is starting to converge into a wedge/triangle (Wedges script). I'd be looking for a breakout to either the upside or the downside.
Previous sell signals (D+ script) have faded...turning into a plateau instead of a drop. (This happens often.)
No strong buy signal either, so we'll have to look for confirmation with another tool.
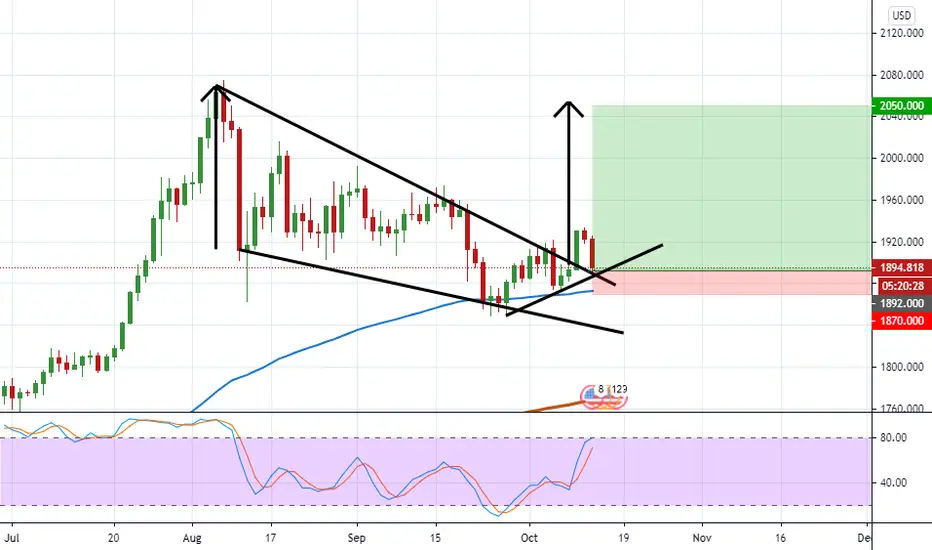
XAUUSD, daily tf, buy on falling wedge breakoutHello my friends,
It has been long since my last position in XAUUSD. Today i finally find a good setup to trade for XAUUSD.
If you look at XAUUSD daily tf using line chart, it is very clear that they are making a falling wedge pattern. Price keep moving south but it was getting squeezed in the last 2months. Price finally get out of this wedge pattern and break to the upside at 9th October 2020 and keep moving north for 300 pips.
Today we finally see price retrace to retest this broken trend line which is now a support.
This is going to take some time to materialize as we are using daily timeframe so we just gonna do it patiently. Also if you're a fan of elliott wave, you could notice that this is going to be the 5th wave for XAUUSD to the upside.
I am buying XAUUSD to aim the upwards movement towards 2050 because this is the target of this falling wedge pattern.
Buy XAUUSD 1892
Stop loss 1870
Take profit 1 at 1984
Take profit 2 at 2050
RR ratio is 1 : 7.2
Use only 1-2% risk
Good luck
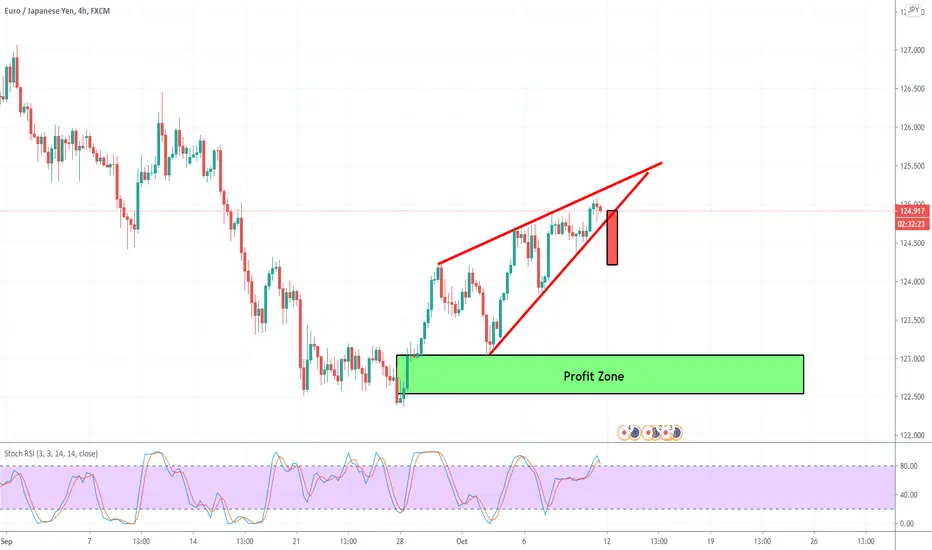
EURJPY Rising Wedge - Watch for south breakoutEURJPY is in a rising wedge, wedge pattern typically have a fast movement after a break south. Track this carefully next week. Once we have a break below the wedge I am expecting this to move towards Demand Zone (Profit Zone)
Happy Friday all, take time to rest up. See you all at next market open!
Let me know if there are any questions.
Charles V
CVFX Management
Trading made Simple
ISRG- Leader in medical/surgical roboticsISRG has roughly 80% of market share in RAS systems.
Surgical robotics is a lucrative industry and will only become bigger as 5G and AI technology mature.

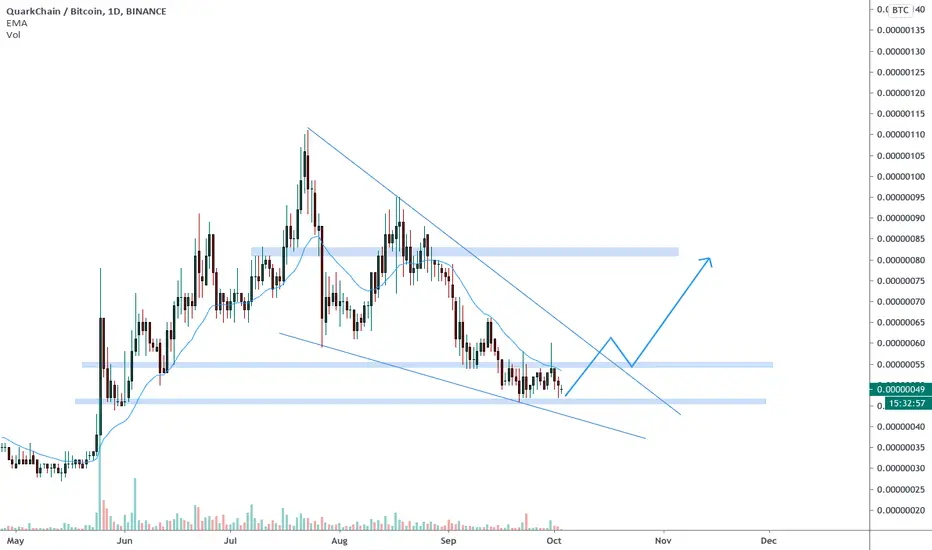
QKCBTC is inside a huge descending wedge 🦐QKCBTC is inside a huge descending wedge and the price created a double bottom on daily support.
IF and only IF the price gains bullish momentum and will break recent daily resistance and the wedge, According to Plancton's strategy, we can set a nice order
–––––
Follow the Shrimp 🦐
Keep in mind.
🟣 Purple structure -> Monthly structure.
🔴 Red structure -> Weekly structure.
🔵 Blue structure -> Daily structure.
🟡 Yellow structure -> 4h structure.
⚫️ Black structure -> >4h structure.
Here is the Plancton0618 technical analysis, please comment below if you have any question.
The ENTRY in the market will be taken only if the condition of the Plancton0618 strategy will trigger.
$AAPL Poised or Secondary Break $AAPL had a great pullback, and although sellers are still holding it down here, if buyers can manage to pressure the move up through the sellers resistance, they have a shot at taking this much higher.

NEC - Long term breakoutLooking good, waiting for a successful retest of the breakout area before entering a long

CLSK +18% Wedge Breakout Swing Opportunity on Daily ChartCLSK swing trade setting up. First target just below $15. Over $15 room to ~$17.50-18 on daily chart. Wait for break of $12.50 with high relative volume to trigger entry.

UAL - After Bullish Engulfing close to breakout from wedgeNASDAQ:UAL
After Bullish Engulfing + hammer candle
rsi 14 have a support line in 40 level
volume is bullish

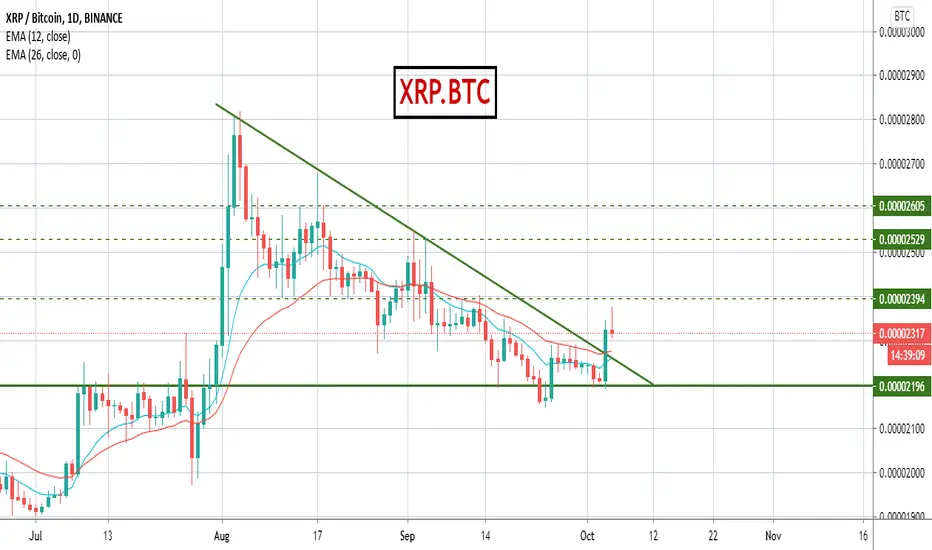
XRP Wedge breakout XRP breaks the falling wedge. Buy it on pull back to the trend line. Targets mentioned on the chart.
Microsoft to move downwards Bad news today will finally be the catalist for the break of the rising wedge
Opened short at 211. 93
Stop loss 214. 82

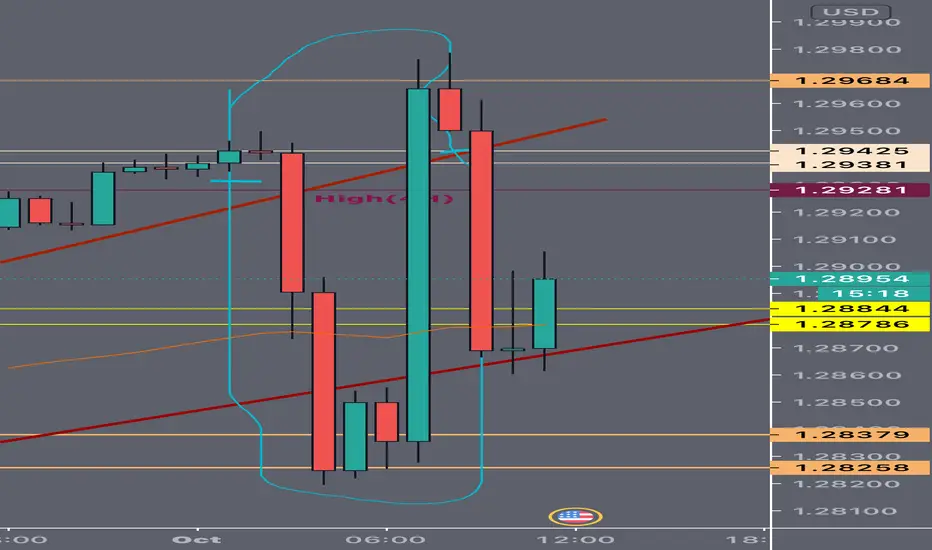
Breaking Trends!I laid down at 1:30 this morning at the underlined point. When I woke up at 6 the bigger circle had already took place.. many people in class missed and some got a little piece of it.
I'm glad I missed it, I seen the drop coming so basically most classmates broke even if they got in during this entire mess of 5 hours.. the waters are settling back down for now.
I predict price to rise up the lower trend line and fall thru floor again if not today then Friday(10/2) before noon.
What are your predictions?
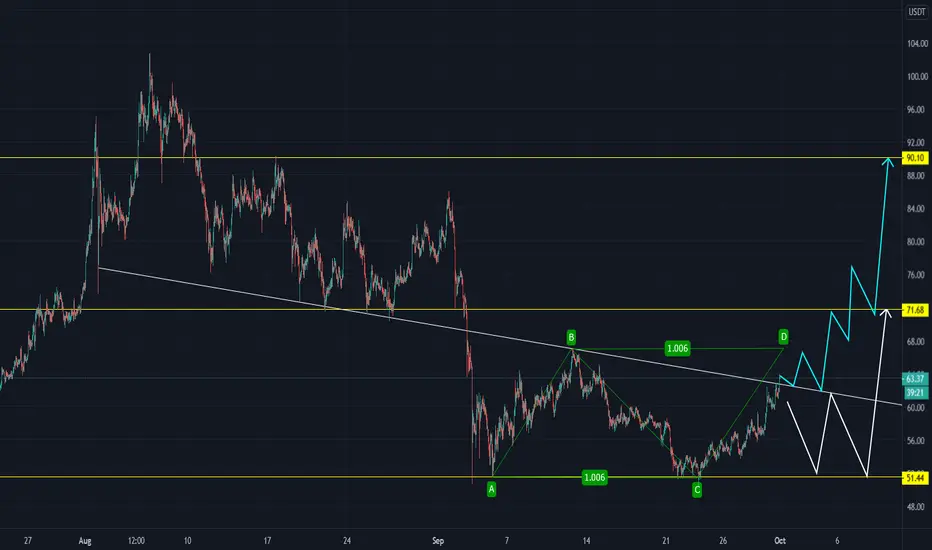
ZEC trade setupZEC Halving coming in 47 days. Privacy coins narrative is coming back this quarter with people wanting their security back.
1. I will wait for more candles to see if $ZEC has really broken out of the resistance or whether it falls back into the wedge
2. $ZEC is forming a bullish flag with AB=CD and possibly it could stay above the resistance line for longer and converting the resistance into a support line.
3. Weekly Chart for $ZEC is very bullish - so it looks like its up for a 2x moonshot on weekly chart.
$JD Wedge Breakout Pull Back For Long Buyers$JD is forming a gorgeous wedge and is now attempting to pressure the top end (for the second time). If buyers can manage the run above wedge highs with conviction, there isn't much stopping the buyers from wanting a pullback to push higher again.

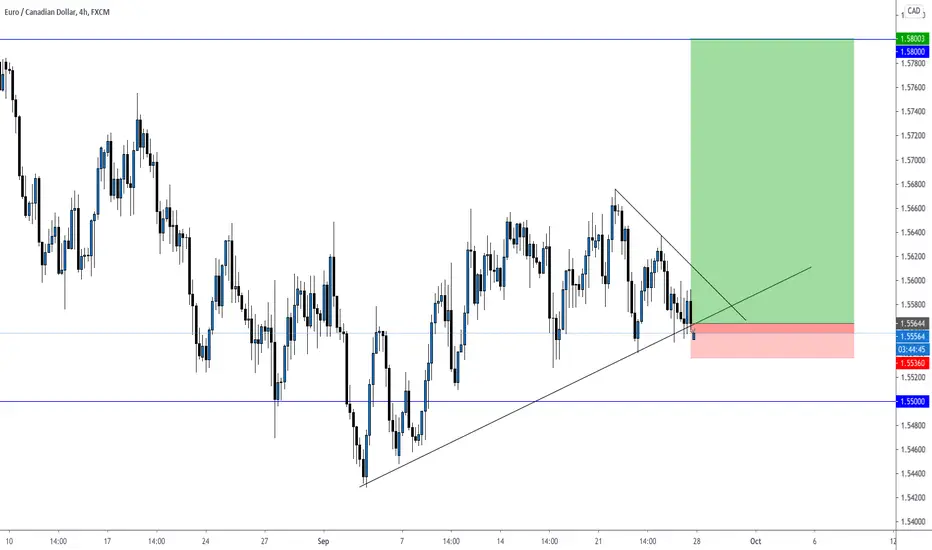
EURCAD - LongSo after seeing this trendline being respected, I am now looking to take longs on Monday as my risk trade.
Looking to play this to the upside, before the overall push back down the downside, but I think this hedge long will be really nice. Even waiting for a counter trendline breakout could be worth staying patient on.
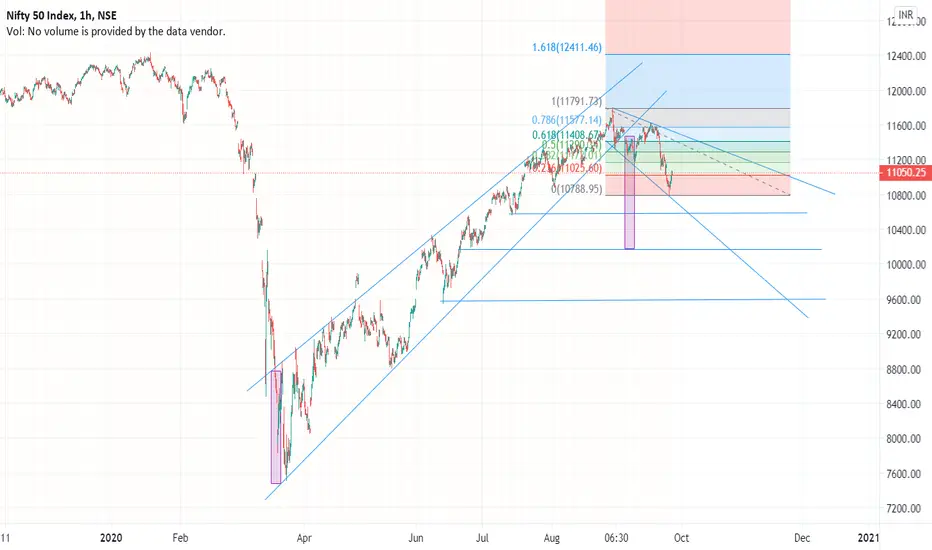
NIFTY 50Case:1 - If CMP hits the level of 11170, then uptrend starts, buy and put the target level of 11300 to 11400
Case:2 - If CMP hits the level of 11170, then downtrend starts, sell and put the target level of 11025 to 10777
SPX500 Battle for control ongoingA bit of wedge porn today.
One of my favorite setups are these nested wedges but while these are bullish, right now we are sitting at a key support level at 3,230 after 3 weeks of sell-off so there could be some bearish momentum here. The smaller wedge is still forming so we shall see how this pattern ends up.
A daily close below 3,230 is certainly bearish while a break out above these wedges would be otherwise. I have made my personal bet but declaring neutrality for now until we see a confirmed breakout in either direction.
