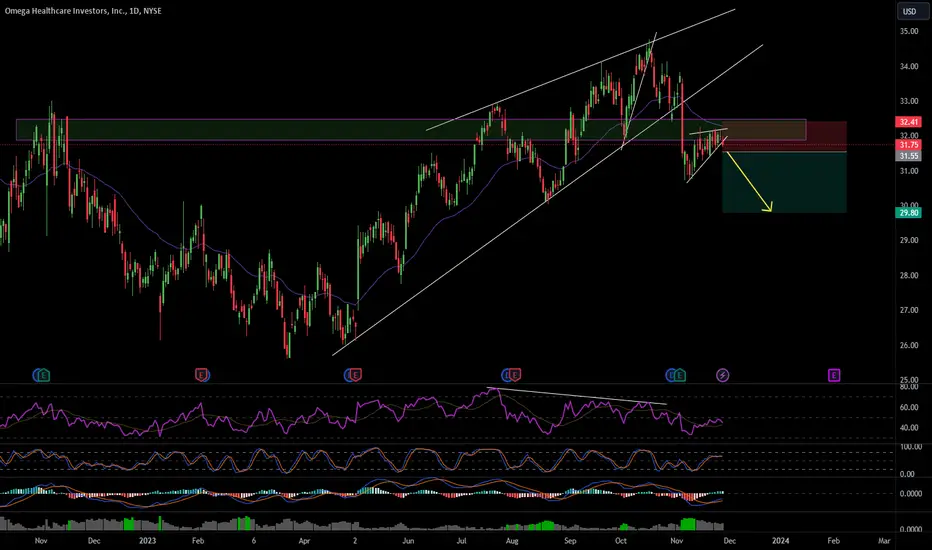
Potential Short on OHI
OHI has broken out of an ascending wedge with bearish RSI divergence now retesting support. Look for a break of trend on smaller timeframe for entry, SL above last swing high moving SL to BE when safe to do so.
Wedgebreakout
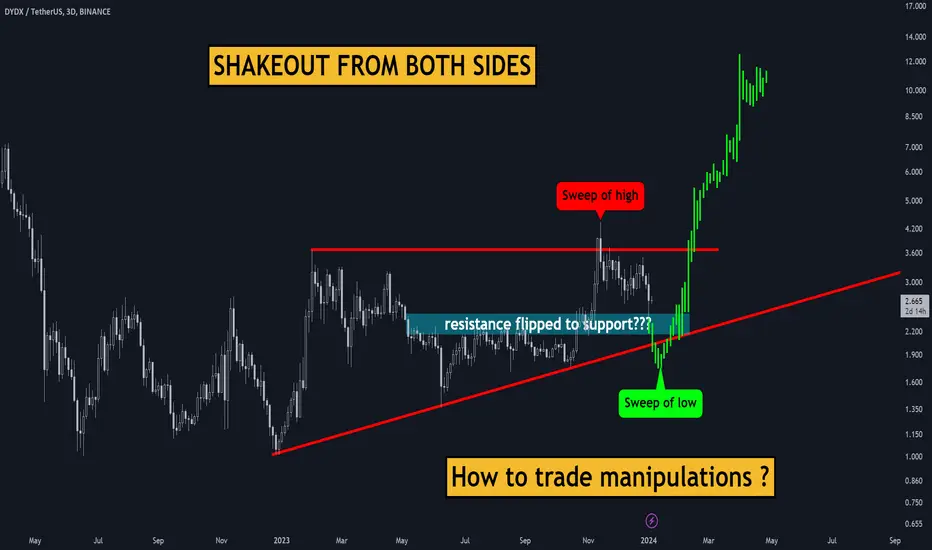
📉 DYDX: Awaiting Shakeout for Further Ascent 🚀DYDX is currently navigating a substantial ascending wedge pattern, having recently experienced a swift breach of the upper boundary that prompted a notable short-term reaction. The current phase involves a retest of the previously contested resistance, which has now transformed into a support zone. A potential shakeout beneath the lower wedge boundary is anticipated to capture liquidity before embarking on the next leg of the upward movement.
📊 Key Observations:
📈 Ascending Wedge Dynamics:
DYDX is ensconced within a large ascending wedge, presenting a structure that often precedes decisive market movements.
🔄 Retesting Transformed Support:
The ongoing phase involves a retest of the support zone, formerly a resistance level breached during the recent upswing.
📈 Technical Analysis:
🔄 Shakeout Anticipation:
Anticipation of a shakeout beneath the lower boundary of the wedge, designed to capture liquidity and set the stage for the next bullish phase.
🚀 Expected Shakeout Strategy:
🔍 Liquidity Capture:
The shakeout aims to secure liquidity from both sides of the market, setting the groundwork for a robust and sustained upward movement.
📊 Strategic Considerations:
🧐 Vigilance during Shakeout:
Traders are advised to remain vigilant during the anticipated shakeout, recognizing it as a strategic maneuver to capture liquidity before a potential surge.
📝 Conclusion:
DYDX's current chart setup, characterized by an ascending wedge and a transformed support/resistance zone, points to a calculated shakeout as part of a broader market strategy. Traders should monitor this phase closely, recognizing its role in securing liquidity for the ensuing bullish momentum.
🚀 Unlock my 3 crypto trading indicators for FREE! 🚀
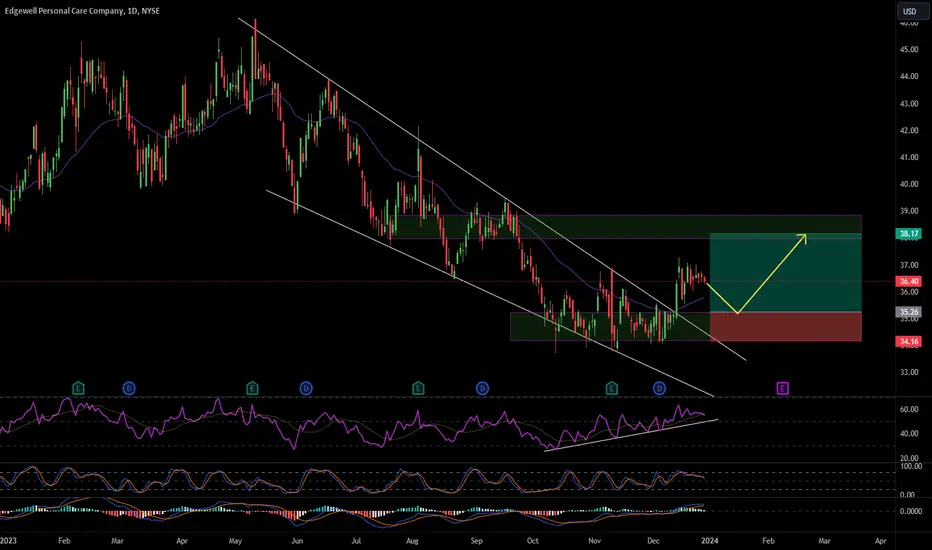
Long on EPC
EPC has broken out of a descending wedge with bullish RSI divergence just looking for a retest of support and bounce for an entry.
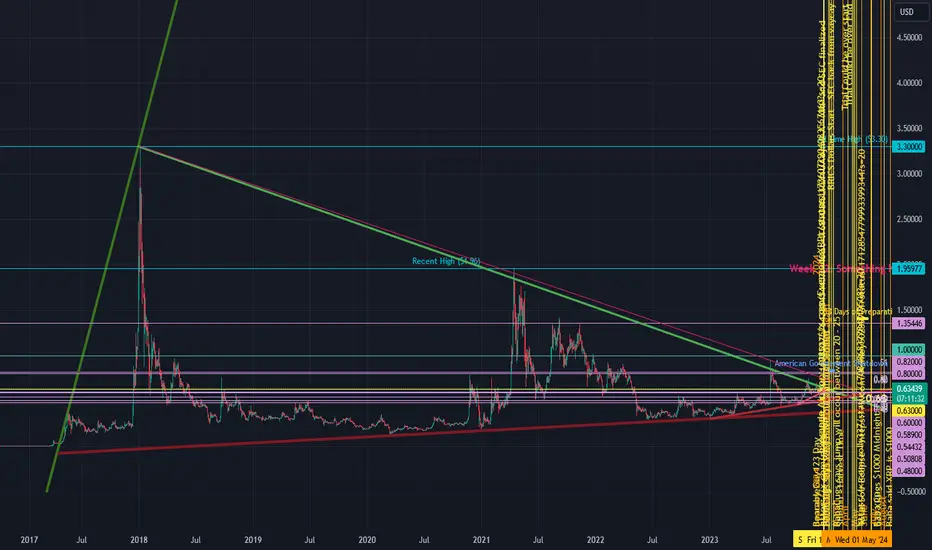
XRPUSD Giant WedgeXRP appears to be in a giant wedge pattern.
This is from prolonged selling pressure due to the SEC suing Ripple the company that builds software that uses the XRP cryptocurrency.
This chart shows the wedge and the upside to $33 based on earlier performance.
This chart also tracks upcoming dates of interst for XRP.
UNI TARGETING FOR $18Embark on an insightful exploration of UNI's recent market maneuvers, dissecting its tactical prowess and decoding the signals that underpin its bullish trajectory. Let's delve into the specifics of UNI's recent actions and what it means for traders.
Strategic Retests: A Show of Resilience:
Zone of Resilience:
UNI has strategically revisited the lower boundaries of its support zone on multiple occasions.
These calculated retests highlight the coin's robust bullish sentiment and its ability to withstand market pressures.
Breaking the Chains: Triumph Over the Downtrend:
Monumental Breakthrough:
UNI emerges victorious by decisively breaking a significant downtrend line.
This breakout marks a substantial shift in the market dynamics, affirming UNI's newfound strength.
Deciphering Manipulation Tactics:
Crafted Maneuvers: Range Breach and Imbalance Retest:
What initially seemed like market manipulation beneath the range level unfolds as a well-thought-out strategic move.
A subsequent retest of the imbalance zone serves to solidify UNI's commitment to overcoming resistance.
Setting the Target at $18:
Navigating the Path to $18:
UNI's strategic maneuvers position the coin for a steady ascent, with a specific target set at $18.
The trajectory reveals a bullish narrative, drawing attention from traders keen on capitalizing on potential opportunities.
Insights for Strategic Navigation:
UNI's recent market actions, characterized by methodical retests and breakthroughs, project a bullish sentiment. As traders navigate this landscape, keeping a watchful eye on potential entry points and understanding the implications of UNI's strategy is crucial.
❗️Unlock my 3 crypto trading indicators for FREE! Link below 🔑

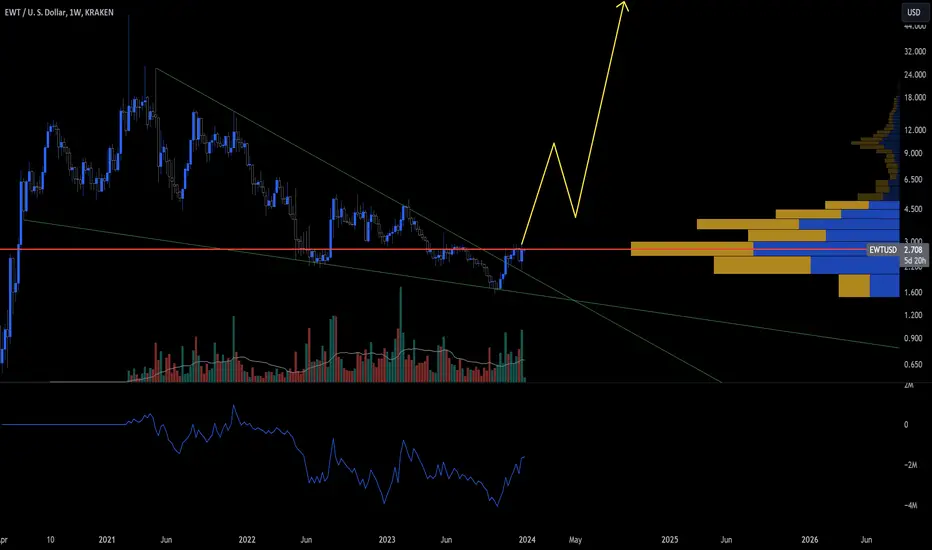
EWT - Wyckoff Accumulation + Volume #EWT
This beautiful falling wedge or #bullflag has all the mechanics of a #Wyckoff Accumulation Schematic built into it, which can be seen by #volume tells in all the right places.
After The low was breached note the negligible #volume, then observe the volume on the first solid bullish candle to break through the #wedge. What we want to see after is the follow-through retrace candles reaction, and not just the #volume, but the fact it snatched the stops on the candle a month before it.
Pair that all with my favorite leading indicator, #OBV, which has already breached the last swing.
I like this PA...
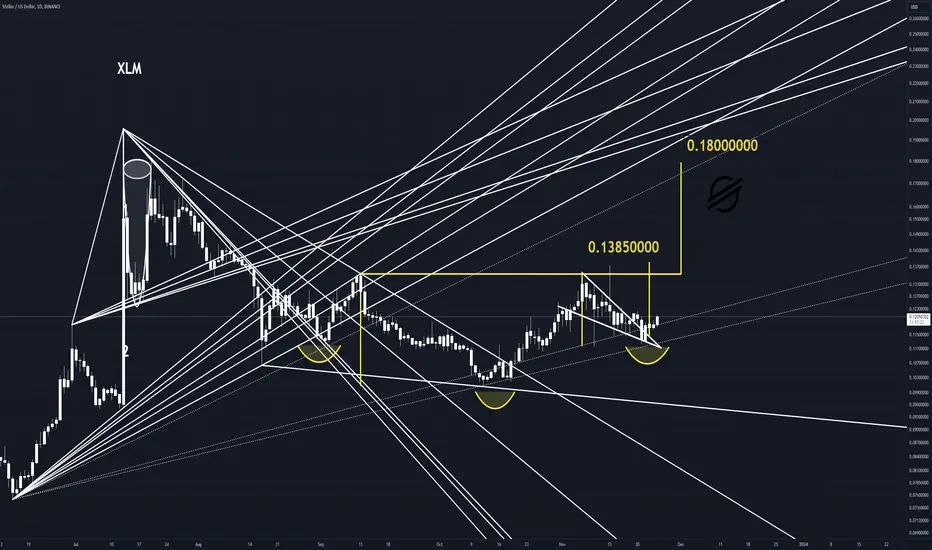
XLM to Move Above .20Stellar Move Incoming!
Look For a Wedge Breakout ot start this move.
and
An Invere Shoulder Head Shoulder patter could extend back to the summer high.
$JD Potential Reversal: 2-Day DB, Descending Broadening WedgeOverview:
JD
(JD.com Inc.) appears to be forming a compelling technical pattern that suggests a potential reversal. The stock has developed a 2-day double bottom pattern, coinciding with a falling wedge setup, all occurring within the confines of a major descending broadening formation. Traders and investors should closely monitor these key technical levels for potential bullish momentum.
Key Technical Observations:
Double Bottom Pattern:
JD
has established a clear double bottom pattern over the past two days, a classic reversal formation characterized by two distinct lows at approximately the same price level.
The first low was set , followed by a second low , forming a W-shaped pattern.
Falling Wedge Formation:
A falling wedge is currently in play, with converging trendlines forming lower highs and lower lows.
Falling wedges are often indicative of slowing bearish momentum, and a breakout to the upside could signal a reversal.
Descending Broadening Formation:
The overall context involves a major descending broadening formation, marked by expanding price volatility within a downward trend.
This formation could imply a period of uncertainty and potential for a reversal as the pattern reaches its apex.
Potential Trading Strategies:
Entry Points:
Conservative traders may consider entering long positions upon a confirmed breakout above the upper trendline of the falling wedge.
Aggressive traders might explore entry opportunities near the lower trendline, anticipating a bounce within the descending broadening formation.
Stop-Loss and Take-Profit Levels:
Establish a stop-loss level below the recent double bottom, ensuring protection against a potential breakdown.
Identify potential resistance levels within the descending broadening formation as initial take-profit targets.
Confirmation Signals:
Confirm the bullish reversal with increased volume on the breakout from the falling wedge.
Use additional technical indicators, such as RSI and MACD, to validate the strength of the potential reversal.
Risk Considerations:
Trading involves inherent risks, and it's essential to manage risk effectively. Be cautious of false breakouts and monitor market developments closely.
Disclaimer:
This analysis is for informational purposes only and should not be considered as financial advice. Always conduct thorough research and consult with a qualified financial professional before making trading decisions.

CRO: Tightening Below Key Resistance (BULLISH)🚀📉Today, let's explore the exciting developments on the CRO chart, where a recent breakout from a falling wedge pattern has set the stage for potential upward momentum. The coin is now consolidating beneath a critical resistance level, teasing the possibility of a decisive breakthrough. Here's a closer look at the current scenario and what to anticipate next. 📊🚀
Analyzing CRO Chart: From Falling Wedge Breakout to Key Resistance Battle
Falling Wedge Breakout:
Pattern Formation: CRO recently experienced a breakout from a falling wedge pattern, a bullish sign that often precedes upward movements.
Momentum Shift: The breakout signaled a shift in market sentiment, hinting at potential bullish momentum.
Consolidation Beneath Key Resistance:
Critical Level: CRO is currently consolidating beneath a key resistance level, a crucial zone that traders are closely monitoring.
Accumulation Phase: The consolidation suggests an accumulation phase as the coin prepares for a significant price move.
Gearing Up for the Challenge:
Potential Breakthrough: Traders and investors are eyeing the possibility of CRO challenging and breaking through the highlighted resistance.
Volume Analysis: Confirming the breakout with a surge in trading volume would add weight to the bullish case.
Trading Strategy Considerations:
Confirmation Signals:
Wait for Confirmation: Prudent traders may consider entering positions after a confirmed breakout and retest of the resistance turned support.
Volume Validation: Verify the move with robust volume, indicating substantial market participation.
Risk Management:
Stop-Loss Placement: Implement effective risk management strategies, including well-placed stop-loss orders, to protect positions.
Monitoring Key Levels: Keep a close eye on key support and resistance levels for potential trend reversals.
Price Outlook:
Optimistic Scenario: A successful breakout could pave the way for a sustained upward trend, with potential price targets in focus.
Conclusion:
CRO's journey from a falling wedge breakout to the current consolidation beneath key resistance presents an intriguing narrative. Traders should exercise patience, await confirmation signals, and stay vigilant as the coin gears up for a potential breakthrough.
❗️Get my 3 crypto trading indicators for FREE! Link below🔑

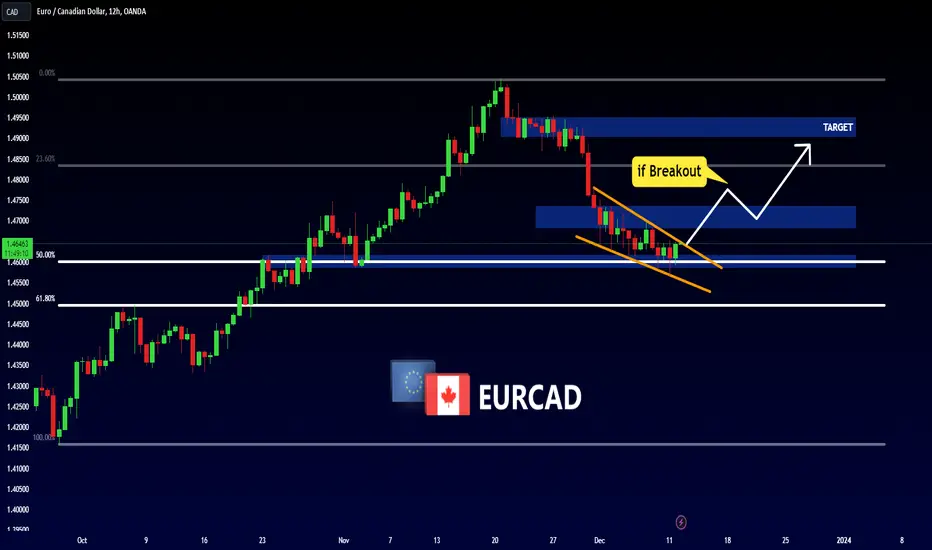
EURCAD - BULLISH SCENARIO 📈Hello Traders !
Yesterday, The EURCAD Price Reached a 0.5 Fibonacci Retracement Level.
Currently, The Price Formed a Falling Wedge Pattern.
So Let's Expect The Bullish Scenario:
If The Market Breaks The Resistance Line and Closes Above That,
We Will See a huge Bullish Move...
TARGET: 1.49050🎯
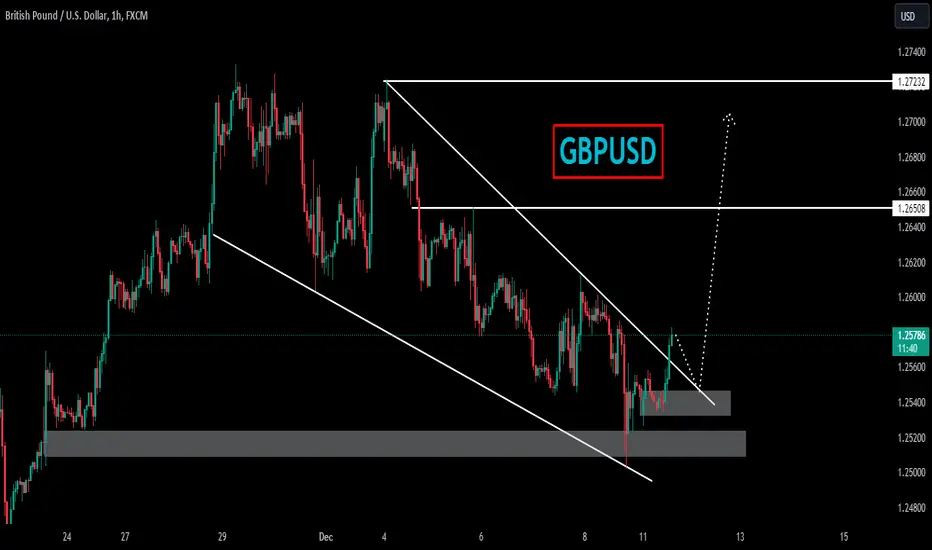
GBPUSDGBPUSD was trading in falling wedge. The price was reacting well the support and resistance of wedge and now has given the very healthy breakout ..
Currently the price has given the breakout of falling wedge and now retesting the broken level where it is also forming a local support zone and seems like the price may go for another leg higher.
If the breakout sustain to upside the optimum target could be 1.2650 followed by 1.2750.
What you guys think of this idea?
Potential Long on AG
AG is currently in a descending wedge with bullish RSI divergence. Wait for a break of upper trendline for entry, stoploss below last swing low. Will be moving SL to BE when safe to do so.

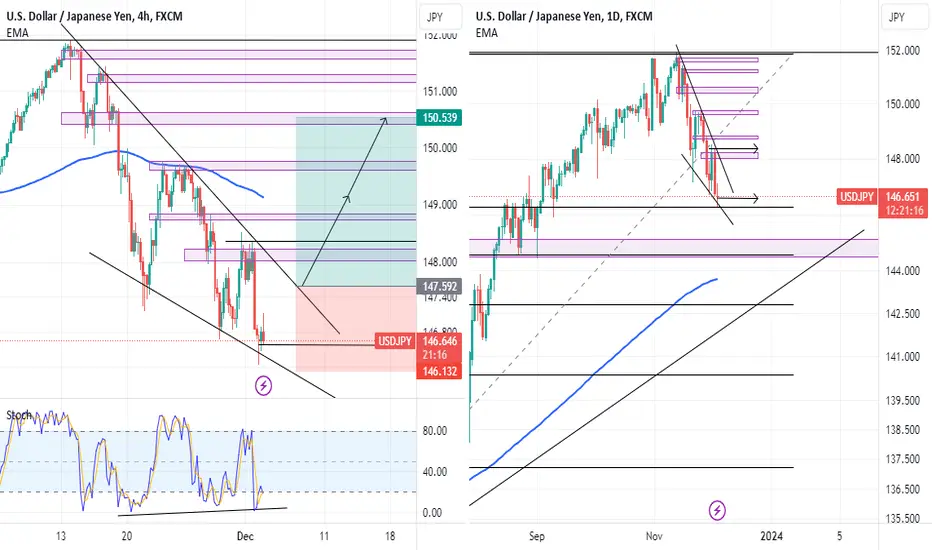
USDJPY potential bullish patternAs can be seen in the chart, there is a falling wedge pattern in the chart, which is a naturally a reversal chart pattern and is regarded as an intrinsically bullish formation. This chart pattern is occurring at the important Fibonacci level of 38.2%, and the fact that we have bullish divergence between price and the stochastic oscillator in 4-hour timeframe adds to the possibility of this chart pattern working.
Entries may be initiated at the bullish breakout of the wedge pattern, and based on a one-to-one minimum price target strategy, we can anticipate the price to reach its previous daily high.
Also it should be noted that in case of bearish breakout of the chart pattern this trade idea has failed alongside the chart pattern.
If you've found this analysis helpful, please take a moment to like, comment, or share your thoughts with me.
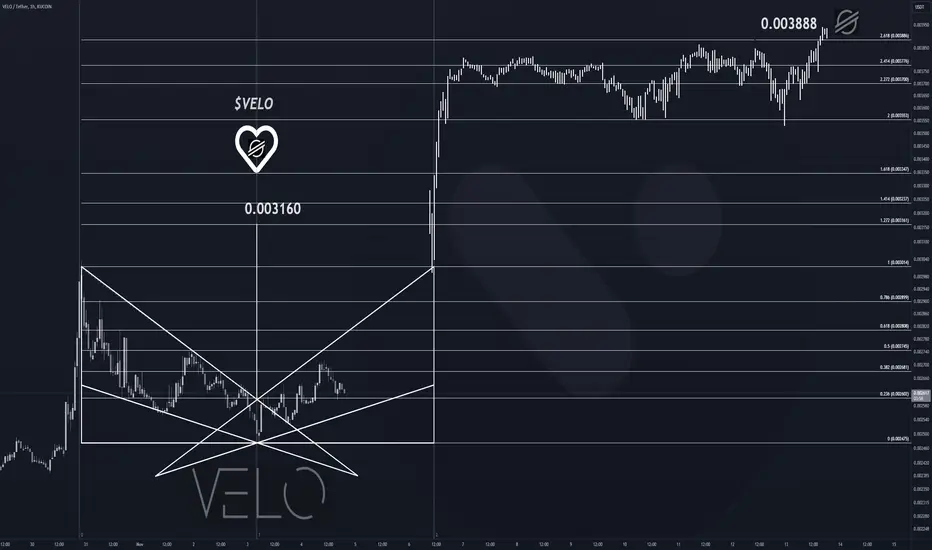
$VELO to $0.003888$VELO will Reach to Find Footing ANew Heights!
$VELO to $0.003888
GoGo $VELO
#VELOCITY
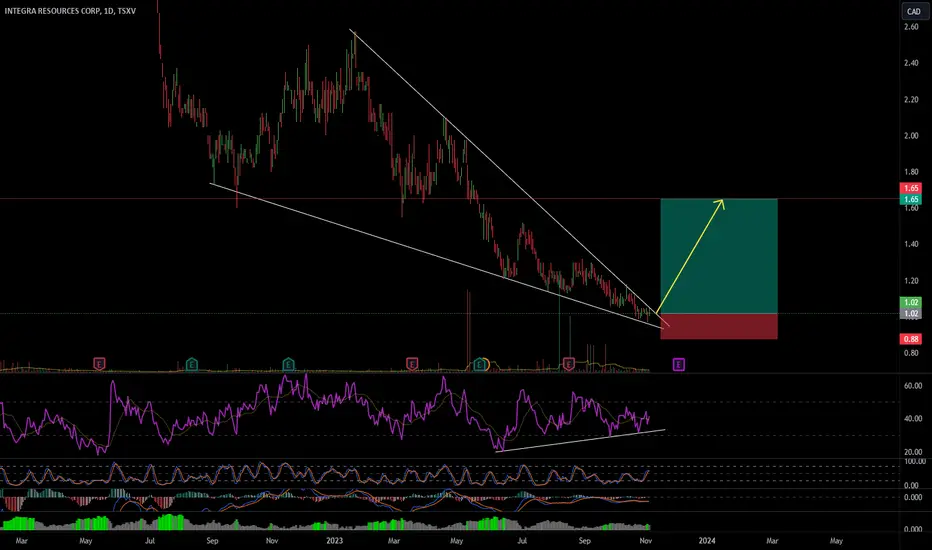
Potential Long on ITR
ITR is currently in a descending wedge with bullish RSI divergence. Wait for a break of upper trendline for entry, stoploss below last swing low and will be moving SL to BE when safe to do so.
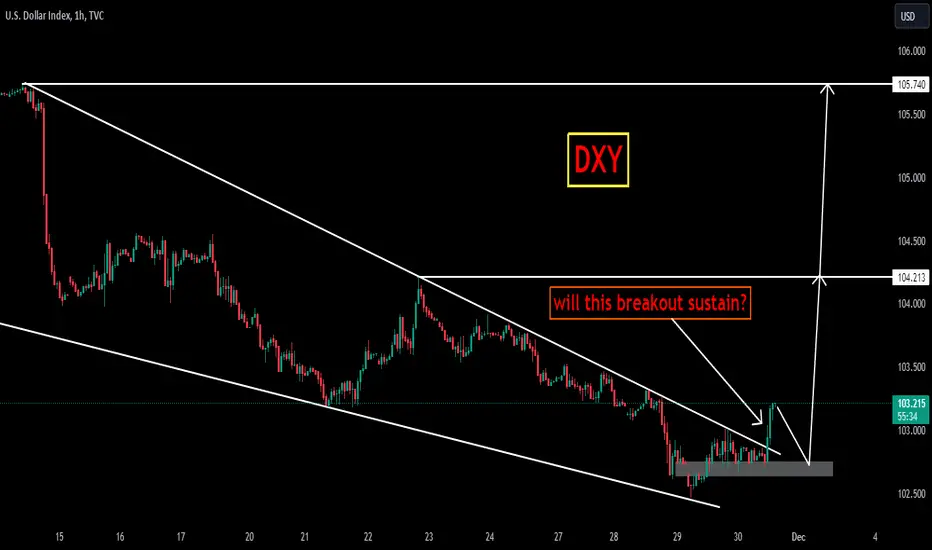
DXYDXY was trading in falling wedge. The price was reacting well the support and resistance of wedge and now has given the very healthy breakout ..
Currently the price has given the breakout of triangle and now retesting the broken level where it is also forming a local support zone and seems like the price may go for another leg higher.
If the breakout sustain to upside the optimum target could be 104.2 followed by 105.7 .
What you guys think of this idea?
Long on FPH
FPH has broken out of a descending wedge with bullish RSI divergence and has now had a retest at support and bounce. Enter a position, stoploss at last swing low with target of $22.69 or when starting to look weak and will be moving SL to BE when safe to do so.

BELUSDT Primed for a Major Surge - Eyeing a 150% JumpAttention, crypto enthusiasts! We're closely monitoring BELUSDT.P on Binance, and it's showing all the right signals for an imminent pump. The coin seems to be gathering momentum, poised for a significant upward trajectory. A critical observation is the recent breakout from a triangular pattern, a classic bullish indicator. This development heightens the likelihood of a substantial rally. If the momentum continues as anticipated, we're looking at a potential 150% increase. What are your thoughts on this coin? Are you as optimistic about its potential surge as we are? Let's discuss and navigate this exciting opportunity together!

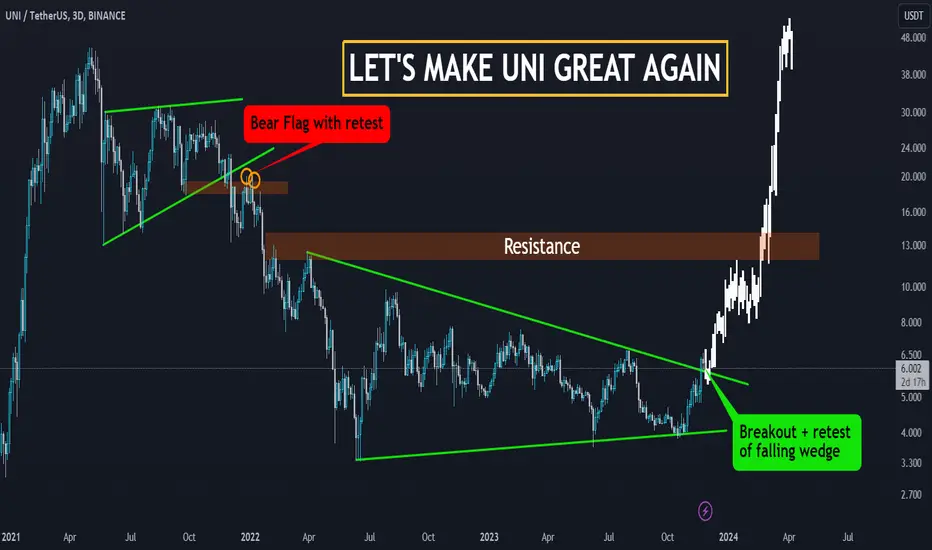
🚀 UNI : Breaking from Bear Flags to Bull Wedge ! December 2021 marked a challenging period for Uniswap (UNI) as it navigated through a bearish flag pattern, experiencing a significant drop. Fast forward to the present, and UNI is staging a potential comeback. The charts reveal a pattern shift, transitioning from bearish flags to the formation of a much larger bullish structure—a falling wedge. Let's delve into this transformation.
Chart Analysis: UNI's Evolution on the Charts
In the closing months of 2021, UNI faced the bearish pressure of a flag pattern, resulting in a notable decline. However, the narrative takes a positive turn as UNI is now crafting a bullish story. A substantial falling wedge pattern has emerged, hinting at a potential reversal. The formation of this pattern, especially when larger in scale, often signifies a shift in market sentiment.
Anticipated Move: Falling Wedge and the Road to Retesting Highs
As UNI maneuvers within the falling wedge, chart analysts are optimistic about the potential upward trajectory. Falling wedges are typically regarded as bullish patterns, and the anticipation is that UNI might experience a breakout. Furthermore, market participants are eyeing a retest of upper boundaries post-breakout, a crucial step to validate the newfound bullish momentum.
Trading Strategy: Capitalizing on UNI's Chart Dynamics
Traders and investors observing UNI's chart dynamics may consider strategic moves within this falling wedge setup. Identifying entry points during the wedge's contraction phase and being prepared for potential breakout and retest scenarios could enhance trading strategies.
Conclusion: UNI's Chart Renaissance
Uniswap (UNI) is in the process of charting a new narrative, transitioning from bearish flags to the promise of a falling wedge. While past challenges are acknowledged, the evolving chart dynamics suggest a potential resurgence for UNI.
🚀 UNI Analysis | 🌐 Breaking Free from Bear Flags | 📉 Embracing the Falling Wedge
❗See related ideas below❗
What are your insights on UNI's chart evolution? Share your thoughts, trading strategies, and bullish expectations in the comments! 🌈🚀💚
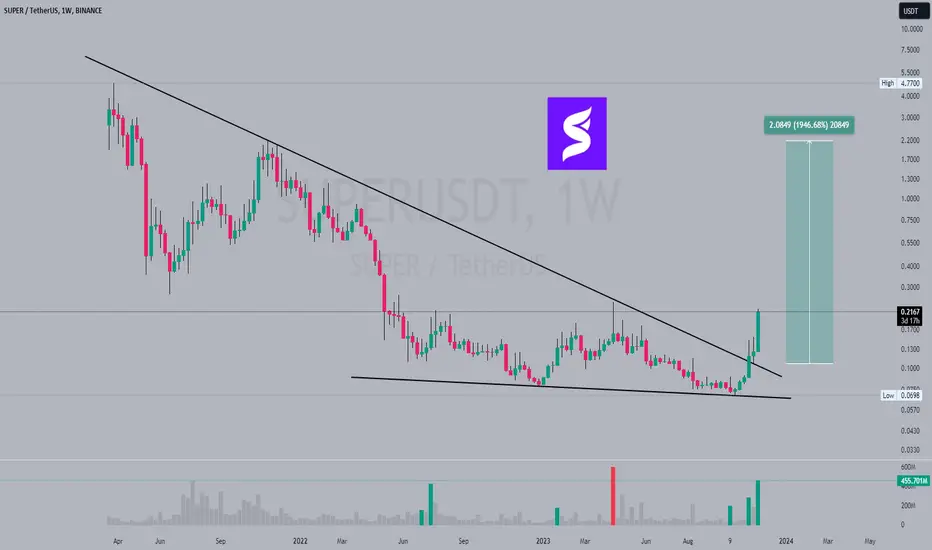
$SUPER Falling Wedge Broken Last Week, and now we are just looking how fare we can go...
We will Hold it till $2.00
#SUPER #SUPERUSDT #Crypto
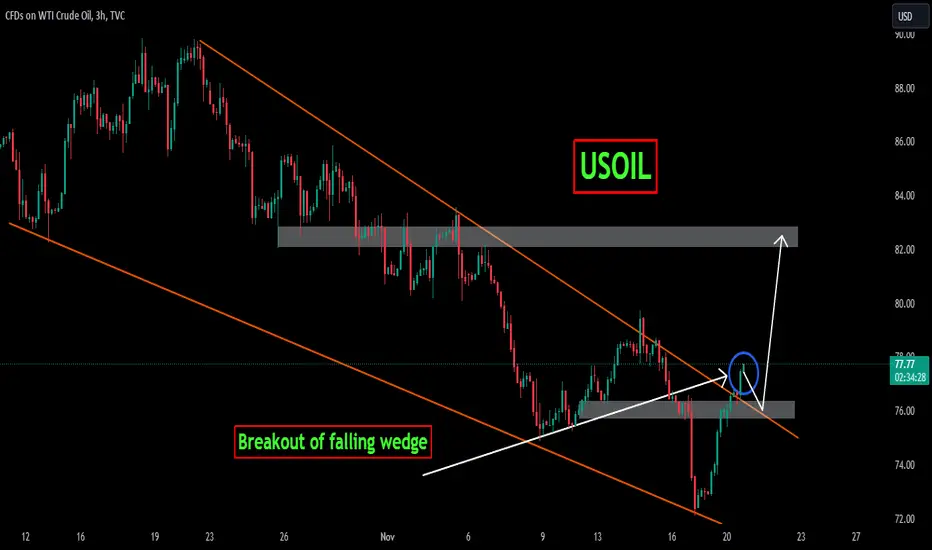
USOILUSOIL was trading under declining trendline and recently it seems like the sellers are bit exhausted then bulls took the charge and break through declining trendline.
Currently the price has given the breakout from falling trendline and now forming a local support around 76.50 region.
Will the bulls take charge again continue for leg higher?
Long on BABA
BABA has broken out of a descending wedge and had a retest of support with bullish RSI divergence. Stoploss at last swing low and will be moving SL to BE when safe to do so.

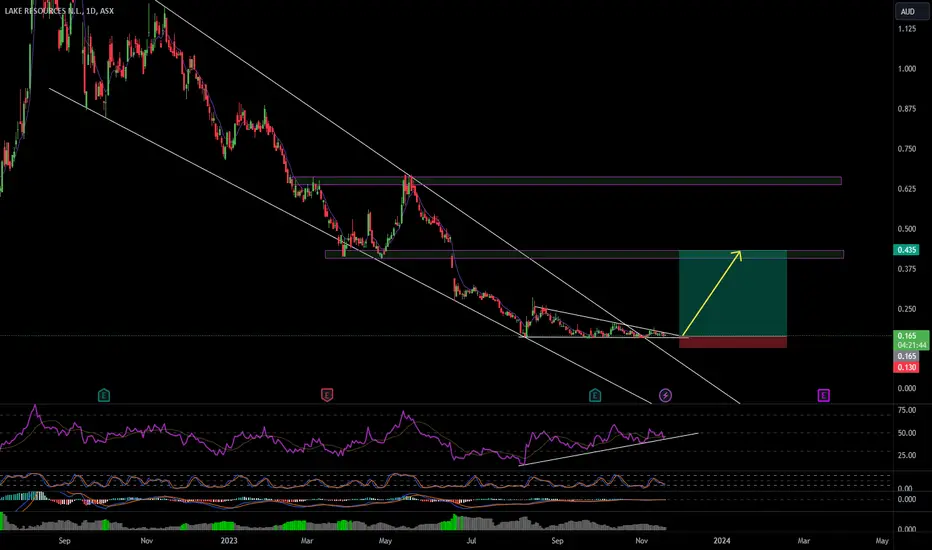
Potential Long on LKE
LKE was in a descending wedge with bullish RSI divergence and now in a triangle. Look for a breakout of trendline for entry, stoploss at last swing low and will be moving SL to BE when safe to do so.