FILE FAKEBREAKOUT PATTERNThe current area support is very suitable for continuation of the upward trend
Wedgebreakout

ALGO's BEAR TRAP: Pump in the Process?Algorand (ALGO) has orchestrated a fascinating move that has caught the attention of traders and investors alike. It appears to have fallen below a key support level, but could this be a cleverly designed bear trap? Many speculate that a pump might be on the horizon. Let's dive into this intriguing market development. 📈💥
The Fall Below Support:
ALGO recently breached a key support level, causing some concern among traders. However, in the world of crypto, not everything is as it seems.
A Potential Bear Trap:
While the drop may look ominous, it has all the hallmarks of a bear trap. This deceptive move is designed to lure in short-sellers who anticipate further decline, only to spring a surprise pump.
The Pump in Waiting:
ALGO's setup suggests that a pump might be in the making. The bear trap could be the trigger for a swift and substantial price surge.
Trading Strategy:
Vigilance: Keep a close eye on ALGO's price action, especially in the wake of the support breach.
Risk Management: Maintain sound risk management practices to protect your investments in the volatile crypto market.
Stay Informed: Stay updated with the latest news and developments related to ALGO that could influence its price movements.
Conclusion:
The crypto market is filled with clever maneuvers, and ALGO's recent move could be one of them. A bear trap, if that's what it is, often leads to a rapid and powerful reversal.
As you navigate these market intricacies, remember that vigilance is key. Be prepared for unexpected turns, and may your trades lead to success.
❗️Get my 3 crypto trading indicators for FREE❗️
Link below🔑

Harmony Secret Retest + Falling Wedge🚀Harmony (ONE) has been quietly making strategic moves in the crypto arena, and one of its recent maneuvers has unveiled an essential yet often unnoticed aspect of chart analysis: the retest of a crucial trendline. Furthermore, the formation of a substantial falling wedge on its weekly chart is sending bullish signals, indicating potential for exciting price action in the near future. 📉🚀
Rediscovering the Trendline Retest
Trendline retests are like hidden gems on a crypto chart. Harmony (ONE) showed its mettle by retracing back to a significant trendline, often going unnoticed by the crowd. This retest is a crucial aspect of price action analysis, as it confirms the trend's strength or highlights potential reversals.
The Falling Wedge: A Bullish Playground
But that's not all; Harmony (ONE) has another ace up its sleeve. The formation of a substantial falling wedge on the weekly chart is a hallmark of a bullish trend reversal. Falling wedges are characterized by a series of lower highs and lower lows that eventually converge. Once the price breaks out from the upper trendline, it typically embarks on an upward journey.
Trading Strategy: Navigating the Harmonious Journey
For traders and investors, recognizing these patterns is paramount. Harmony (ONE) provides an opportunity to enter or add to positions when the price eventually breaks out from the wedge. However, always integrate this insight into your comprehensive trading strategy, which includes risk management and exit plans.
Conclusion: Harmony's Melodious Move
Harmony (ONE) is orchestrating a melodious move in the crypto space, blending a stealthy trendline retest with the formation of a powerful falling wedge. This harmonic combination provides a potential setup for bullish price action in the coming weeks.
🚀 Crypto Insights | 💡 Trading Strategies | 💰 Market Analysis
❗See related ideas below❗
Share your thoughts and insights on Harmony's subtle yet promising chart formations.💚🌐💚

AUDCHF broke above triangle, to continue bullishAUDCHF
price broke above triangle structure. after a correction if price continues to hold above support I expect the price to move higher towards the next resistance..
Trade Wisely
*The content on this analysis is subject to change at any time without notice, and is provided for the sole purpose of assisting traders to make independent investment decisions.

BTC Show Wedges Galore: A Strong Bullish Signal for Traders
BTC is showing wedges galore, and it's a strong bullish signal we simply cannot overlook!
As seasoned traders, we understand the significance of recognizing patterns and signals that can potentially guide our trading decisions. Wedge patterns have long been regarded as powerful indicators of future price movements, and the current scenario in the BTC market is no exception. The formation of multiple wedges in recent weeks has caught the attention of analysts and experts alike, suggesting a promising upward trajectory for our beloved Bitcoin.
Let's delve into the details of this remarkable phenomenon. Wedges, characterized by converging trend lines that move in opposite directions, signify a period of consolidation and potential accumulation before a breakout. In the context of BTC, these wedges are forming at various timeframes, indicating a strong bullish sentiment prevailing in the market. This pattern suggests that buyers are gradually gaining control and accumulating BTC, setting the stage for an imminent upward movement.
Now, you may wonder why this information is crucial and how it can benefit us as traders. Well, the answer lies in the potential profits we can seize by taking advantage of this bullish signal. By identifying and acting upon these patterns, we can position ourselves for long trades, aiming to capitalize on the anticipated upward momentum of BTC.
So, fellow traders, I urge you to seize this golden opportunity and consider going long on BTC. However, please remember that every trade carries inherent risks, and it is essential to conduct your own thorough analysis and risk management before making any trading decisions.
In conclusion, the formation of wedges galore in the BTC market is an exciting development that cannot be ignored. It presents us with a strong bullish signal, suggesting a potential upward movement in the near future. As traders, it is our duty to stay informed, analyze the market diligently, and make calculated decisions to maximize our profits.

GBPNZD - Triangle & Wedge Breakout TradeWe've got a triangle, wedge, pennant pattern forming here on the GBPNZD and in this video i want to show you how I use the anchored volume tool to project the levels that price is likely to go to once we breakout from the pattern.
If you have any questions or comments about the idea, or if you just want to share your own views, please leave it in the comment section below.
Akil

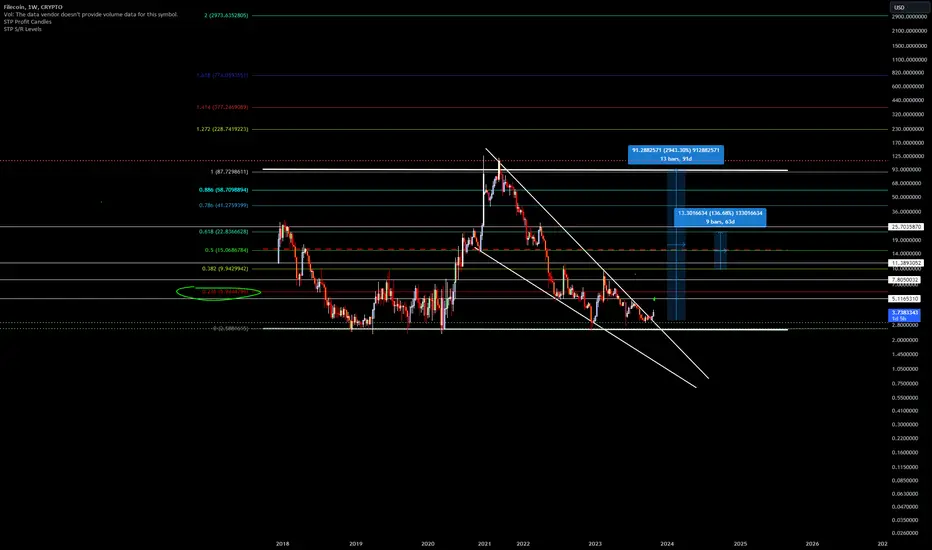
Confirmed Wedge Breakout on FIL/USDT - Targets to ATH ~$125 Analysis 📈
FIL/USDT has been trading within a wedge pattern for some time, and it's just confirmed a breakout, indicating significant potential for gains. Here's a comprehensive analysis, along with potential take profit levels.
Technical Analysis 📊
1. Take Profit at $6:
The $6 level marks a key psychological resistance point. It's a good place to secure some profits as FIL/USDT continues to climb.
2. Take Profit at $10:
A common technical resistance point, $10 should be another milestone to consider locking in gains.
3. Take Profit at $15:
At $15, you're looking at a solid gain, and it might be wise to take some profits off the table here.
4. Swing Target at $22 (Golden Mean Ratio):
The Golden Mean Ratio, often a significant level in Fibonacci analysis, suggests a target of $22 for the first major impulse. This is a potential turning point.
5. Take Profit at $41 (78.6% Retracement Level):
The $41 level represents a 78.6% retracement, and many traders consider this level for profit-taking or reevaluation of their positions.
6. Take Profit at $60 (88.6% Retracement):
The $60 level is another critical retracement point and should be a focus for profit-taking.
7. All-Time Highs at $125:
This is the primary target - a return to all-time highs. A substantial resistance level, but if FIL/USDT can break through, it opens up the path to further gains.
8. Major 1.272 Fib Extension at ~$200-$230:
This is where the potential for significant long-term gains lies. A sustained move above $125 could lead to a run-up towards the 1.272 Fibonacci extension, estimated to be in the range of $200-$230.
Conclusion 🚀
FIL/USDT has confirmed a wedge breakout, and the path ahead appears promising. Consider taking profits at the mentioned levels, but also keep a close eye on the price action and adjust your strategy as the market evolves.
Remember, cryptocurrency markets can be highly volatile, so make sure to set stop-loss orders and only invest what you can afford to lose. Always do your research and consider risk management in your trading strategy.
Keep a close watch on FIL/USDT as it attempts to breach the $125 level and aim for those ambitious long-term targets. Happy trading!
This is not financial advice; always perform your analysis and consult with a financial advisor before making trading decisions.
📊Capitalizing on the Bullish Opportunity on 1-Hour Chart 📈🔍Traders, get ready for an intriguing setup on the 1-hour timeframe for GBP/USD. It's all about recognizing the signs, and we've got them:
📌 Technical Analysis Highlights 📌
🔷 Bullish Wedge Pattern: The price action has diligently formed a bullish wedge pattern, and the exciting part? It has just broken through, indicating a compelling buying opportunity in this region.
📈 Support from Moving Averages: Two moving averages are playing a crucial role as they currently act as support, reinforcing this setup's potential. To sweeten the deal, they are on the verge of forming a bullish crossover.
📊 MACD Bullish Divergence: On the MACD indicator, a bullish divergence is making itself known, adding weight to the case for an upward move.
With all these technical signals aligning, I'm setting my sights on entering a buy position, with a well-placed stop loss at 1.05300. Here's where I'm looking:
🎯 Take Profit Targets 🎯
1️⃣ First Target: 1.05950
2️⃣ Second Target: 1.06250
3️⃣ Ultimate Target: 1.06700
Feel free to share your toughts in the comments section, follow me for updates and don't forget to press the like button if you want more qualitative insights like this one 🌊🚀

ENJ's Bullish Wedge: Unlocking ATH🎮💹Enjin (ENJ), a distinctive contender in the cryptocurrency arena, is currently in the midst of an exciting journey, setting the stage for potential surges in value. 🎮💹
Soaring to New Heights: ENJ's Redemption
Enjin, known for its association with the gaming industry, has weathered its fair share of challenges. However, like a protagonist in a captivating storyline, it's now ready for a remarkable comeback.
Gaming Meets Blockchain: A Powerful Combo
The fusion of gaming and blockchain technology is a match made in heaven, and Enjin is a front-runner in this game-changing fusion.
Chart Analysis: A Glimpse into ENJ's Future
A close examination of the charts reveals that Enjin is showing signs of life. The formation of a significant bullish pattern, the falling wedge, hints at a potential breakthrough.
Trading Strategy: Navigating ENJ's Ascension
For traders, recognizing Enjin's potential within the gaming and blockchain spheres should influence their trading strategies. Keeping an eye on pivotal indicators, staying updated with the latest news, and monitoring gaming partnerships are essential.
Conclusion: Enjin's Epic Journey
As Enjin redefines its narrative, it stands on the precipice of an era that could have profound ramifications. The convergence of gaming and blockchain, combined with the potential resurgence of the cryptocurrency market, positions ENJ as a project with a bright future.
🎮 Gaming and Blockchain | 📈 Cryptocurrency Surges | 📊 Trading Insights | 🚀 Price Targets
❗See related ideas below❗
Feel free to share your insights and engage with our community. Your active participation enriches our crypto discussions. 💚🚀💚

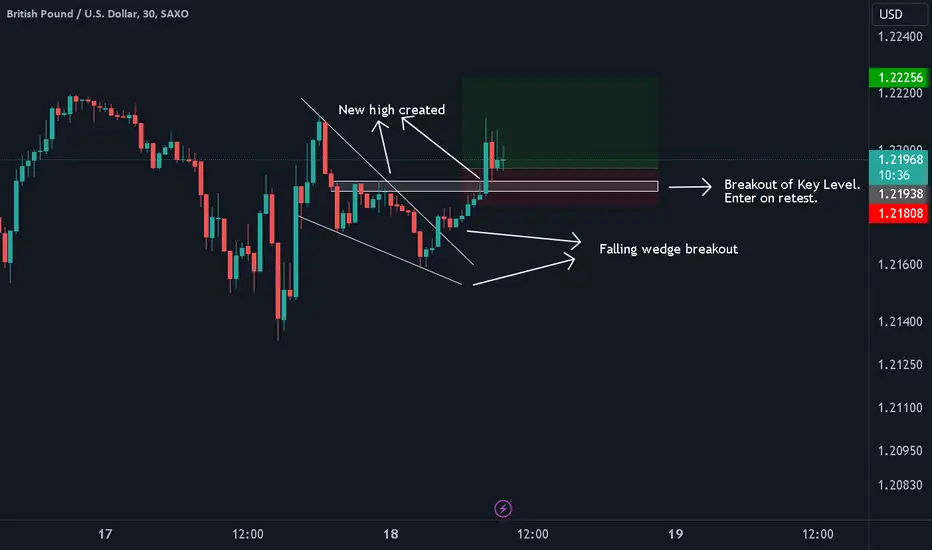
GBPUSD Falling Wedge BreakoutThe pair is already in an uptrend on higher time frames. We expect further upside which is signalled by the breakout of the falling wedge pattern. We can also see the formation of a new high and a breakout of a key level which further supports our directional basis. Entry on the retest of the key level.
NZDUSD Rising Wedge Pattern BreakoutThe pair is already in a strong downtrend on higher time frames. We are expecting further weakness which is signalled by the breakout of the rising wedge pattern. We can also see the formation of a new low and a breakout of a key level which further supports our directional basis

NZDJPY Rising Wedge BreakoutThe pair is already in a strong downtrend on higher time frames. We are expecting further weakness which is signalled by the breakout of the rising wedge pattern. We can also see the formation of a new low and a breakout of a key level which further supports our directional basis.

USDSGD ↘️ Rising wedge breakout .150+ Hello Everyone 🙋🏽♂️
🔴 1.36704
🟢 1.35540
🟢 1.34735
We are not responsible of any losses for anyone, our trades are profitable more for long terms and we take losses as everyone,
manage your lot size as well and your SL and TP
Don't forget to hit the like bottom and write a comment to support us.
Follow us for more 🙋🏻♂️
Best Regard / EMA Trading .
Disclaimer:
----------------
It's not a financial advise, As everyone we take losses sometime but for long term trading we are profitable traders, so manage your account well with SL and TP and your lot size to keep your account safe and stay in the market .

NZD/CHF Short trade entry - Wedge breakoutWe just had a clean breakout of a wedge to continue a strong downtrend - will look to short if we mitigate our supply zone on a retest of the wedge and create a LTF CHoCH
Coinciding with my previous post, we have been sustaining a healthy downtrend while mitigating our intended supply zones.
Price has now shown higher time frame signs of reversal and created our first major CHoCH. We now look for:
1. A major BOS (currently hovering around the former low) and subsequent supply zone mitigation
2. Downside fakeout and strong support at .5435 level to breakout of wedge to the upside and flip mitigated supply zones
Don’t forget from last post, we have a massive liquidity pool below us at our weekly demand zone!

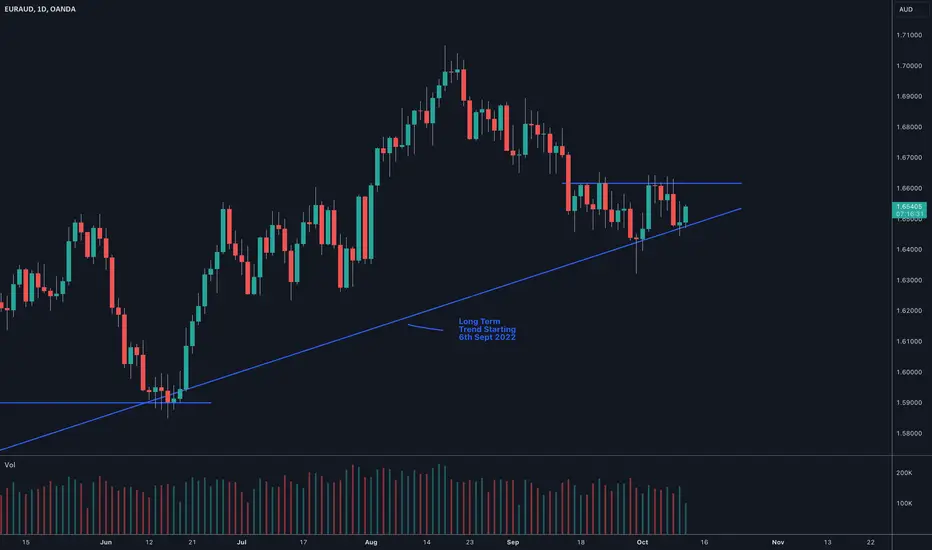
EURAUD Wedge Forming Interesting development on EURAUD as price is starting to narrow between recent highs and a munch longer term trend line. The uptrend started on 6th Sept 2022 after putting in a low around 1.43000 in late August.
Technicals
The uptrend line has provided solid support ever since, with bounces in January and June of this year. The January example is most interesting as price also started to narrow in a wedge pattern before breaking to the upside for an eventual 7.5% run.
I'm interested on both the Long and Short side, with a slight bias Long given the strength we've seen over the past year. A similar 7.5% run would see us hitting prices around 1.7800.
Macro
The wedge will break before the next ECB meeting on Oct 26th so we can't use that as a guiding factor. The next notable news event in the coming week is the release of the AUD monetary policy meeting minutes on Oct 17th which is close to the apex of the wedge.
Trades
I'm looking for intra-day moves, and so will use a breakout in either direction as a signal to watch the lower time frames for entries. There was a wedge break on CADJPY last month with provided several great long trades post break, so don't feel pressured to make a decision now. Wait for a CLEAR break, being cautious of fake out moves.
BTC DOMINANCE - Challenging Time for AltcoinsBitcoin's Growing Dominance:
Bitcoin has been flexing its muscles in the market recently, steadily increasing its dominance. This is a reflection of its strong performance and renewed interest from investors. 🏆
Retesting the Range:
Range was brewing for 772 days
What's causing concern in the altcoin space is the recent retest of the upper boundary of Bitcoin's consolidation range. This range has acted as a significant level of resistance for Bitcoin, and a breakout from it could further reinforce its dominance. 📉
What It Means for Altcoins:
As Bitcoin's dominance grows and it asserts its position, altcoins often face headwinds. Investors tend to flock to the safety of Bitcoin during times of uncertainty, potentially leading to a decrease in altcoin prices. 🌪️
Conclusion:
While Bitcoin's rising dominance presents challenges for altcoins, it's crucial to remember that cryptocurrency markets are dynamic. Trends can shift, and opportunities can arise even in challenging times.
As an investor, it's essential to stay informed, adapt your strategy as needed, and maintain a long-term perspective. The crypto world is known for its resilience, and it continues to be a space where innovation and growth thrive.
❗️Get my 3 crypto trading indicators for FREE❗️ Link below🔑

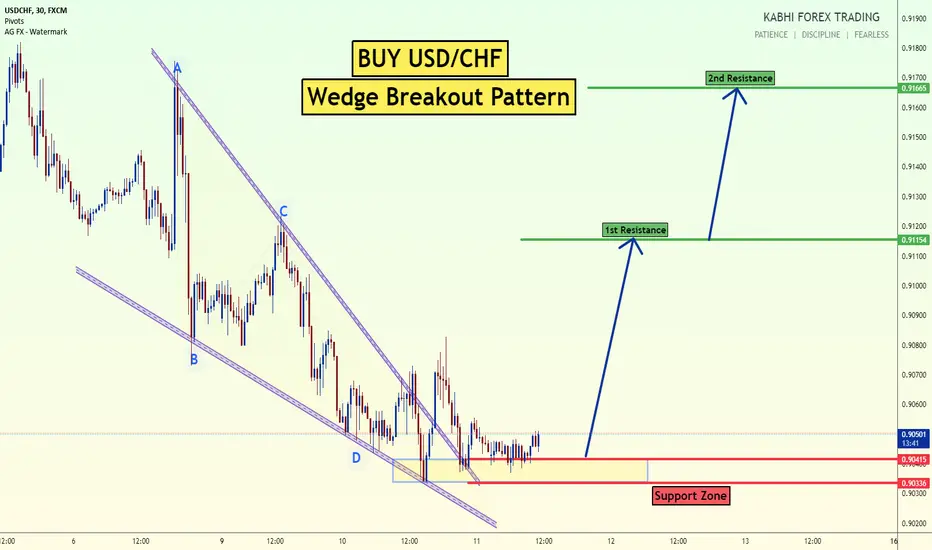
Buy USDCHF Wedge BreakoutBuy USDCHF Wedge Breakout
Price breaks the wedge pattern in M30 chart,
its good chance to Buy today as intraday entry.
Thank you
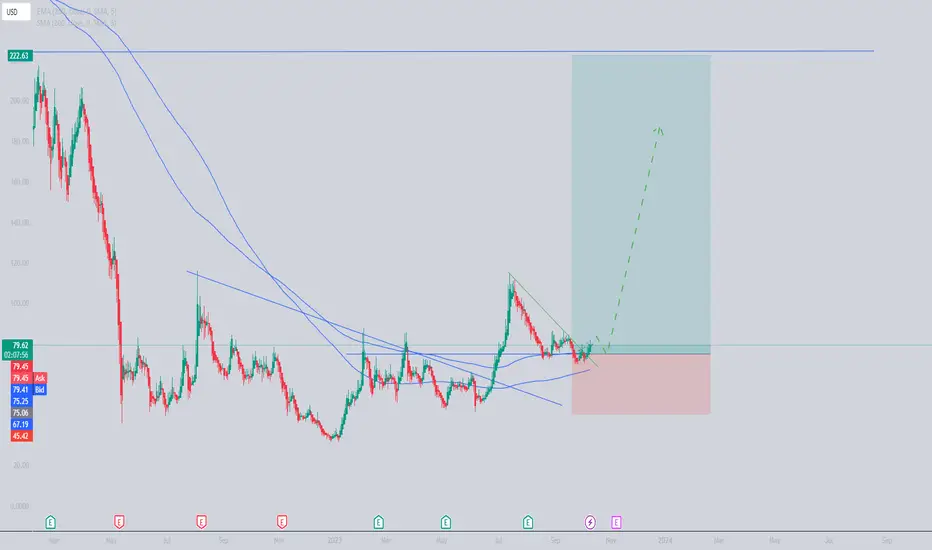
crwd weekly timeframebreakout from wedge pattern and going up
its good investment for long term investment

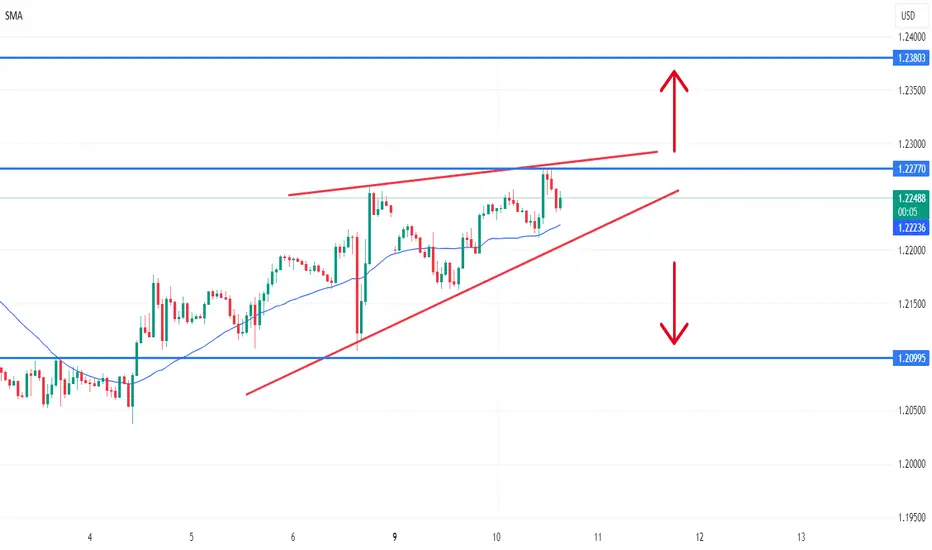
GBPUSD Upward Wedge? 10.10.2023Seems that the GBPUSD has formed an upward wedge. Volatility started to get to lower levels after the NFP news on Friday.
The Breakout of the upper or lower band of this formation could cause the market to move rapidly in the same direction as depicted by the arrows.
__________________________
Information Regarding Important News and Figures can be found here in our Economic Calendar: mau.bdswiss.com/economic-calenda...
Risk Warning: Trading in CFDs is highly speculative and carries a high level of risk. It is possible to lose all of your invested capital. These products may not be suitable for everyone, and you should ensure that you fully understand the risks taking into consideration your investment objectives, level of experience, personal circumstances as well as personal resources. Speculate only with funds that you can afford to lose. Seek independent advice if necessary. Please refer to our Risk Disclosure.
BDSwiss is a trading name of BDS Markets and BDS Ltd.
BDS Markets is a company incorporated under the laws of the Republic of Mauritius and is authorized and regulated by the Financial Services Commission of Mauritius ( FSC ) under license number C116016172, address: 6th Floor, Tower 1, Nexteracom Building 72201 Ebene.
BDS Ltd is authorized and regulated by the Financial Services Authority Seychelles (FSA) under license number SD047, address: Tenancy 10, Marina House, Eden Island, Mahe. Payment transactions are managed by BDS Markets (Registration number: 143350).
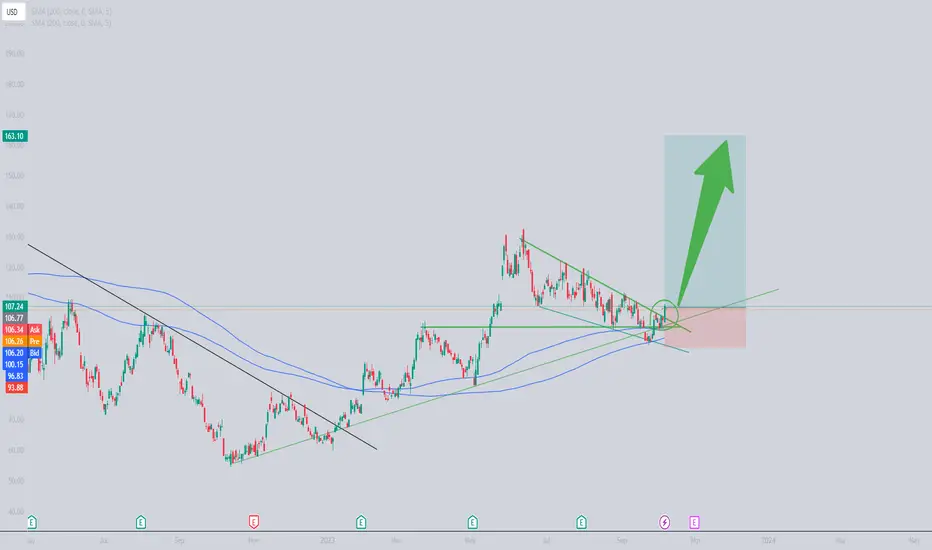
AMD Daily timeframeafter valid breakout from wedge patern in daily timeframe with candle we can enter to long position with 4 risk to reward that its good
maybe price want to meet trend line again.. pay attention to this
good luck
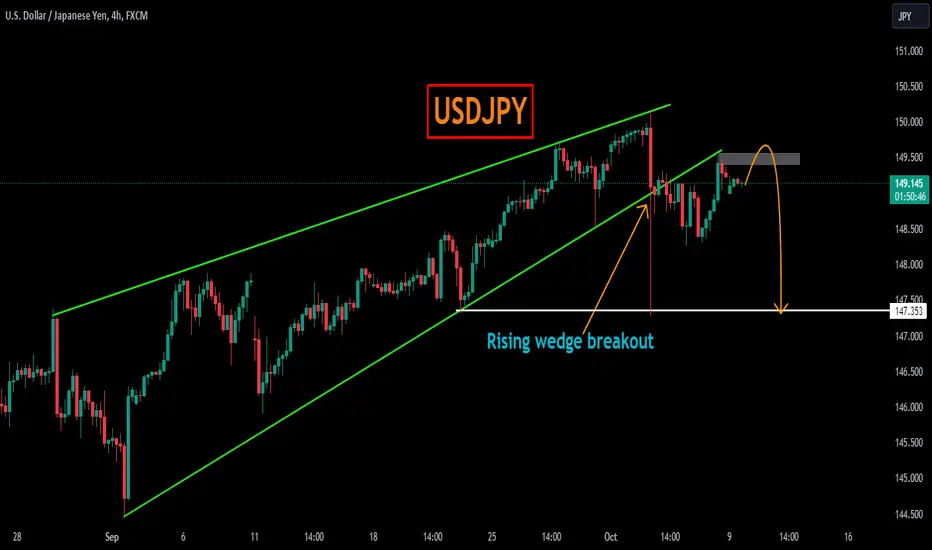
USDJPYUSDJPY was trading in rising wedge pattern till the sellers took control from channel resistance and has given the massive sell rally. That sell rally break the inclining trendline of the wedge.
Now the price is retesting the broken trendline and broken support level.
it seems like the sellers can attack again this bearish confluence.
If the sellers takes charge again, the next target could be 147.35
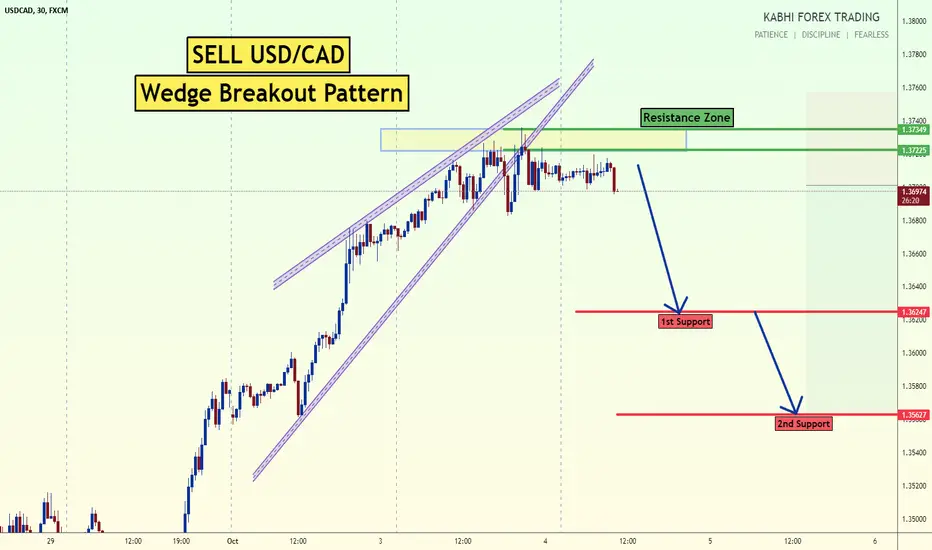
Sell USDCAD Wedge BreakoutSell USDCAD Wedge Breakout
USDCAD - m30 Chart - price breaks the wedge pattern now,
its good chance to sell
Thank you