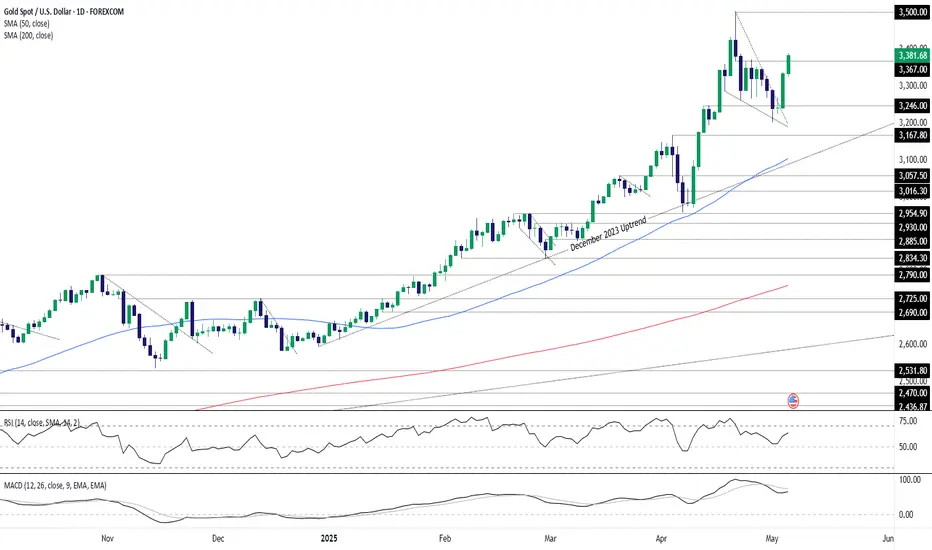
Gold Breaks Wedge, 3270–3280 Now Key Pivot for RecoveryGold's recent retreat has slowed, forming a descending wedge pattern that has now been broken. This is a constructive setup for a potential upward reaction after falling $300 from the $3,500 high. The 3,270–3,280 zone is now the short-term pivot point. If this level breaks as well, the upward move may finally begin.
Potential targets include the 38.2% retracement level at 3,316 and the main resistance zone at 3,355–3,370.
Wedge

Gold’s Got Its Groove Back: Morning Star Lights the Way to $3500Gold delivered a powerful signal pointing to a resumption of the bullish trend, completing a morning star pattern that saw it break out of the falling wedge it had been trading over the past fortnight. It would have been nice to catch the initial move, but all is not lost after the price broke above $3367 on Tuesday.
The price has run hard, so I’m reluctant to chase the move. But if we see a pullback and bounce from $3367, it would generate a bullish setup where longs could be established above the level with a stop beneath for protection. The obvious trade target would be the record high of $3500 set in April.
If the price were to reverse below $3367 and stay there, the setup would be invalidated.
Good luck!
DS
Formation of the Wedge Pattern in the Japanese Index.The formation of a wedge pattern in the Japanese stock index has raised concerns among investors, as it often signals potential volatility and market correction.
A wedge pattern typically occurs when the price movement narrows between converging trend lines, indicating indecision among traders.
In the context of the Japanese stock market, this pattern can be particularly telling, as it suggests that the index may be reaching a critical juncture. Recent trends have shown a gradual decline in the index, which could lead to a significant downturn if the wedge breaks downward.
Investors should remain vigilant, as a sustained drop in the index could trigger broader market reactions and impact investor sentiment. Monitoring key economic indicators and geopolitical developments will be essential in navigating this precarious phase. As the situation unfolds, prudent risk management strategies will be vital for those looking to mitigate potential losses in a fluctuating market environment.

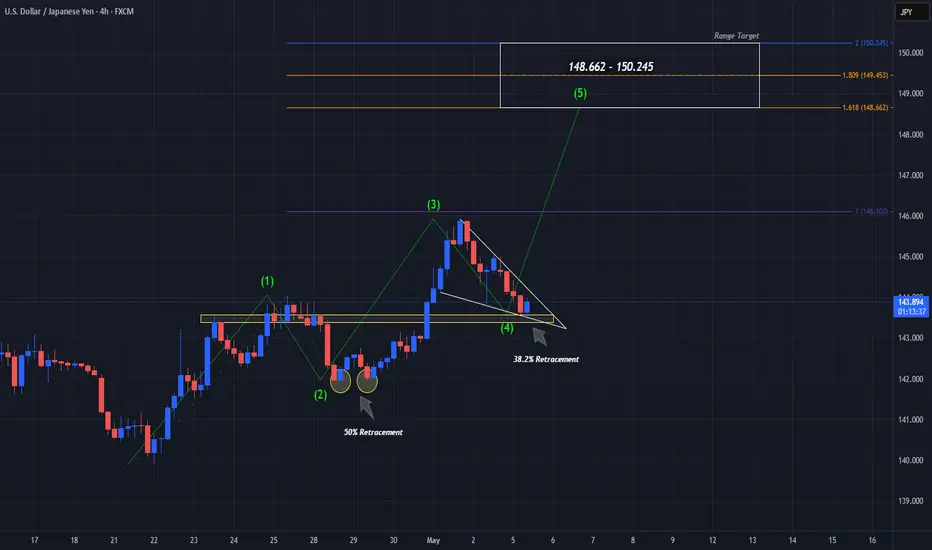
UJ Impulse Wave 5 IncomingFX:USDJPY seems to have finished Wave 4 being a Correction Wave of the Elliot Wave Theory and looks to be prepping for the start of Wave 5 being an Impulse Wave!
Now Price has not only made a 38.2% Retracement to 143.6 of the 145.941 Swing High that ended Wave 3 but is testing Break of Previous Structure being Past Resistance attempting to turn it into Support if enough Buyers enter the market in this opportune area.
Price Action during the Correction of Wave 4 has formed a Falling Wedge Pattern, typically seen as a Continuation Pattern. For this to be fact, we will need to see a Bullish Breakout to the Falling Resistance followed by a successful Retest of the Break where the Long Opportunities should present themselves.
Once Wave 5 is confirmed, we can expect Price to work from here and potential reach the Potential Range Target of ( 148.662 - 150.245 )
Wajani Investments: Wheat analysisWheat has formed a very strong Head and Shoulder with a bearish wedge or descending triangle . This can be seen from both monthly, weekly and daily timeframes. All these points to lower prices in the weeks ahead. In this market you can risk a 1:3
Remember to always adapt or make changes as the market changes.
Let me know your thoughts.

EURO - Price can rise to top part of flat from support areaHi guys, this is my overview for EURUSD, feel free to check it and write your feedback in comments👊
Some time ago, price entered to wedge, where it bounced from support line and rose to $1.0860 level, breaking $1.0470 level.
Then price broke $1.0860 level too, but then it made correction to support line of wedge and then made upward impulse.
Euro exited from wedge and continued to grow to $1.1260 level, after which broke this level and started to trades in flat.
Inside flat, price rose to top part of flat and then made correction to support area, where it some time traded close.
At the moment, Euro trades inside support area, near support level, so, I think that price can correct to $1.1260 level.
After this movement, in my mind, EUR can start to grow to $1.1570 top part of the flat.
If this post is useful to you, you can support me with like/boost and advice in comments❤️

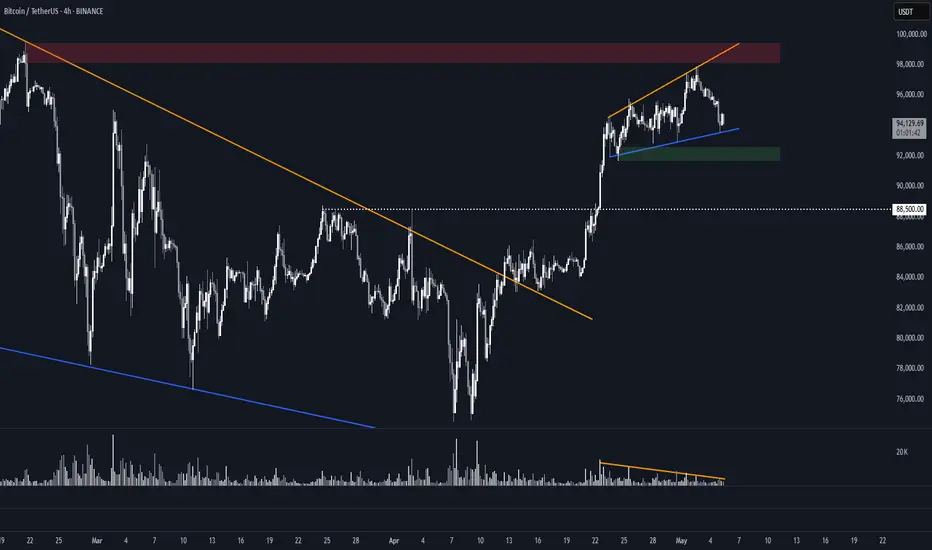
Bitcoin Ascending Broadening Wedge (4H)After a clean breakout above the macro downtrend, BINANCE:BTCUSDT rallied into its supply zone — but price action has since become increasingly volatile, forming a rising broadening wedge (also known as a megaphone pattern).
Pattern Insights
• The structure is defined by diverging trendlines, with each swing becoming larger and more erratic.
• This pattern often signals instability or exhaustion, especially near key resistance.
• While it can break either way, broadening wedges in an uptrend frequently resolve to the downside, especially when supply is overhead.
Key Levels
• Resistance: ~$ 98K-$99.5k supply zone — the upper boundary of the pattern.
• Support: ~$93.5k area — prior S/R, potential flip zone.
• Reversal: A breakdown below ~$93k could confirm a short-term bearish resolution and open the door to ~$88.5k.
• Continuation: A breakout above the upper boundary with volume could trap shorts and ignite a squeeze toward new highs.
Until then, BTC remains in a high-volatility structure, best approached with caution or as a range-trading opportunity.
EURCHF new bearish push expecting
OANDA:EURCHF FALLING WEDGE we are have, in moment its be breaked, price is also be and on trend line with FW, i am expect price will continue pushing, but looks like we will have break of trend line and bounce on sup zone 0.93950
SUP zone: 0.94000
RES zone: 0.92450, 0.92000

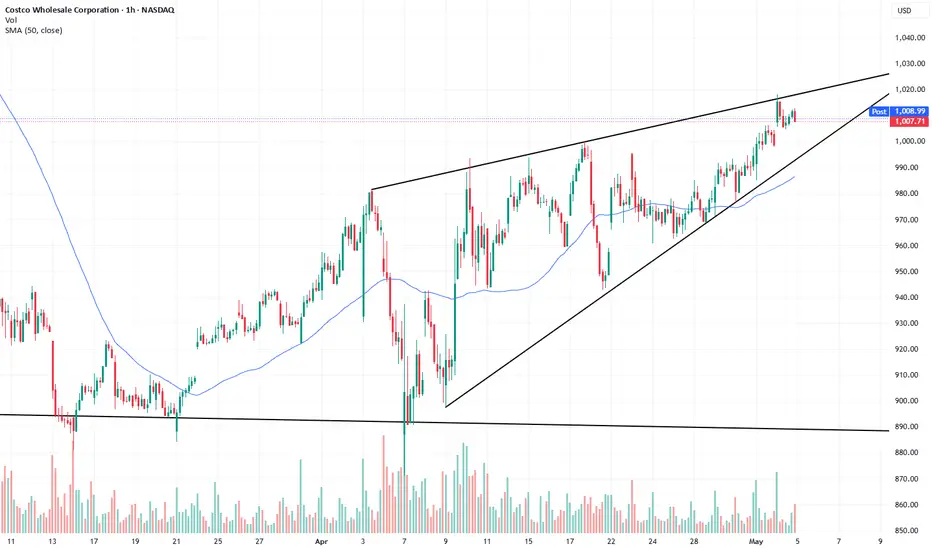
$COST Rising WedgeCost perfectly tagged the upper line of the rising wedge that we have seen play out over the past couple of weeks. I opened some puts at the top today in hopes that it breaks to the downside of this wedge for a target around $900. This would also complete the right shoulder of H&S on daily chart.
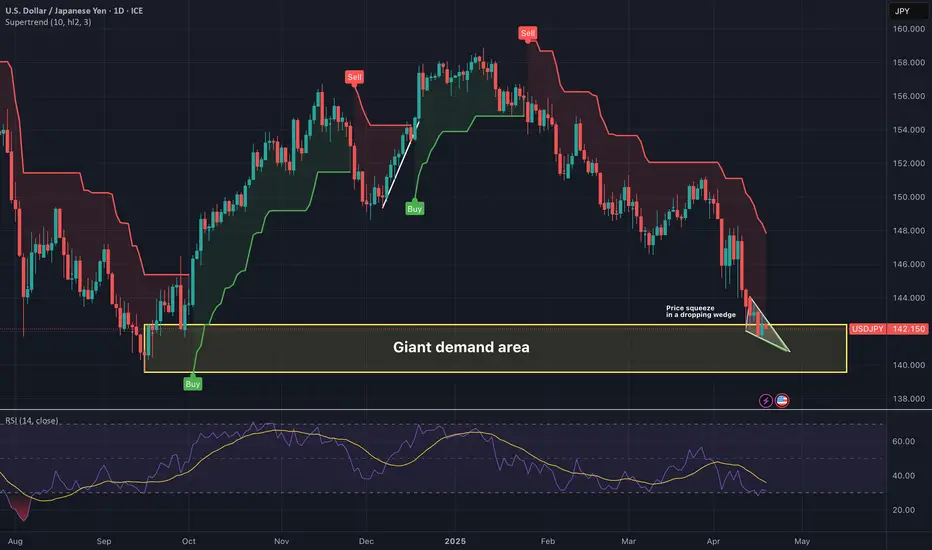
Uj might be reversing- We are at a painfully large demand area.
- Price squeezing and consolidating in a dropping wedge.
- Thursday candle was a bullish harami (indicating a possible u-turn)
- Friday was the Good Friday (Market holiday), so it doesn't count
Let us patiently wait here for the price to either break the wedge or at least it hits the lower border of the wedge to place our first entry. The reversal is imminent provided we do not break the demand area. Patience is the key here.
Once we have a full confirmation to buy we will look further for targets, till then just watch it.
I will update you guys when I place my own entry. Pray hard, trade smart :) and best of luck!
Here is the close up look of the wedge:
Ishares 20+ Year Treasury Tumble with -15% crash ??On the above monthly chart price action has seen a nice 25% rise since November 2023. A number or reasons now exist to be bearish.
Incidentally, with all the recently published ideas on Tradingview, Without Worries appears to be the only one who is bearish.
The reasons?
1) Broken market structure confirmation.
2) Active price action resistance.
3) Rising wedge. A breakdown confirmation will see price action correct 17%.
4) $76 is the next support level, which is incidentally the measured move forecast by the bearish wedge identified in (3).
Is it possible price action continues to rise as most of Tradingview is calling for? Sure
Is it probable? No.
Ww

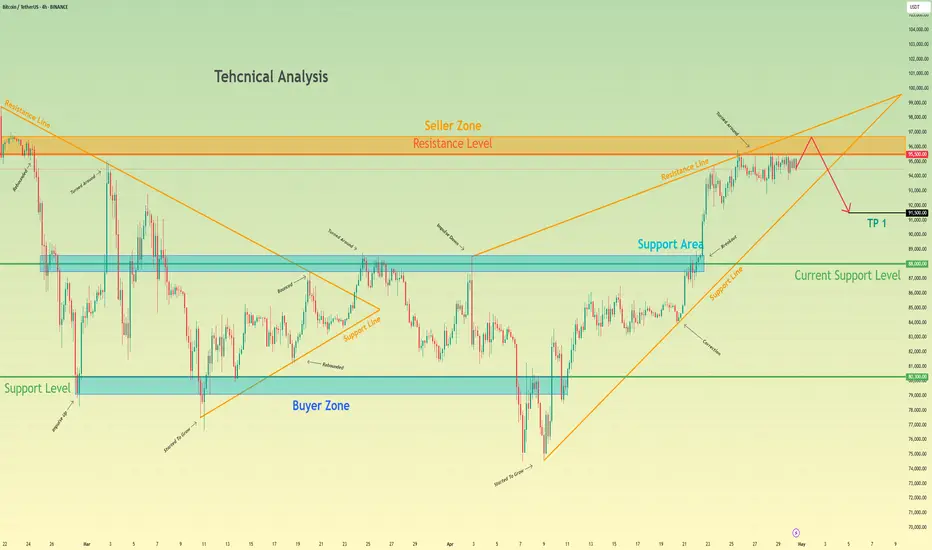
Bitcoin may rebound from seller zone and start to declineHello traders, I want share with you my opinion about Bitcoin. In the past, the price had been consolidating within a broad range, repeatedly rejecting support and resistance zones. The buyer zone between 79100 - 80300 provided a strong base, and from there, BTC began to grow, forming a bullish structure that led into an upward wedge. This growth accelerated once the price broke through the support area and continued upward until it approached the resistance level at 95500, which also overlaps with the seller zone. As the price moved inside the wedge, the bullish impulses weakened. Buyers lost strength near the resistance line of the wedge, and recent price action suggests that sellers are stepping in at the top. We’ve now seen multiple failed attempts to break higher, and the price is consolidating under resistance, forming pressure to the downside. This entire consolidation near the wedge resistance, especially inside a confirmed seller zone, indicates a likely reversal. The current structure shows signs of exhaustion, and if the support line of the wedge breaks, that would trigger a significant correction. Given this context, I expect BTC can make a bearish move toward TP1 at 91500 points. Please share this idea with your friends and click Boost 🚀
BITCOIN - Price can exit from wedge and rose to $102K pointsHi guys, this is my overview for BTCUSDT, feel free to check it and write your feedback in comments👊
Some days ago, the price declined to $81600 level, after which it bounced and rose to $88500 points and then started to fall.
Also price entered to wedge pattern, where it fell to support line, breaking support level, but soon turned around and bounced up.
Price broke $81600 level again and continued to grow next, but later it corrected to support line.
Then, BTC rose from this line to $93000 level, broke it, and reached resistance line of wedge, after which corrected.
After correction, BTC fell to $93000 level and then rose back to resistance line of wedge, where it trades close.
In my mind, price can correct to support line and then bounce up to $102000 points, exiting from a wedge.
If this post is useful to you, you can support me with like/boost and advice in comments❤️

Coca-Cola is Pouring Out Of the Wedge-Shaped Container.Experienced investors understand that market trends are not static.
Currently, Coca-Cola stock is presenting a compelling technical formation: a wedge pattern nearing completion.Repeated tests of both upper and lower trendlines within this wedge suggest a pivotal moment is approaching.
Our analysis indicates that a downward breakout is highly probable, presenting a potential short-selling opportunity for astute traders.
We anticipate confirmation of this bearish scenario upon a decisive break below the lower trendline, followed by a pullback and final test.
This is not a suggestion to act rashly, but rather a call to diligent observation and strategic preparation. By carefully monitoring price action and utilizing sound risk management principles, investors can position themselves to potentially profit from this projected decline in Coca-Cola stock.

NZDCAD: One More Bearish Forex Pair 🇳🇿🇨🇦
One more CAD pair that looks strongly bearish to me is NZDCAD.
Price action analysis speaks out loud on a daily.
The market was rallying nicely and started to slow down,
approaching a key horizontal resistance.
The price started to consolidate and dropped then violating
multiple horizontal supports and a rising trend line.
With a high probability, the market will drop even lower.
Next support - 0.81
❤️Please, support my work with like, thank you!❤️

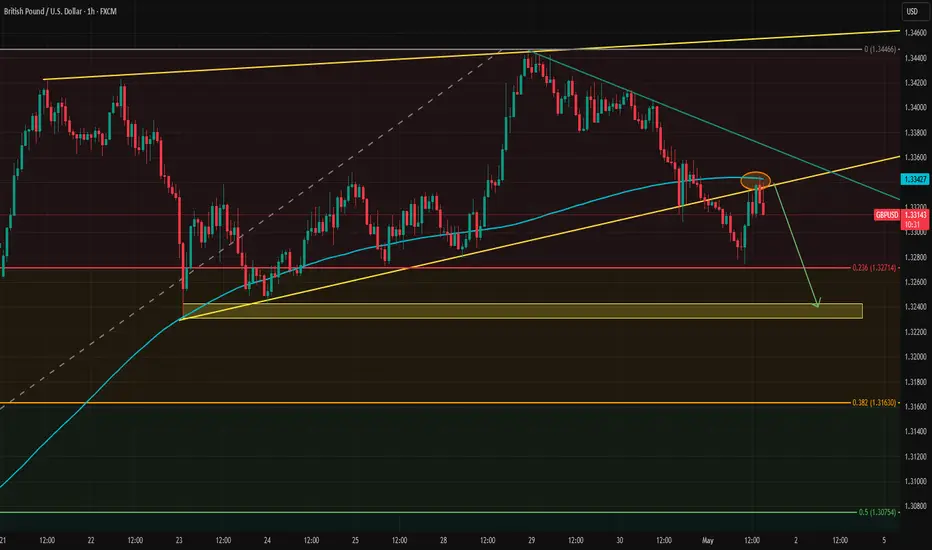
Short-Term Outlook for GBPUSD Turns BearishGBPUSD formed and then broke an ascending wedge formation. The dollar appears to be gaining modest ground against key currencies globally.
Hessent noted that tariff-related news is expected by the end of today. If the incoming update involves a trade deal with a major partner like Japan, it could further support the bearish technical outlook.
If the retest of the 200-hour SMA and the broken wedge’s lower boundary fails, GBPUSD may extend its losses toward the 1.3230 level later this week.
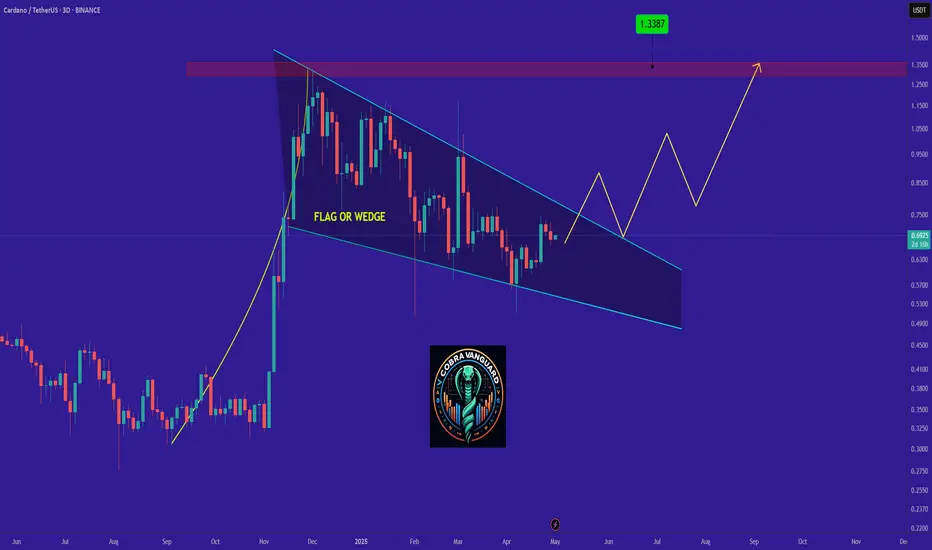
Be careful with ADA !!!So if you pay attention to the ADA chart you can see that the price has formed a Ascending FLAG or WEDGE which means it is expected to price move as equal as the measured price movement.( AB=CD )
NOTE: wait for break of the FLAG .
Give me some energy !!
✨We spend hours finding potential opportunities and writing useful ideas, we would be happy if you support us.
Best regards CobraVanguard.💚
_ _ _ _ __ _ _ _ _ _ _ _ _ _ _ _ _ _ _ _ _ _ _ _ _ _ _ _ _ _ _ _
✅Thank you, and for more ideas, hit ❤️Like❤️ and 🌟Follow🌟!
⚠️Things can change...
The markets are always changing and even with all these signals, the market changes tend to be strong and fast!!
MOVE hughe FW breakout incomming?MOVE has been dropping over 80% from it's ATH.
This looks like bearmarket scenario's. But as I did mention before in other posts. This bull cycle is different and especially for ALTCOINS. The massive growth in number of ALTS makes it hard to stand out and gain momentum. The money and social attention is widely spread over milions of coins now. The 1875 active accounts holding MOVE is reasonable for a relative new project jet it doesn't signal mass adoption.
MOVE is a Layer1 / 2 and ZK coin in the smart contracts. It's also in the World Liberty Financial portfoilio and made in the USA. These fundamentals are bullisch for MOVE. A breakout from the FW pattern could make it take off at rocket pace towards the former highs.
Allong the way we can see and identify several major S/R line that have to be broken first.
Indicators:
The rounded bottom / consolidation could mark the bottom.
Stoch indicator: The STOCH shows signs of recovery
Golden Cross: The short term MA has been crossing the Long term MA signaling recovery.
Volume: The low volume is typical for the consolidation.
CONSOLIDATION above support and below resistance
The level where we find MOVE right now looks like consolidation and bottom possibility. With support at 0,218 a small resistance at 0,34 and a major resistance at 0,56.
My trading plan for now:
I will open a new bigger SPOT position in order to lower my AVG ENTRY that has lost over 60% in the last months. A run up from this level to the S/R level 0,56 means a 177% profit.

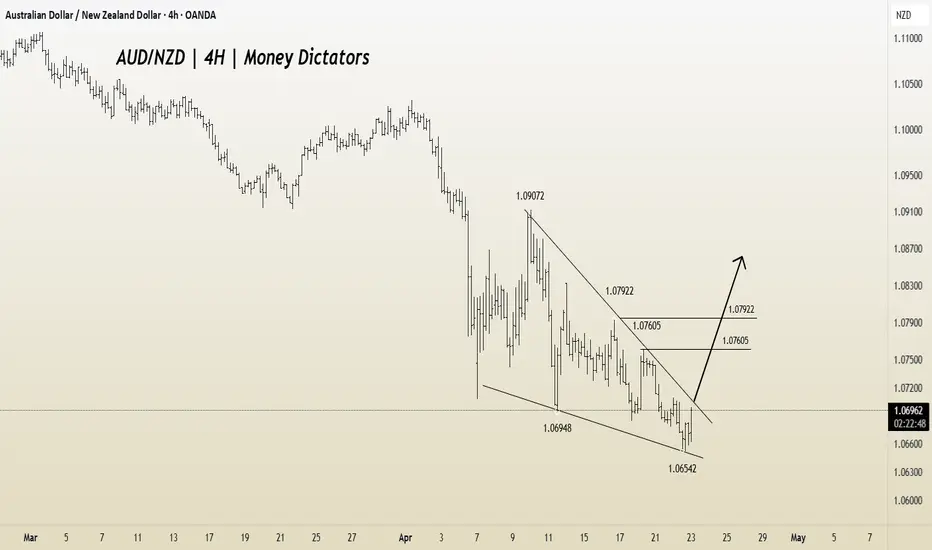
Watch This Wedge! AUDNZD Primed for Upside PushThe AUDNZD pair forms a falling wedge pattern, a bullish reversal formation that typically occurs after a downtrend. The price action is being squeezed between a descending resistance line and a descending support line, creating a narrowing range. The market is now attempting to break out of the wedge, with the current price testing the resistance line. A breakout and close above this trendline would signal bullish strength and could lead to a reversal of the recent downtrend.
Targets:
TP1: 1.07605
TP2: 1.07922
Stop Loss: Below the recent low at 1.06542
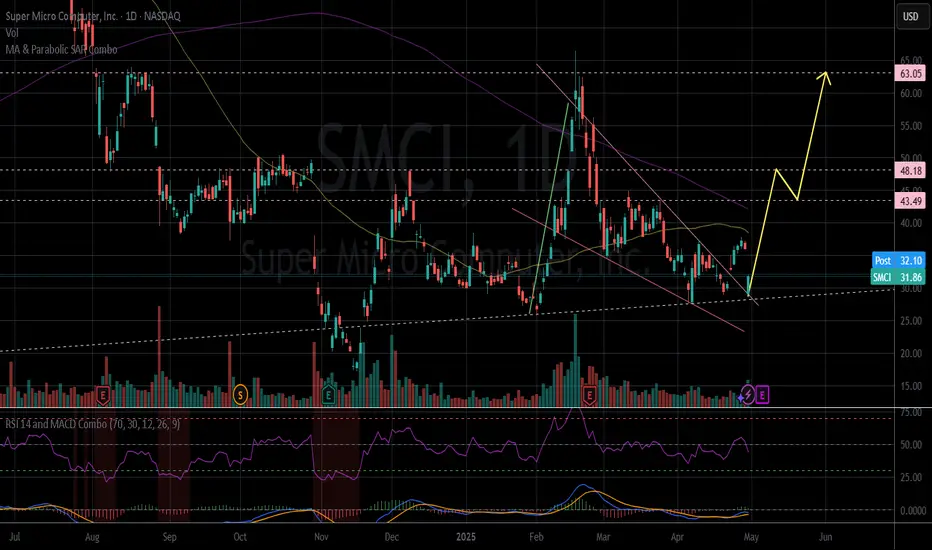
-14% 95 incomingBack down to retest the lows snagged 100 95 90 5/23 P before the close today then SMCI drops it 2% with a BILLION dollar miss not the news I was anticipating but I'll take it very fragile stock not holding up well GDP tm could accelerate loss.
SMCI - Bullish Wedge Flag patternBullish Wedge Flag pattern
The price broke out on last week and has retested today.
In the chart of the week frame, the price is on the MA200 line.
The price now (Closed on 04.30.2025): $31.86.
Price target: $48.18/ $63.05
IMO, amateur trader.
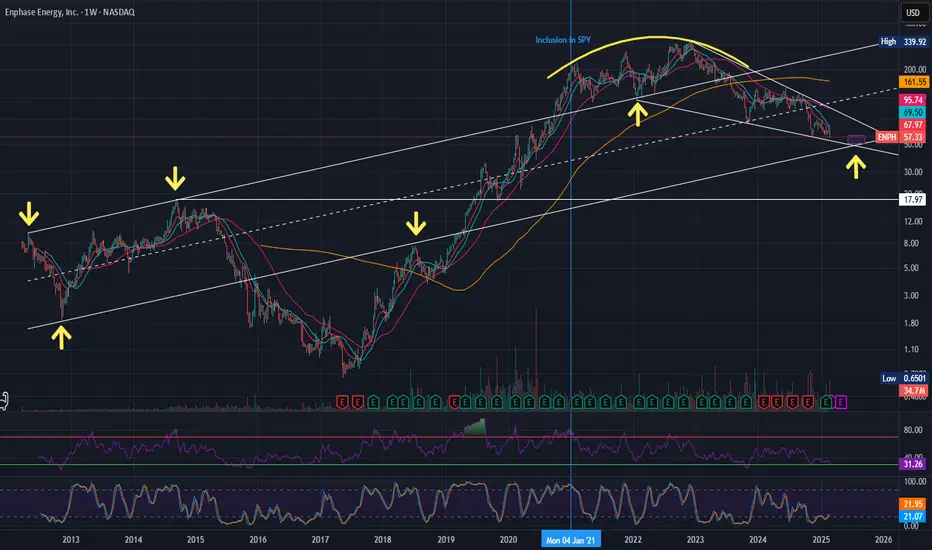
Expect ENPH breakout by EOY 2025. Buy <$60Trends:
- LT parallel channel shown marks some key trendlines for the company since IPO
- LT falling wedge intersects the bottom of this channel H2 2025 --> a buying opportunity above $50. If that breaks, falling wedge ends around $35, a 30% downside (or 40% vs today's price).
- The early 2023 peak aligned with peak in revenue and net income (decline matched stock decline). We're now seeing revenue and net income growth again (growth can bring back stock growth)
My Bias:
I'm a long-term believer in solar. ENPH plays mostly in the residential solar space (and is expanding into small commercial). They are often lauded for their high levels of customer service.
Investment Thesis:
We're back to financial growth but the stock is down. We're in a few months window before LT trends converge mid / H2 2025. If we break bullish from falling wedge and hit LOWEST point of parallel channel by EOY 2026, we'd be at $70/share (16% upside from $60; 40% upside from $50). This is my expected worst case scenario, meaning anything under $60/share is now a buying opportunity.
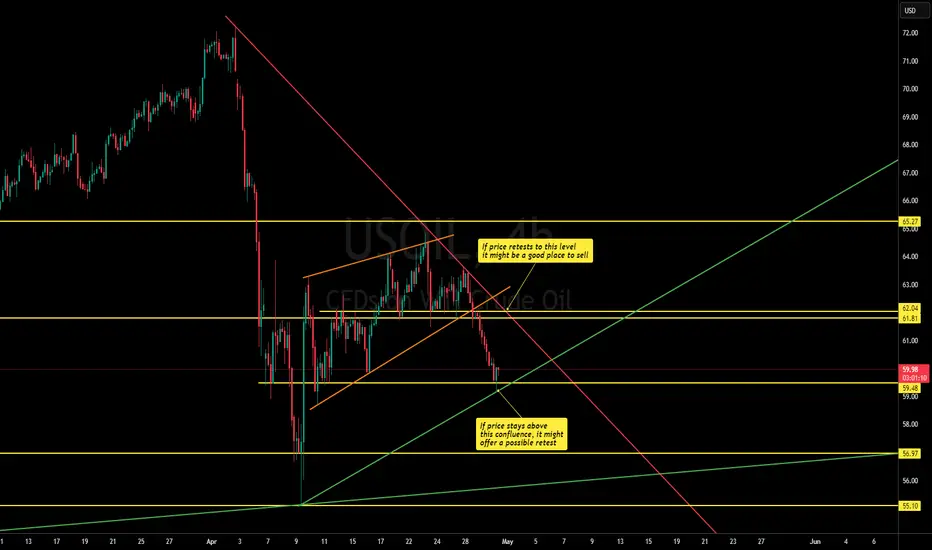
USOIL – Key Levels in Play. Here's What I'm WatchingAfter rejecting the 65.27 resistance, USOIL sold off sharply, dropping to the 59.5 support zone — just as anticipated.
This confirms that the market is still respecting key support and resistance levels and trend lines.
Current Scenario:
Price is sitting around 59.5. If this support holds, we could see a corrective move (buy) back to the 62 region. But that zone is now a strong area of interest — previously a broken support, now likely to act as resistance.
Here’s my game plan:
– If price pulls back to 62 and fails to break above, I’ll be watching for a sell setup targeting the 57 or even 55 area.
– If price breaks and holds above 62 with momentum, then I’ll re-evaluate for possible upside continuation.
– Right now, a short-term buy from 59.5 to 62 is valid, but it's riskier. The safer bias remains to the downside until 62 is broken cleanly.
So, while buyers might attempt something from current levels, the dominant trend and structure still favor the sellers — especially below 62.