Trading Divergences With Wedges in ForexTrading Divergences With Wedges in Forex
Divergence trading in forex is a powerful technique for analysing market movements, as is observing rising and falling wedges. This article explores the synergy between divergence trading and wedges in forex, offering insights into how traders can leverage these signals. From the basics to advanced strategies, learn how you could utilise this approach effectively, potentially enhancing your trading skills in the dynamic forex market.
Understanding Divergences
In forex trading, the concept of divergence plays a pivotal role in identifying potential market shifts. A divergence in forex, meaning a situation where price action and a technical indicator like the Relative Strength Index (RSI) or Moving Average Convergence Divergence (MACD) move in opposite directions, often signals a weakening trend. This discrepancy is a valuable tool in divergence chart trading, as it may indicate a possible reversal or continuation of the current trend.
There are two primary types of divergence in forex—regular and hidden. Regular divergence occurs when the price makes higher highs or lower lows while the indicator does the opposite, often signalling a reversal. Hidden divergence, on the other hand, happens when the price makes lower highs or higher lows while the indicator shows higher highs or lower lows, typically suggesting a continuation of the current trend.
Trading Rising and Falling Wedges
Rising and falling wedges are significant patterns in forex trading, often signalling potential trend reversals. A rising wedge, formed by converging upward trendlines, often indicates a bearish reversal if it appears in an uptrend. Conversely, a falling wedge, characterised by converging downward trendlines, typically reflects a bullish reversal if it occurs in a downtrend.
Traders often look for a breakout from these patterns as a signal to enter trades. For rising wedges, a downward breakout can be seen as a sell signal, while an upward breakout from a falling wedge is often interpreted as a buy signal. When combined with divergences, this chart pattern can add confirmation and precede strong movements.
Best Practices for Trading Divergences
Trading divergence patterns in forex requires a keen eye for detail and a disciplined, holistic approach. Here are key practices for effective trading:
- Comprehensive Analysis: Before trading on divergence and wedges, be sure to analyse overall market conditions.
- Selecting the Right Indicator: Choose a forex divergence indicator that suits your trading style. Common choices include RSI, MACD, and Stochastic.
- Confirmation Is Key: It’s best to watch for additional confirmation from price action or other technical tools before entering a trade.
- Risk Management: Traders always set stop-loss orders to manage risk effectively. Divergence trading isn't foolproof; protecting your capital is crucial.
- Patience in Entry and Exit: Be patient as the divergence develops and confirm with your chosen indicators before entering or exiting a trade.
Strategy 1: RSI and Wedge Divergence
Traders focus on regular divergence patterns when the RSI is above 70 (overbought) or below 30 (oversold), combined with a rising or falling wedge pattern. The strategy hinges on identifying highs or lows within these RSI extremes. It's not crucial if the RSI remains consistently overbought or oversold, or if it fluctuates in and out of these zones.
Entry
- Traders may observe a regular divergence where both the price highs/lows and RSI readings are above 70 or below 30.
- After the formation of a lower high (in an overbought zone) or a higher low (in an oversold zone) in the RSI, traders typically watch as the RSI crosses back below 70 or above 30. This is accompanied by a breakout from a rising or falling wedge, acting as a potential signal to enter.
Stop Loss
- Stop losses might be set just beyond the high or low of the wedge.
Take Profit
- Profit targets may be established at suitable support/resistance levels.
- Another potential approach is to exit when the RSI crosses back into the opposite overbought/oversold territory.
Strategy 2: MACD and Wedge Divergence
Regarded as one of the best divergence trading strategies, MACD divergence focuses on the discrepancy between price action and the MACD histogram. The strategy is particularly potent when combined with a rising or falling wedge pattern in price.
Entry
- Traders typically observe for the MACD histogram to diverge from the price. This divergence manifests as the price reaching new highs or lows while the MACD histogram fails to do the same.
- The strategy involves waiting for the MACD signal line to cross over the MACD line in the direction of the anticipated reversal. This crossover should coincide with a breakout from the rising or falling wedge.
- After these conditions are met, traders may consider entering a trade in anticipation of a trend reversal.
Stop Loss
- Stop losses may be set beyond the high or low of the wedge, which may help traders manage risk by identifying a clear exit point if the anticipated reversal does not materialise.
Take Profit
- Profit targets might be established at nearby support or resistance levels, allowing traders to capitalise on the expected move while managing potential downside.
Strategy 3: Stochastic and Wedge Divergence
Stochastic divergence is a key technique for divergence day trading in forex, especially useful for identifying potential trend reversals. This strategy typically employs the Stochastic Oscillator with settings of 14, 3, 3.
Entry
- Traders may look for divergence scenarios where the Stochastic readings are above 80 or below 20, mirroring the RSI approach.
- This divergence is observed in conjunction with price action, forming a rising or falling wedge.
- Entry may be considered following a breakout from the wedge, which signals a potential shift in market direction.
Stop Loss
- Setting stop losses just beyond the high or low of the wedge might be an effective approach.
Take Profit
- Profit targets may be set at key support/resistance levels.
The Bottom Line
Divergence trading, coupled with the analysis of rising and falling wedges, offers a comprehensive approach to navigating the forex market. By integrating the discussed strategies with sound risk management and market analysis, traders may potentially enhance their ability to make informed decisions in the dynamic world of forex.
This article represents the opinion of the Companies operating under the FXOpen brand only. It is not to be construed as an offer, solicitation, or recommendation with respect to products and services provided by the Companies operating under the FXOpen brand, nor is it to be considered financial advice.
Wedge

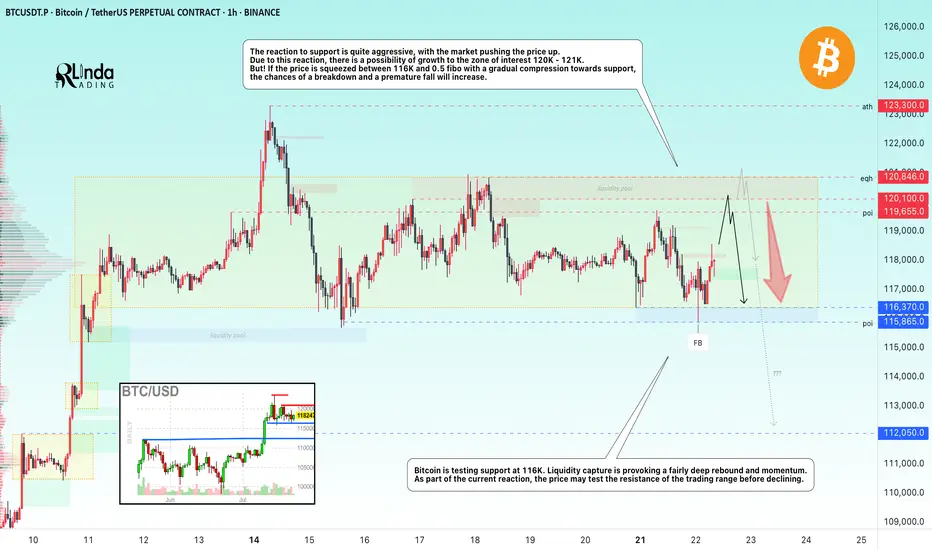
BITCOIN → Consolidation and compression to 116K. Correction?BINANCE:BTCUSDT.P continues to consolidate, with the price testing support at 116K, leaving behind the zone of interest at 120K-121K. Are there any chances for further growth?
(Alternative scenario (if growth to 120K does not occur))
Fundamentally, there is nothing particularly new, and the hype surrounding Bitcoin is stagnating. Technically, on D1, consolidation is underway with pressure from bears against the backdrop of an outflow of funds into altcoins. However, the dominance index is starting to rise, which could trigger some correction in the market. The price on the working timeframe, without updating local highs, is testing lows, and the latest retest of the liquidity zone is provoking a fairly aggressive reaction that could bring the price to retest the zone of interest at 120K-121K.
But! If the price is squeezed between 116K and 0.5 Fib with a gradual squeeze towards support, the chances of a breakdown and a premature fall will increase.
Support levels: 116370, 115860
Resistance levels: 119650, 120100
Technically, the market needs a breather or correction, which is generally a sign of health. The nuance with Bitcoin is that below 115860 there is no support until 112K, and if the market breaks the current consolidation boundary, the further correction could be quite deep. In the current situation, I do not yet see any drivers or reasons for another rally.
Best regards, R. Linda!
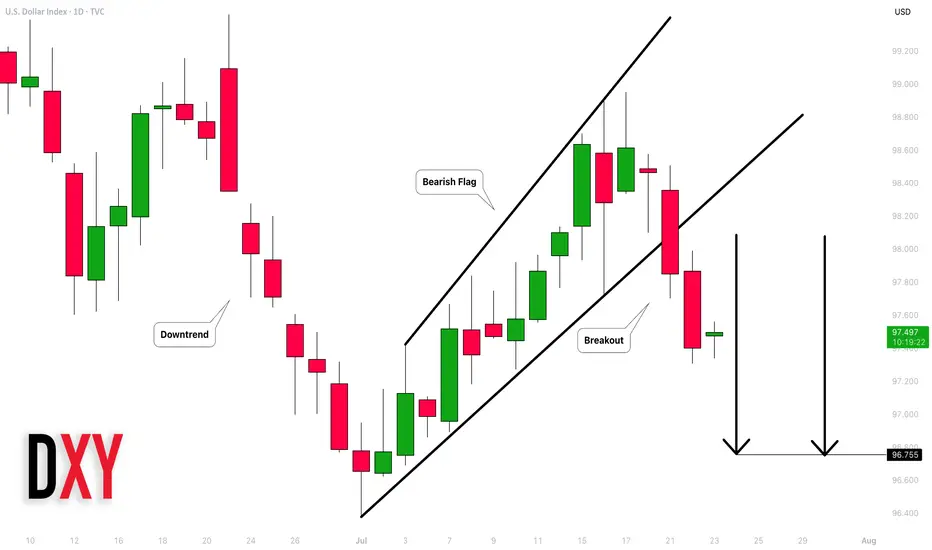
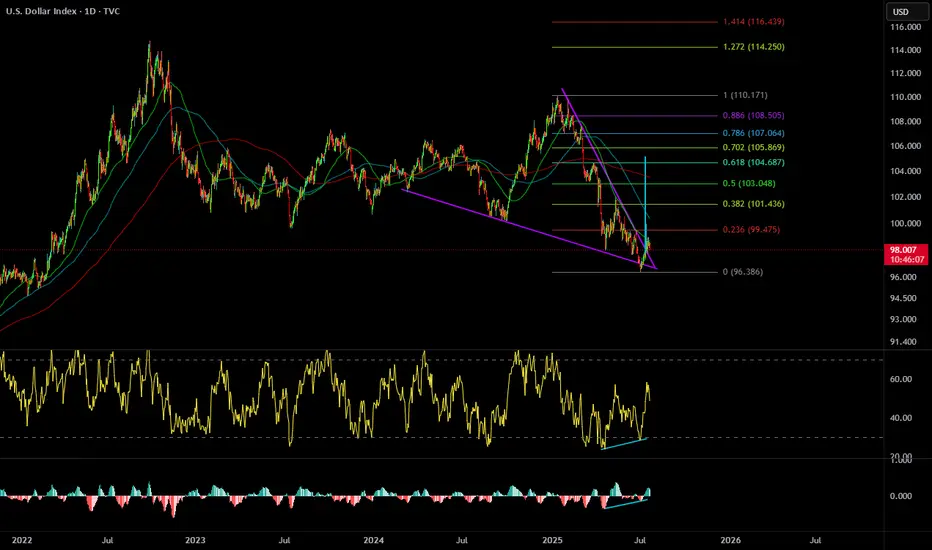
Dollar Index (DXY): Strong Bearish Price Action
Dollar Index broke and closed below a support line
of a bullish flag pattern on a daily.
Because the market is trading in a bearish trend,
this violation provides a strong bearish signal.
I expect a bearish movement to 96.75
❤️Please, support my work with like, thank you!❤️
Market Breadth Flashes Warning, but S&P 500 Still Holds SteadyThe S&P 500 continues its slightly positive movement. However, the momentum has been slowing, forming a long, wedge-like pattern. These long wedges have been a recurring feature in the stock market for years. From the monthly timeframe to the 1-hour chart, the market often forms wedges.
Wedge formations tend to break to the downside but can persist for a long time before doing so. The S&P 500 typically makes a sharp correction selloff, then recovers in a "V" shape, followed by the formation of another wedge. This pattern appears to be repeating once again. Still, there are some negative signals that traders should be aware of:
1- The impact of tariffs on growth remains a major unknown. Most tariff deals have not been finalized yet. While the Japan agreement is a positive step, negotiations with the EU will be more significant.
2- Many earnings reports will be released in the coming weeks, potentially shaping market sentiment. These earnings will reflect some of the tariff effects. AI and tech remain the key market drivers, so their results will be especially important.
3- Some breadth indicators are showing early warning signs. One of the most useful is the "percentage of stocks above the 200-day moving average." This metric shows whether the market is broadly participating in the rally or being driven by a few large-cap names. Typically, when the market weakens, traders rotate into mega caps. The rounded numbers below shows the weakness:
March 2024 Top: 5250 - Percantege Above 200 MA: 85%
July 2024 Top: 5675 - Percantege Above 200 MA: 80%
December 2024 Top: 6100 - Percantege Above 200 MA: 74%
July 2025 Current: 6309 - Percantege Above 200 MA: 66%
This shows that fewer and fewer stocks are managing to stay above their 200-day moving average while S&P making new highs. This is not an immediate red flag, but the weakening is apparent.
In summary, the slightly positive outlook remains intact for now and is expected to continue until the wedge breaks with some early warning signs. If that happens, a sharp selloff may follow, creating both selling and buying opportunities. In the short term, 6280 is the immediate support level to watch.

Milking USDCHF again! This time => BULLISH!Hello TradingView Family / Fellow Traders. This is Richard, also known as theSignalyst.
📈USDCHF has been overall bullish as a correction phase, trading within the rising wedge marked in blue.
This week, USDCHF is retesting the lower bound of the wedge pattern.
Moreover, the green zone is a strong structure.
🏹 Thus, the highlighted blue circle is a strong area to look for buy setups as it is the intersection of the lower blue trendline and green support.
📚 As per my trading style:
As #USDCHF approaches the blue circle zone, I will be looking for bullish reversal setups (like a double bottom pattern, trendline break , and so on...)
📚 Always follow your trading plan regarding entry, risk management, and trade management.
Good luck!
All Strategies Are Good; If Managed Properly!
~Richard Nasr
Disclosure: I am part of Trade Nation's Influencer program and receive a monthly fee for using their TradingView charts in my analysis.

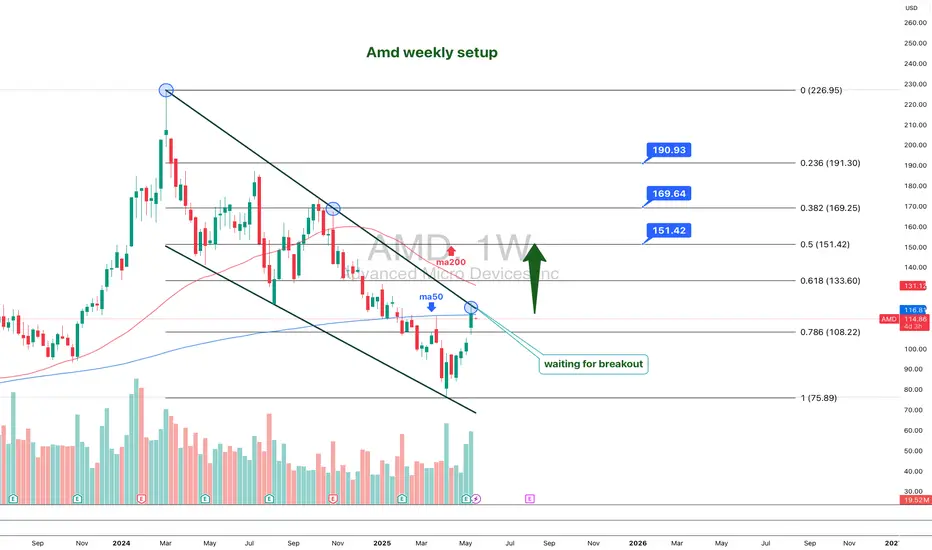
AMD 1W: If Not Now — Then When?The weekly chart of AMD looks like it’s holding its breath: a well-defined falling wedge, double bottom support, and price pressing right against long-term trendline resistance. Everything’s in place — now it just needs to break and run, preferably without tripping over nearby Fibonacci levels.
The stock is trading around $114 and attempting to hold above the 50-week MA. Just ahead is the 200-week MA (~131) — not only a technical hurdle but also a psychological pivot. A move above it could reignite talk of $150+ targets.
The wedge has been narrowing since late 2024. After repeated bounces off support, price has returned to the top of the pattern. A confirmed weekly close above the wedge could trigger a real breakout. Without that — it risks yet another scripted pullback.
Key Fibonacci levels:
0.618 — $133.60
0.5 — $151.42
0.382 — $169.25
0.236 — $191.30
0.0 — $226.95 (all-time high)
The roadmap looks clean — but only if volume follows through. There are signs of quiet accumulation at the bottom, but no explosive buying just yet.
Fundamentals:
AMD delivered solid Q1 results: revenue is growing, EPS beat expectations, and margins are holding. More importantly, the company launched a new $6 billion stock buyback program — showing clear internal confidence in its long-term trajectory.
There’s also a strategic AI partnership underway with a Middle Eastern tech group. This move positions AMD to challenge not just for GPU market share, but for future AI infrastructure dominance — long game stuff.
Analyst sentiment has turned bullish again, with new price targets in the $130–150 range. All of this makes the current chart structure more than just technical noise — it’s backed by strong tailwinds.
XAUUSD - Falling Wedge Parallel ChannelGold Volatility being more. Banks increasing the gold inventories, may surge to new highs. Sharing Some idea it may go either way some big rally or big correction.
This chart is only for educational purpose, Do your own study before taking any trades
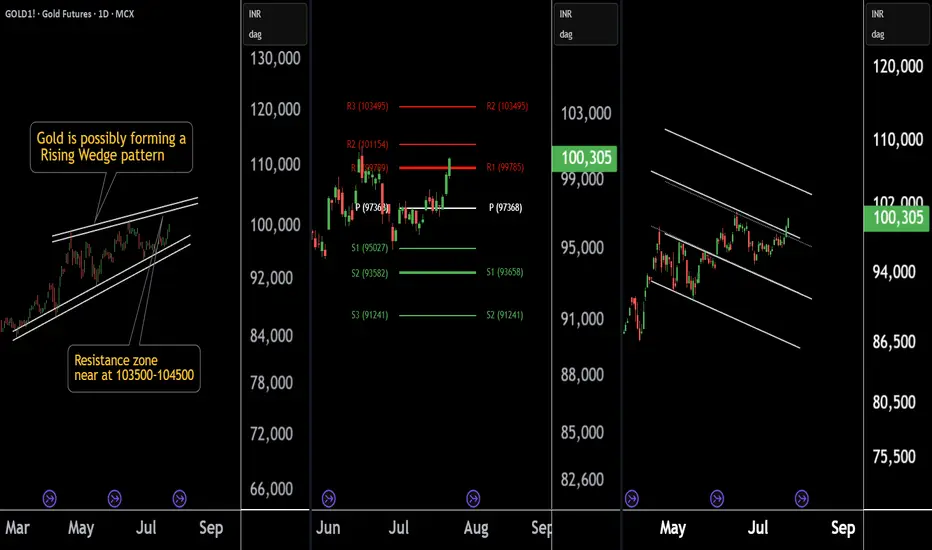
Gold at a Crossroad: Long or Short? Key Levels in FocusThere are three chart of Gold .
Gold1! is forming a Rising Wedge pattern, with resistance positioned between 103500-104000 levels.
Gold1! is facing Pivot Point resistance around the 103500 level, indicating potential supply pressure.
Gold1! is approaching the parallel channel resistance, and the upside move is nearly complete in percentage terms, with resistance around 103800-104000.
if this level sustain then we may see first of all higher prices then again fall in gold1!
Thank You !!
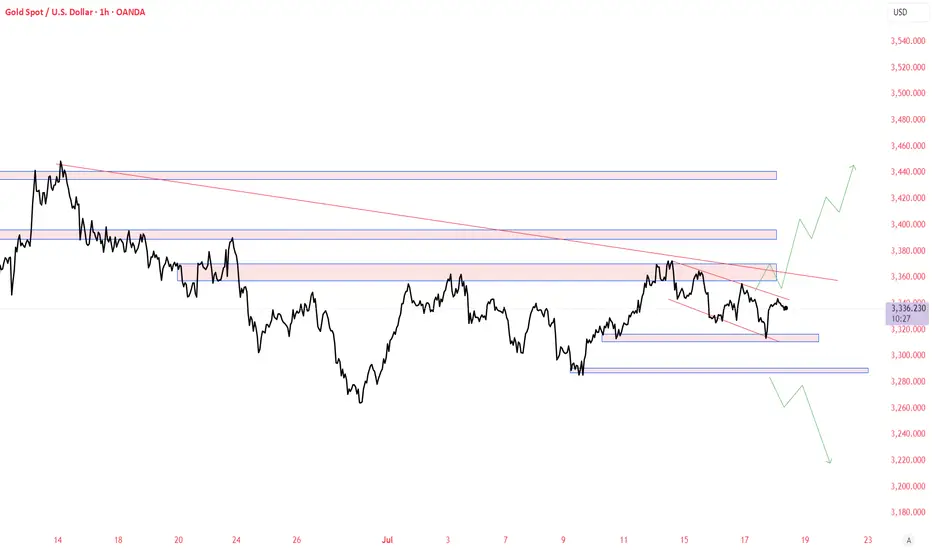
Gold Bulls Loading Up – Our Short Squeeze Trigger is Set!🚨 Gold Bulls Loading Up – Our Short Squeeze Trigger is Set!
We’re flipping the script on COMEX_MINI:MGC1! After a prolonged downtrend and textbook wedge compression, our breakout long is LIVE – but not without trapping the late shorts first.
💥 Entry: $3,312.1
🛑 Stop: $3,288.4
🎯 Target: $3,458.9
🧮 Risk/Reward: 6.19
Price just bounced at the retest of the wedge apex, and volume is confirming the move. If this holds, we’re riding momentum all the way up – and letting short pressure fuel the breakout.
📈 Trendline breached.
⏳ Time compression converging.
⚠️ If you’re still short, watch your stops!

Amazon Wave Analysis – 21 July 2025
- Amazon broke resistance zone
- Likely to rise to resistance 240.00
Amazon recently broke the resistance zone between the resistance level 227.30 (top of the previous impulse wave i) and the resistance trendline of the daily Rising Wedge from May.
The breakout of this resistance zone accelerated the active impulse wave 5 of the intermediate impulse sequence (C) from April.
Given the strength of the active impulse wave 5, Amazon can be expected to rise further to the next resistance level 240.00 (former multi-month high from February and the target price for the completion of the active impulse wave iii).

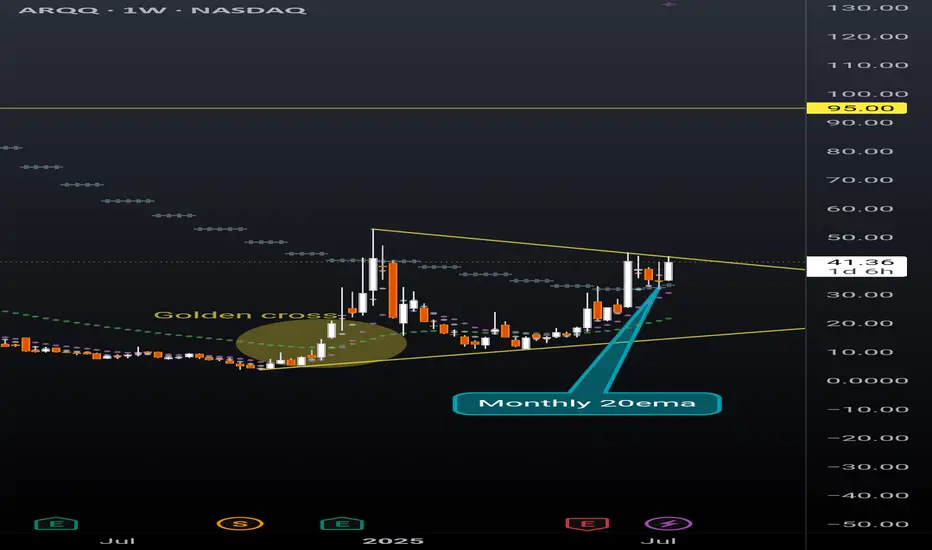
ARQQ weekly pennantBeautiful weekly pennant on ARQQ weekly timeframe. This chart is coiling nicely for a continuation. Still early in the process of reaching breakout but given the recent momentum in this sector a premature break to the upside can happen at any moment.
The ticker is currently sitting above the monthly 20ema (overlayed on this weekly chart), and just had a strong bounce off the daily 20ema (overlayed on this weekly chart). Golden cross is also highlighted that occurred in December 2024 with the daily 50ema retracing back to the daily 200ema and then continuing the uptrend earlier this spring.
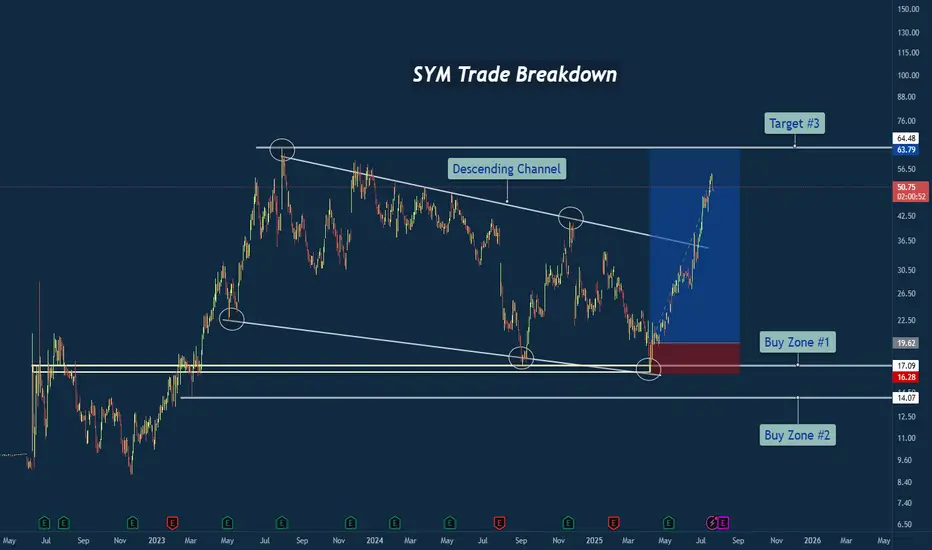
SYM Trade Breakdown – Robotics Meets Smart Technical's🧪 Company: Symbotic Inc. ( NASDAQ:SYM )
🗓️ Entry: April–May 2025
🧠 Trade Type: Swing / Breakout Reversal
🎯 Entry Zone: $16.28–$17.09
⛔ Stop Loss: Below $14.00
🎯 Target Zone: $50–$64+
📈 Status: Strong Rally in Motion
📊 Why This Trade Setup Stood Out
✅ Macro Falling Wedge Reversal
After nearly two years of compression inside a falling wedge, price finally tapped multi-year structural support and fired off with strength. This wasn’t just a bottom — it was a structural inflection point.
✅ Triple Tap at Demand Zone
Symbotic tapped the ~$17 area multiple times, signaling strong accumulation. Volume and momentum picked up with each successive test, showing institutional interest.
✅ Clean Break of Trendline
Price broke through the falling resistance trendline decisively, confirming the bullish reversal and unleashing stored energy from months of sideways structure.
🔍 Company Narrative Backdrop
Symbotic Inc. isn't just any tech stock. It’s at the forefront of automation and AI-powered supply chain solutions, with real-world robotics deployed in major retail warehouses. That kind of secular growth narrative adds rocket fuel to technical setups like this — especially during AI adoption surges.
Founded in 2020, Symbotic has quickly become a rising name in logistics and warehouse automation, serving the U.S. and Canadian markets. With robotics in demand and investors chasing future-ready tech, the price action aligned perfectly with the macro theme.
🧠 Lessons from the Trade
⚡ Compression = Expansion: Wedges like this build pressure. When they break, the moves are violent.
🧱 Structure Never Lies: The $17 zone was no accident — it was respected over and over.
🤖 Tech Narrative Boosts Confidence: Trading is easier when the fundamentals align with the technicals.
💬 What’s Next for SYM?
If price holds above the wedge and clears the $64 resistance, we could be looking at new all-time highs in the next cycle. Watching for consolidation and retests as opportunity zones.
#SYM #Symbotic #Robotics #Automation #AIStocks #BreakoutTrade #FallingWedge #SwingTrade #TechnicalAnalysis #TradingView #TradeRecap #SupplyChainTech
USD-CHF Bearish Wedge! Sell!
Hello,Traders!
USD-CHF is trading in a
Downtrend and has formed
A bearish wedge pattern
So IF we see a breakout
Then we a further bearish
Continuation will be expected
Sell!
Comment and subscribe to help us grow!
Check out other forecasts below too!
Disclosure: I am part of Trade Nation's Influencer program and receive a monthly fee for using their TradingView charts in my analysis.

GOLD - Price can rise to resistance line of wedgeHi guys, this is my overview for XAUUSD, feel free to check it and write your feedback in comments👊
The price has been trading within a large ascending wedge for an extended period.
The asset found significant support near the lower trendline of this formation, specifically in the 3205 - 3187 price area.
From that support, the price initiated a sustained upward movement back towards the upper parts of the structure.
Currently, XAU is facing a key horizontal resistance zone located between 3375 and 3390 points.
The price is actively attempting to break through this area, which has historically served as a critical pivot point.
I expect that once the price firmly breaks and consolidates above this resistance, it will continue its growth towards the upper boundary of the wedge, targeting the $3475 level.
If this post is useful to you, you can support me with like/boost and advice in comments❤️
Disclaimer: As part of ThinkMarkets’ Influencer Program, I am sponsored to share and publish their charts in my analysis.

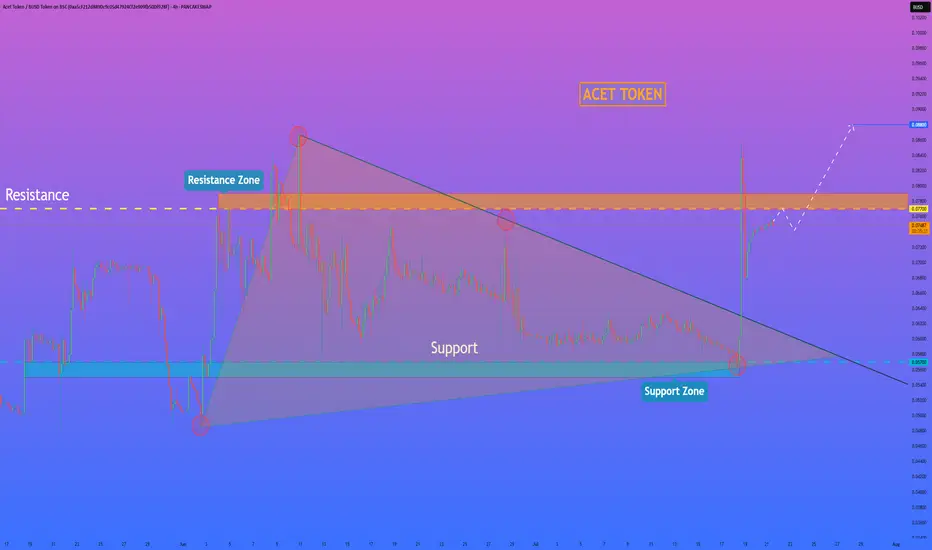
HelenP. I Acet Token may make correction and then continue growHi folks today I'm prepared for you Act Token analytics. If we look at the chart, we can observe a clear technical picture. For a considerable amount of time, the price was tightly compressed inside a large downward wedge, defined by a robust support zone at 0.0570 - 0.0550 and a descending trend line that put consistent pressure on the price. Such long consolidation periods often precede a powerful expansion. Recently, we have witnessed a decisive breakout from this wedge, confirmed by a strong impulse candle. This move signals a clear shift in market sentiment from neutral to bullish and invalidates the prior constraining structure. I believe that the momentum from this breakout will be sufficient to challenge the next major obstacle: the horizontal resistance zone at 0.0770 - 0.0790. This is a critical level to watch, as it has previously rejected price advances. My scenario implies that after potentially a small, healthy correction or retest, the price will continue its upward movement. A successful break above this critical area would confirm the newfound strength of the buyers and open up a clear path for further appreciation. For this reason, my primary goal, the logical target for this move, is set at the 0.0880 level. If you like my analytics you may support me with your like/comment ❤️
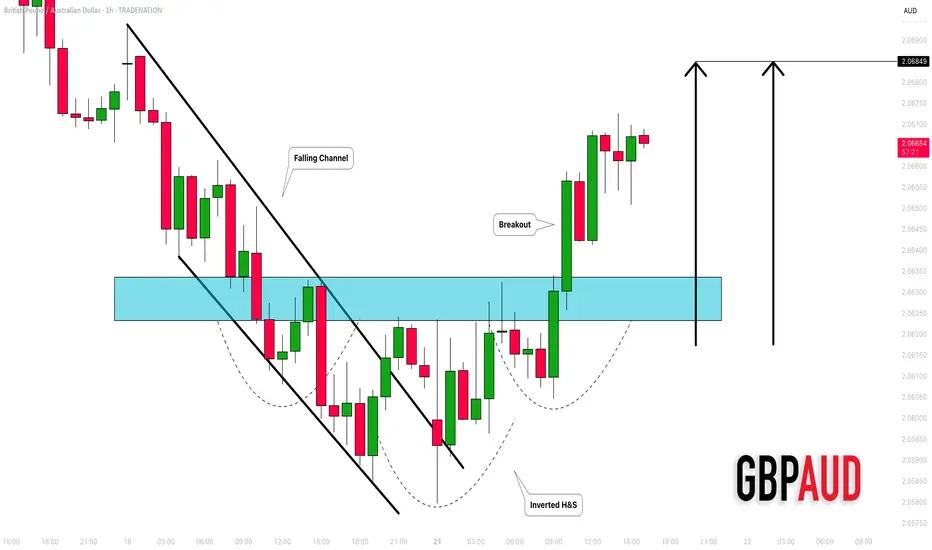
GBPAUD: Bullish Movement Continues 🇬🇧🇦🇺
GBPAUD is going to rise more, following a confirmed intraday bullish reversal:
first, the price violated a resistance line of a falling channel.
It started to consolidate within an inverted head & shoulders pattern then.
Its neckline violation is another strong bullish signal.
Next resistance - 2.0685
❤️Please, support my work with like, thank you!❤️
I am part of Trade Nation's Influencer program and receive a monthly fee for using their TradingView charts in my analysis.
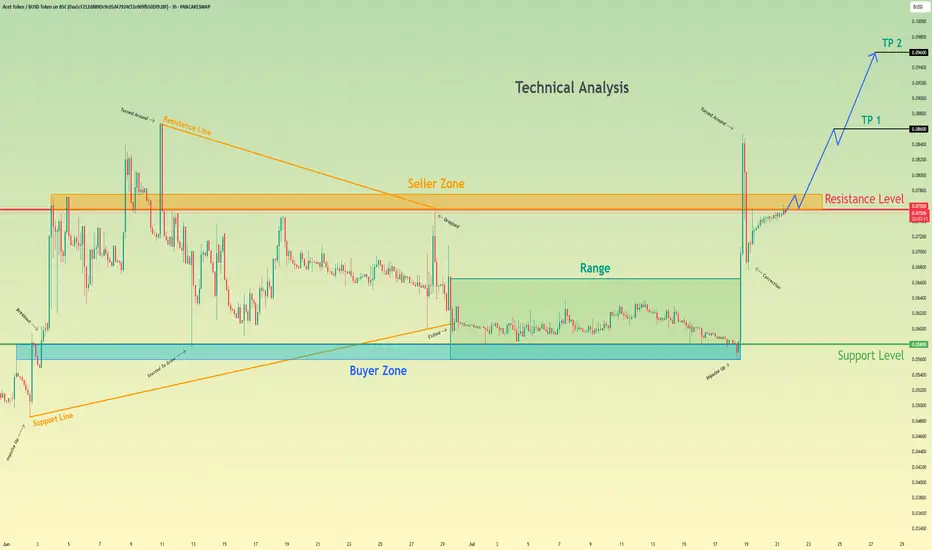
Acet Token will break resistance level and continue to move upHello traders, I want share with you my opinion about Acet Token. Looking at the recent price action, we can see a clear narrative unfolding. The asset initially formed a large wedge pattern, experiencing a trend reversal that led to a breakdown and a period of prolonged consolidation within a defined range between the buyer zone around 0.0580 and the upper boundary. Recently, however, the market showed a strong impulse, breaking out of this range and decisively moving upwards. Currently, the price of act is testing the key resistance level at 0.0755, an area historically defined as a seller zone. The hypothesis is that after this powerful impulse, the asset will manage to break and hold above this resistance. A successful retest of the 0.0755 level would likely signal a continuation of the uptrend, paving the way towards our specified take-profit targets. The first goal is set at TP 1 at 0.0860, with a further extension to TP 2 at 0.0960, capitalizing on the anticipated bullish momentum. Please share this idea with your friends and click Boost 🚀
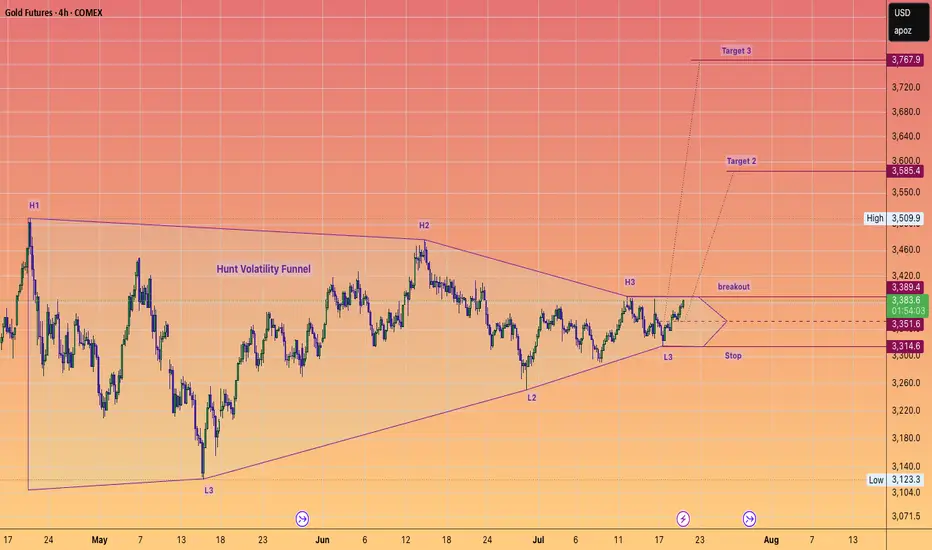
Trade Alert! GOLD to $3800 SOON.#HuntVolatilityFunnel setup which is about to trigger to the upside.
This setup should take gold to or very close to $4K IMHO
#GC
#GOLD
#SILVER
#METALS
Dollar $DXY Bullish WedgePretty clean falling wedge with divergence. Aligns with a pullback to come on BTC and Stocks.
A move back to 104 area would do some damage to risk on assets.
Follow for updates.
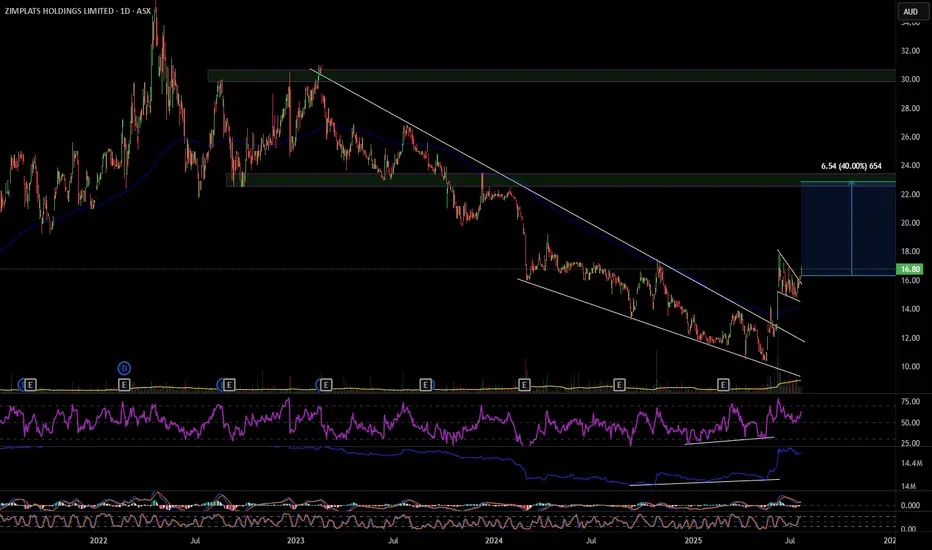
ZIM 40% move up
ZIM has broken out of a descending wedge with bullish RSI and OBV divergence, also multiple divergences on smaller time frames. On the hourly it's had a pull back and formed a bull flag that it has also broken out of. ZIM looks to have formed a change of structure forming higher highs and higher lows, my first target will be $22.90 a move of 40%. Definitely one to consider. Good luck and happy trading 🍀
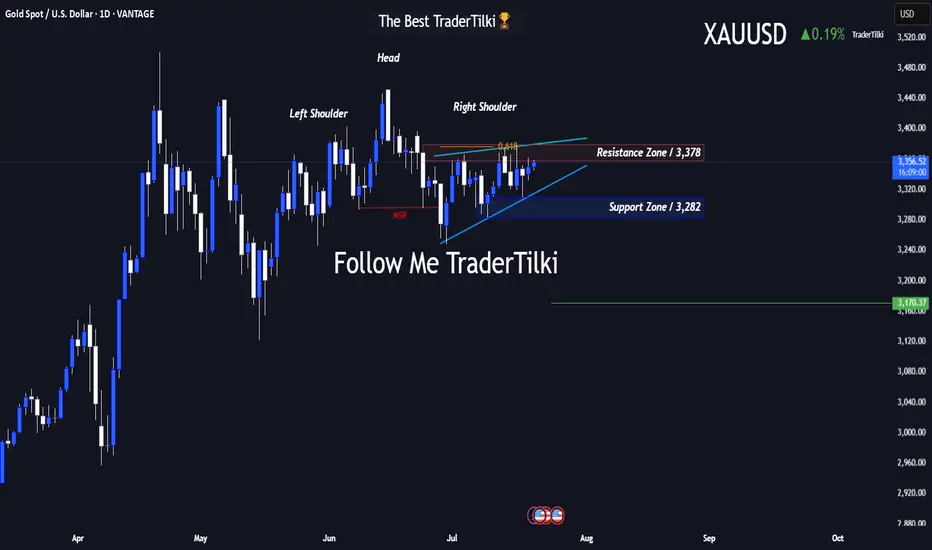
GOLD-XAUUSD vs. The FED: Technicals or Fundamentals?Good Morning Traders,
Let’s break down what gold is showing us on the 1-day chart:
- **Resistance:** 3,378
- **Support:** 3,282
- There’s a noticeable **head and shoulders pattern** on the chart. Under normal conditions, gold’s target sits at **3,170**.
Gold is highly sensitive to fundamental factors. Sudden war news or events like last week’s rumors about Trump firing the Fed Chair can trigger serious volatility.
That’s why I always combine **technical and fundamental analysis** in my approach.
For gold to reach the 3,170 target, the **3,282 support level must first be broken**. Since that hasn't happened yet, we can't confirm a bearish move—fundamentals play a key role here.
Keep in mind: this is a **swing trade** setup based on a 1-day chart. Reaching the target could take time.
I want to sincerely thank everyone who’s been supporting my analyses with likes—your support is
my biggest source of motivation when it comes to sharing content.
Much love and respect to you all.💛
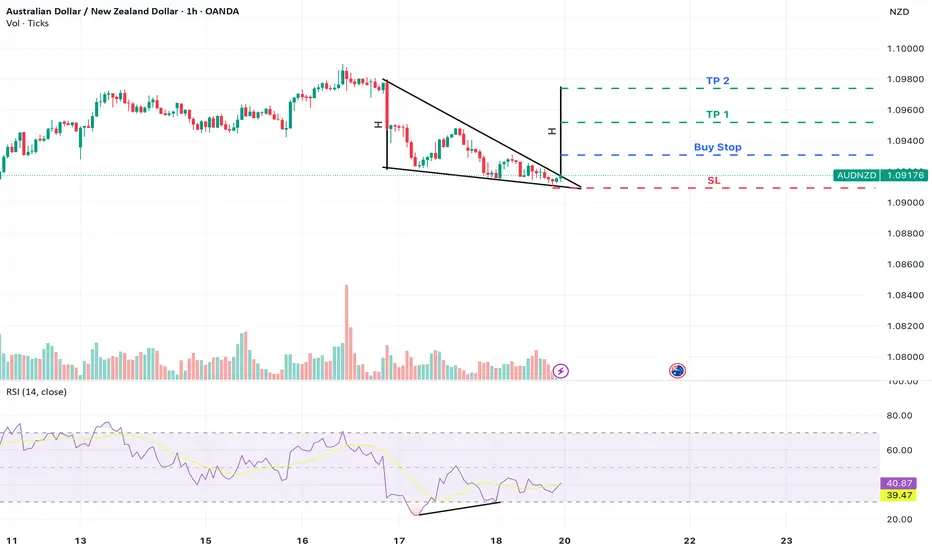
AUD/NZD – Falling Wedge Breakout with Bullish DivergenceAUD/NZD is currently forming a falling wedge pattern on the 1-hour timeframe, a structure typically associated with bullish reversals. Notably, bullish divergence on the RSI is developing while price continues to print lower lows, RSI is making higher lows, indicating weakening selling momentum.
Trade Setup:
Buy Stop Entry: 1.09309 (above recent Lower High — confirmation of breakout)
Stop Loss: 1.09094 (recent Lower Low )
Take Profit 1 : 1.09520
Take Profit 2 : 1.09740 (full pattern projection target)
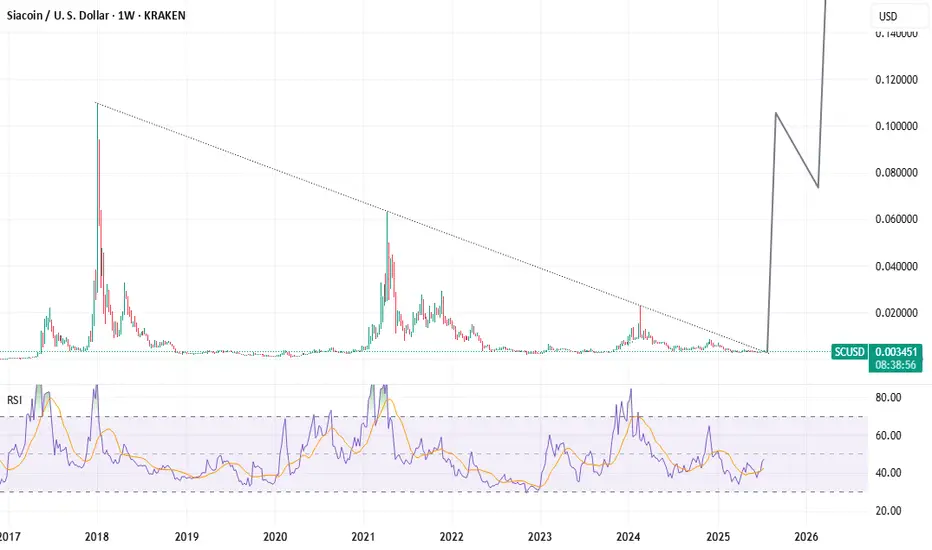
8-Year Breakout Confirmed! SIACOIN Hardfork Activated!Breaking out from a near-identical structure to XRP’s Q3 2024 move, Siacoin (SC) is poised to moon.
Once a top 20 crypto, SC has just closed outside an 8-year falling wedge on the weekly—marking the end of nearly a decade of compression.
But this isn’t just a pattern breakout—it coincides with the biggest technical overhaul in Sia’s history, rolled out on the 10-year anniversary of the token’s launch. Some of the new features:
- Full protocol overhaul — complete rewrite in Go (from siad to hostd/renterd)
- Faster performance — significantly improved upload/download speeds
- Modular architecture — easier dev integration, plug-and-play infrastructure
- Efficient storage contracts — new ephemeral account system for faster payments
- Lower gas costs — more cost-effective microtransactions for storage users
- Better redundancy & reliability — improved renter-host coordination
- Stronger developer tools — RESTful APIs + CLI tools for building on Sia
V2 basically turned Sia from a clunky decentralized Dropbox into a scalable, developer-friendly Web3 storage protocol, just in time for the AI + data sovereignty wave.
Still buried in market cap rankings, SC has the potential to quietly reclaim a top 30 spot as the world rediscovers decentralized storage. This isn’t a meme coin—it’s a battle-tested, utility-rich project with real infrastructure, real adoption potential, and serious upside.
#Siacoin #SC #Sia