ETH is trying to get back into the falling wedge !Hello Traders 🐺,
First of all, I want to thank you all for your incredible support recently! My last idea about ETH is going absolutely viral , and now I’ve decided to share a quick update on the short-term price movement.
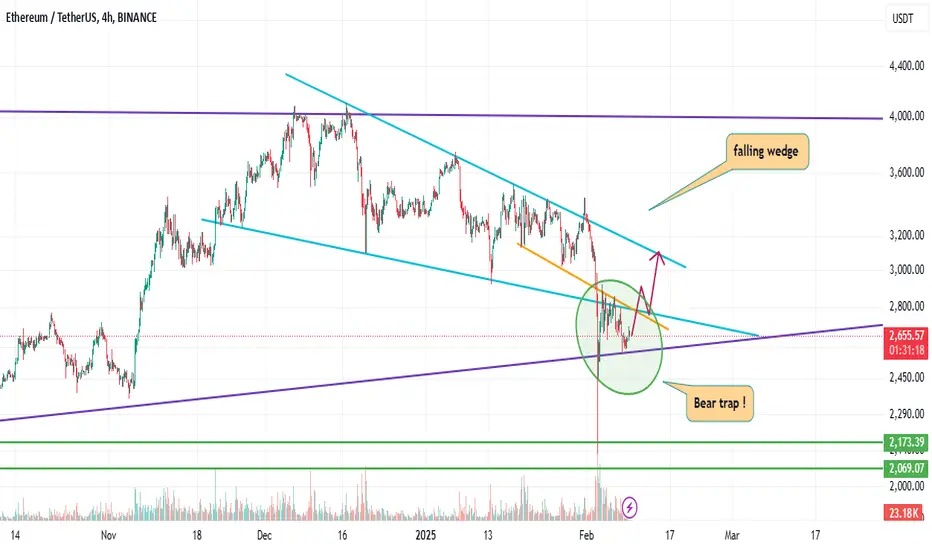
As you can see in the picture above, ETH is currently below an orange resistance line and above a key support level , which, in my personal humble opinion, could be very bullish for the following reasons:
1️⃣ A falling wedge is usually considered a bullish pattern , but what makes it extremely bullish ? When the price breaks below the falling wedge’s support line and comes back into it with a huge wick to the downside.
💡 But why is that bullish?
Because it can be considered a bear trap , shaking out weak hands, and showing us that the bulls are here and ready to take control. This could result in a strong move to the upside.
📈 As you might know, the price target for a falling wedge is typically the top of the wedge , which in this case is around $4,000 .
2️⃣ The second reason is very simple , and we already discussed it in my previous idea about BTC.D (you can find the link below this idea). So, make sure to read it carefully because the overall condition of altcoins depends on it.
📌 Also, I plan to publish a new update about BTC.D in the near future , so make sure to follow me for upcoming updates!
( this is not a financial advice ! )
Wedge
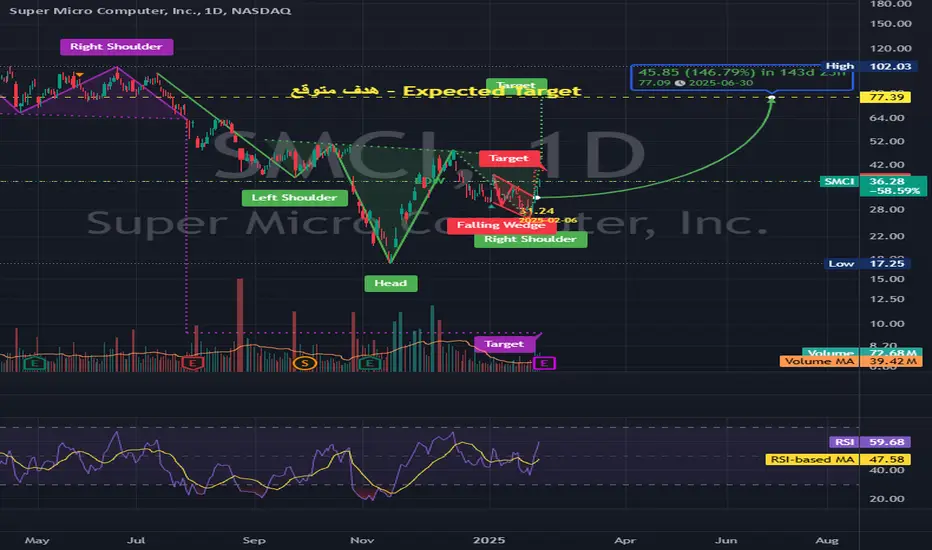
SMCI - Super Micro Computer, Inc.Super Micro Computer, Inc. engages in the distribution and manufacture of information technology solutions and other computer products. Its products include twin solutions, MP servers, GPU and coprocessor, MicroCloud, AMD solutions, power supplies, SuperServer, storage, motherboards, chassis, super workstations, accessories, SuperRack and server management products. The company was founded by Charles Liang, Yih-Shyan Liaw, Sara Liu, and Chiu-Chu Liu Liang in September 1993 and is headquartered in San Jose, CA.
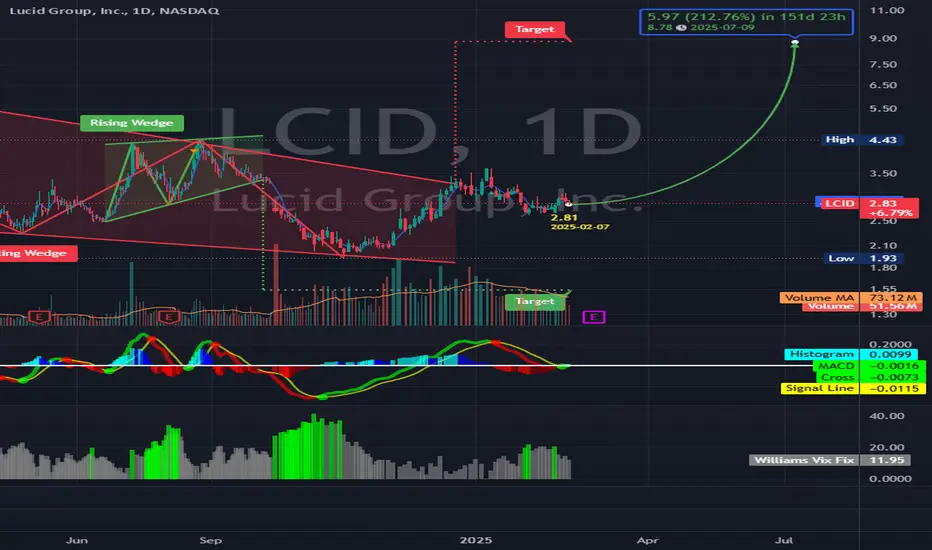
Lucid Group, Inc.Lucid Group, Inc. manufactures electric vehicles. It designs, develops, and builds energy storage systems for electric vehicles and supplies automakers with the battery pack system needed to power hybrid, plug-in, and electric vehicles. The company was founded in December 2007 and is headquartered in Newark, CA.
BTCUSDT (BITCOIN) LONG MAPPING IS HERE Hello Guy's Welcome To Another Day Of TRADING
Here we are mapping chart of BTCUSDT ( BITCOIN ) in 4-Hour TF
This chart shows Bitcoin’s price forming a falling wedge, which is usually a sign that the price might go up soon.
Breakout Signal: The price is slowly moving out of the wedge, which is a good sign for a possible upward move.
Next Target: If the price continues to rise, it may reach the $104,000–$106,000 .
Risk Factor: If Bitcoin doesn’t hold above the breakout level, it could drop to $92,000 or even $88,000.
In simple terms: Bitcoin might be ready to move up, but it needs to stay above this level to confirm the breakout.

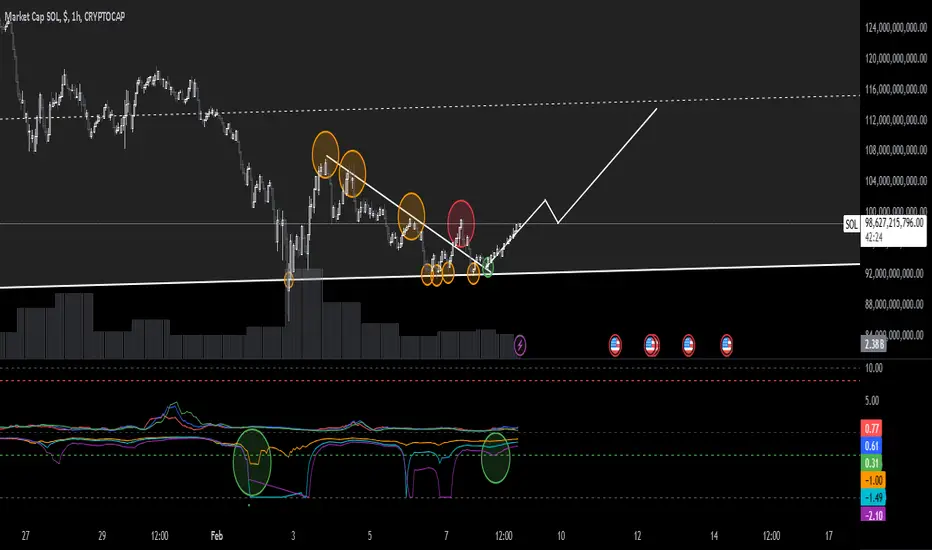
$SOL longCRYPTOCAP:SOL will move to its next point of resistance, in around 13%. If it breaks that we'll go up another 17%. Falling wedge has been formed. It's gonna take off.
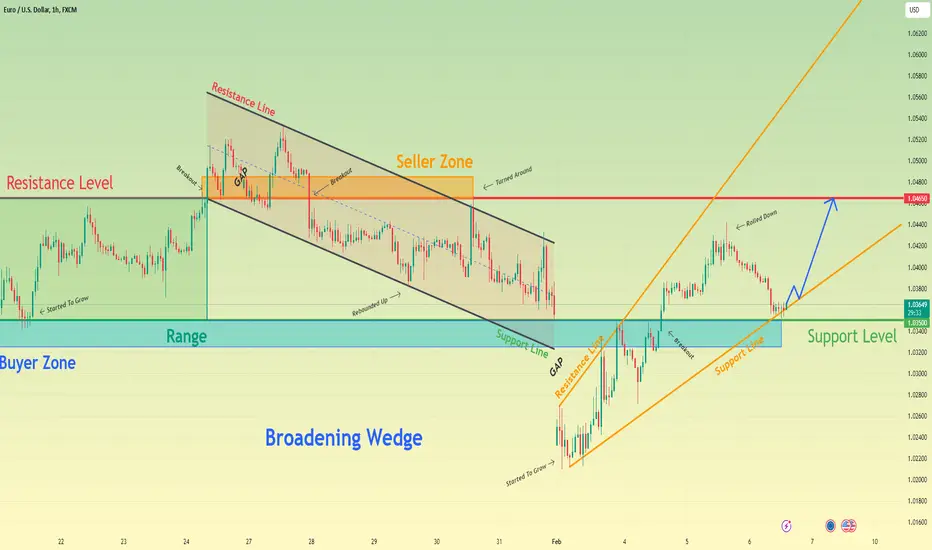
Euro can rise to resistance level inside broadening wedgeHello traders, I want share with you my opinion about Euro. By observing the chart, we can see that the price traded inside a range, where it rebounded from the support level and started to grow to the resistance level. When the Euro reached a resistance level, it broke it, thereby exiting from the range and entering to seller zone. Then the price rose a little more, made a first gap, and then started to decline inside the downward channel. In the channel, the price broke the 1.0465 level and fell to the support line, which continued to fall near and later rebounded up to the seller zone. When it reached this area, the price at once backed up to the channel and continued to fall next. But soon, the Euro made a strong second gap, thereby exiting from the channel and declining below a support level, breaking it. Next, the Euro started to grow inside a broadening wedge, where it rose to the buyer zone and soon broke the support level one more time. After this, the price continued to grow, until it reached 1.0445 points and then started to decline. Now price trades near the support line of the broadening wedge and I think that the Euro can rebound from this line and start to grow to the 1.0465 resistance level. That's why I set my TP at this level. Please share this idea with your friends and click Boost 🚀
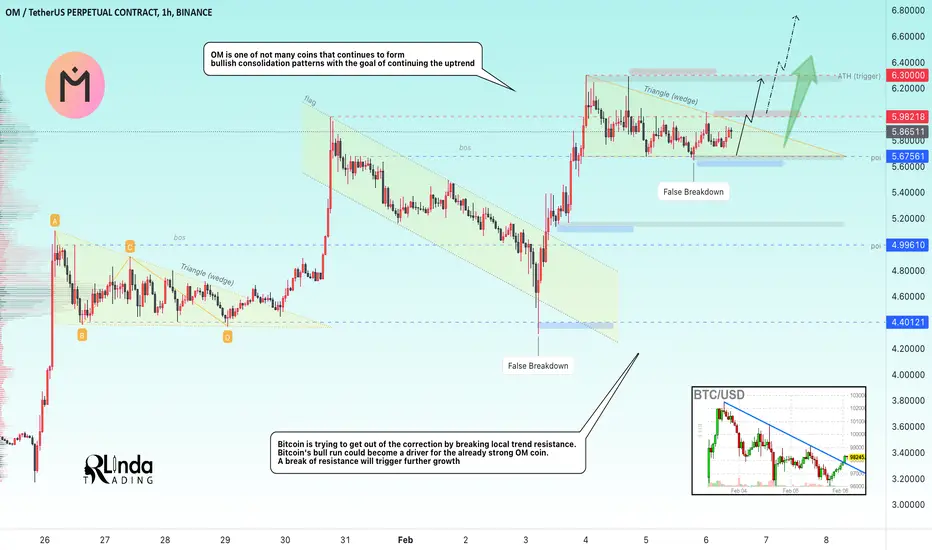
OMUSDT → Consolidation in a triangle before the rallyBINANCE:OMUSDT is a paranormal coin in this case, as it is one of the few projects that shows bullish dynamics while all altcoins are finding bottom after bottom.
Perhaps the situation partly depends on BINANCE:BTCUSD . If it starts to fall even deeper, nothing and no one will help here. But locally bitcoin is forming a resistance breakout and if the bulls hold this trend, the BINANCE:OMUSDT.P coin may have a bullish driver that can support the bullish movement.
At the moment, the focus is on the triangle (wedge) resistance and the base of the 5.6756 pattern. Two bullish scenarios should be considered: Growth after a resistance breakout or growth after a false breakdown of support.
Resistance levels: 5.9821, 6.30
Support levels: 5.75, 5.6756
At the moment, a consolidation within the triangle boundaries is being formed. But when the resistance is broken, the market may move to the realization phase and the impulse may be quite sharp. Ahead, beyond 6.3, there is no resistance...
Regards R. Linda!
Gold's Uptrend Nearing Key Reversal Zone—Time to Sell?Gold ( OANDA:XAUUSD ) is creating a new All-Time High(ATH) during these few days; finally, how far can gold continue this upward trend? What do you think?
Educational Note : From the point of view of Technical Analysis , when the asset is forming an All-Time High(ATH) and the previous history of the price is not around the price, the analysis becomes a little difficult, but we must be able to make the best use of the technical analysis tool.
----------------------------------------------------
Gold is entering the Potential Reversal Zone(PRZ) . Also, Gold is facing a Series of Resistance lines that can stop its increase .
From the point of view of Classical Technical Analysis , it seems that Gold is in the Ascending Broadening Wedge Pattern formation. Do you agree!?
Educational Note : An Ascending Broadening Wedge is a bearish technical pattern characterized by higher highs and higher lows that expand over time. It signals increasing volatility and weakening bullish momentum, often leading to a breakdown below support. Traders watch for a confirmed breakdown as a short-selling opportunity.
According to the theory of Elliott waves , Gold seems to be completing microwave 5 of the main wave 5 .
Also, we can see the Regular Divergence(RD-) between Consecutive Peaks.
I expect Gold to start falling after entering the PRZ and at least to the lower line of the wedge pattern and Support zone($2,800-$2,787) .
Note: If Gold breaks the Resistance lines and goes above $2,873, we should expect Gold to increase further.
Be sure to follow the updated ideas.
Gold Analyze ( XAUUSD ), 1-hour time frame.
Do not forget to put Stop loss for your positions (For every position you want to open).
Please follow your strategy; this is just my idea, and I will gladly see your ideas in this post.
Please do not forget the ✅' like '✅ button 🙏😊 & Share it with your friends; thanks, and Trade safe.

HelenP. I Gold can correct to the trend line, after rising moveHi folks today I'm prepared for you Gold analytics. A few days ago we can see how the price showed strong upward movement, but before this, Gold traded near support 2, which coincided with the support zone. Then it rebounded and rose to 2727 points and then made a correction even below support 2, but then it turned around and started to trades inside the wedge. Price fell to the trend line and at once rebounded up, breaking the 2nd support level, and continued to move up neat this line. So long it rose near this line, but on the fourth touch, Gold rebounded and reached 1st support level, which coincided with one more support zone. Then it made a correction to almost the trend line and then in a short time rose back to 1st support, broke it, and later exited from the wedge as well. Next, it made a retest and rebounded up to 2880 points. Now I expect that XAUUSD will make a correction movement to the trend line, which is located inside the support zone. That's why I set my goal at 2800 points, which coincides with them. If you like my analytics you may support me with your like/comment ❤️

BITCOIN - Price can little correct and then bounce up to $102600Hi guys, this is my overview for BTCUSDT, feel free to check it and write your feedback in comments👊
A few moments ago price reached resistance area and then started to decline inside wedge, breaking $107000 level.
Price fell to support line of wedge and then traded near $94000 level until it bounced up from support line again.
BTC rose to resistance line of wedge and then dropped back to support line, after which started to grow.
After this, price rose to resistance area, breaking $94000 level and exiting from wedge, and starting to fall in reverse wedge.
In this pattern, BTC fell to support area, where it reached support line and then made an upward impulse.
Now price declining, so, I think Bitcoin can fall a little and start to grow to $102600 resistance line of reverse wedge.
If this post is useful to you, you can support me with like/boost and advice in comments❤️

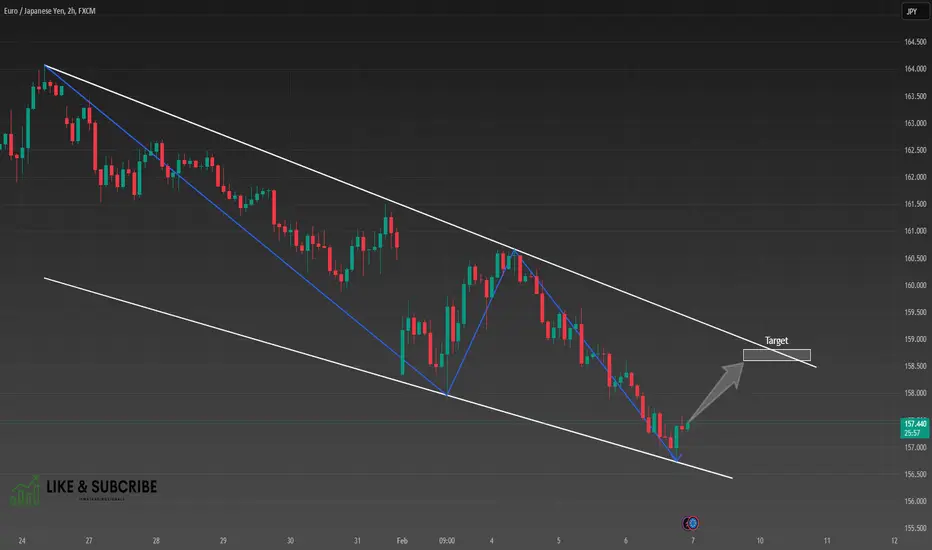
EUR/JPY, Long, 2h✅ EUR/JPY is forming a clear falling wedge pattern, signaling a potential bullish breakout. The price is expected to move upward toward the next resistance level.
LONG 🚀
✅ Like and subscribe to never miss a new analysis! ✅
Gold might revert to the trend line following a rising riseHello everyone, today I'm ready to provide you with Gold analytics. A few days ago, we saw a big upward movement in the market, but before that, Gold traded near support 2, which coincided with the support zone. Then it rebounded and surged to 2727 points before correcting even below support 2, but then it reversed and began trading inside the wedge. Price plummeted below the trend line and immediately rebounded, shattering the second support level and continuing to climb higher along this line.Gold ascended for a long time along this line, but on the fourth touch, it rebounded and reached the first support level, which corresponded with another support zone. Then it corrected to practically the trend line before quickly rising back to the first support, breaking it, and exiting the wedge. It then retested and increased its score to 2880 points. Now, I expect XAUUSD to make a correction to the trend line, which is positioned within the support zone. That's why I set my target at 2800 points, which corresponds to them. If you appreciate my analytics, please support me with a like or remark.

ONDO - The Sweet Spot!Hello TradingView Family / Fellow Traders. This is Richard, also known as theSignalyst.
📈After rejecting the $2 round number, ONDO has been in a correction phase and it is currently approaching the lower bound of its rising broadening wedge marked in blue.
Moreover, the green zone is a strong support and round number $1.
🏹 Thus, the highlighted blue circle is a strong area to look for buy setups as it is the intersection of the $1 round number and lower blue trendline acting as a non-horizontal support.
📚 As per my trading style:
As #ONDO approaches the blue circle, I will be looking for bullish reversal setups (like a double bottom pattern, trendline break , and so on...)
📚 Always follow your trading plan regarding entry, risk management, and trade management.
Good luck!
All Strategies Are Good; If Managed Properly!
~Rich

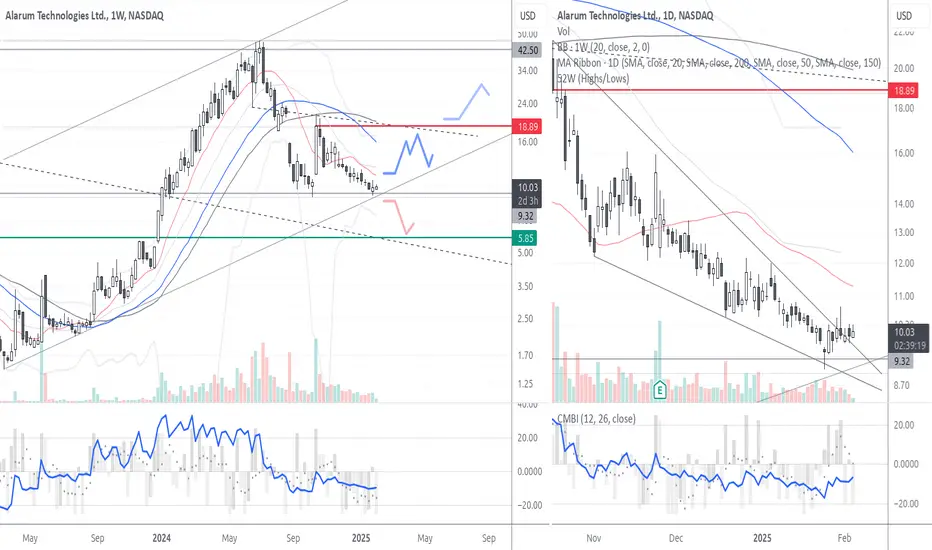
Alarum Technologies: Speculative high-risk high-reward setupTechnicals
Trend : While the daily chart is unmistakingly in a downtrend, the weekly looks more like a massive correction. However the uptrend that began in early 2023 has clearly been broken.
Price Action : Last week showed some bullishness, with a bounce from the 2020 shoulder support level and and a break above the falling wedge on the daily. Altogether the move hasn't been very decisive though and it faded with a reversal bar on friday. However ALAR hasnt fallen back below wedge support.
Momentum, Volatility and Volume have all been below average reflecting lingering interest in the stock.
Company Overview
Alarum Technologies Ltd. operates in the webscraping/data collection niche, primarily through its subsidiary, NetNut. The company provides IP proxy network (IPPN) services, enabling businesses to scrape and collect web data securely. Recent expansion efforts focus on the growing AI-driven data collection and labeling market, with products like the Website Unblocker and an upcoming AI Data Collector designed to automate and enhance data retrieval.
Current Situation
Q3 2024 Revenue of $7.2M, hitting the high end of guidance (+6.6% YoY) with NetNut contributing 97% of revenue.
Adjusted EBITDA of $1.4M, exceeding guidance but down YoY due to infrastructure investments.
Strong cash position of $24M and only 1.6M in debt.
Secured a Fortune 200 client, with potential for traffic (and revenue) to triple within 6-12 months.
Usage-based revenue model introduces short-term revenue volatility, while gross margins declined (73.6% vs. 79.4% YoY) due to network investments.
Short-Term Outlook
Q4 2024 Guidance: Estimated revenue of $7.5M (±3%) with EBITDA of $1.3M-$1.7M.
Near-Term Catalysts: Further Fortune 200 client expansion, adoption of Website Unblocker, and new AI Data Collector launch.
Potential Risks: Revenue fluctuation due to usage-based pricing, competitive pressure and reliance on short-term client contracts.
Conclusion
ALAR presents a high-risk, high-reward trade setup, with catalysts for upside momentum but also operational risks that could weigh on stock price movements in the coming months. The ongoing AI technology democratization, high operating leverage and a 1.5x EV/Sales valuation make me favor the upside whith a strict risk management recommended.
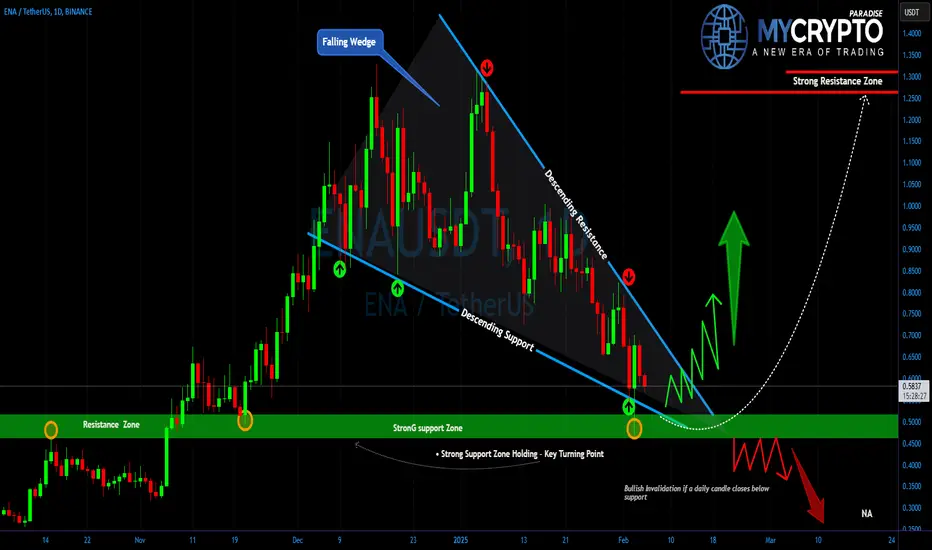
ENAUSDT – Massive Breakout Incoming? Yello, Paradisers! Are we about to witness a major reversal, or is #ENAUSDT gearing up for another leg down? Let’s break it down before the big move happens!
💎#ENAUSDT has been forming a falling wedge a classic bullish reversal pattern. The price has been consistently rejecting from the descending resistance while finding support at the lower boundary. But here’s the key part: price action is now testing a crucial support zone at $0.4690 an area where buyers have historically stepped in to push the market higher. This could be a major turning point.
💎If bulls take control and we see a breakout above the wedge resistance, it could trigger a strong rally. The first major target sits in the $0.8229–$0.8794 range, followed by a key resistance zone near $1.2690. With volume confirmation, this move could accelerate quickly, fueled by short squeezes and renewed bullish momentum.
💎On the flip side, if bulls fail to hold the support and the price breaks below, it could open the door for a deeper correction trapping late buyers and causing further liquidations.
This is not the time for emotional decisions. A big move is coming, but patience is key. Whether it’s a breakout or a breakdown, only a few traders will time it right.
MyCryptoParadise
iFeel the success🌴
Best Chart Patterns to Buy Gold in Uptrend
One of the proven strategies to safely buy gold in uptrend is to look for THESE chart patterns.
In this article, I will teach 4 best bullish price action patterns for Gold trading.
All the patterns that we will discuss work perfectly on a daily, 4h, 1h time frames.
The first strong bullish pattern, that we will discuss, is a bullish flag pattern.
The pattern is based on 2 important elements:
a bullish impulse leg and a bearish correctional movement afterward.
The highs and lows of a correctional movement should respect 2 falling trend lines: one being a vertical resistance and one being a vertical support.
These 2 trend lines will compose a falling parallel channel.
Your strong bullish signal will be a breakout of the resistance of the flag - a candle close above that.
The trading strategy of this pattern is very straightforward .
After a violation of the resistance of the flag is confirmed , buy the market immediately or on a retest. Place stop loss order below the lowest low of the pattern, initial target - the high of the pattern with a potential bullish continuation to a new high.
Look at a bullish flag pattern on Gold on a 4H time frame. A bullish breakout of its upper boundary was a perfect signal to buy XAUUSD.
The variation of a bullish flag pattern is a falling wedge pattern.
In a wedge pattern, a correctional movement occurs within a contracting channel based on 2 converging trend lines.
The same strategy is applied for buying wedge pattern after a breakout .
Above, you can see a falling wedge on Gold chart on a daily that was formed after a completion of a sharp bullish wave. Bullish violation of the resistance line of the pattern was a strong call to open long position.
Trading hundreds of bullish flags and falling wedges, I noticed that the wedge patter has a little bit higher accuracy.
The next chart pattern for buying Gold is called Ascending Triangle.
After completing a bullish impulse and setting a higher high, the market should start consolidating .
A consolidation should have a specific shape: the price should start respecting a horizontal resistance based on the last high and drop from that, setting equal high and a consequent higher low after every bearish movement.
A reliable bullish signal will be a breakout - a candle close above a horizontal resistance line based on the equal highs.
Buy Gold immediately after a violation, or set a buy limit order on a retest of a broken resistance.
Safe stop loss will be at least below the last higher low.
If you are taking the trade on 1H time frame, set it below the first higher low.
Take profit will be the next potentially strong resistance.
With the absence of historic resistances, your goal can be the next psychological level based on round numbers.
That's a perfect example of the ascending triangle pattern that formed on Gold on a daily time frame. After a breakout of its resistance, a bullish rally initiated.
Usually, the pattern is considered to be completed when the price sets at least 3 higher lows and 3 highers highs.
If only 2 equals highs and 2 higher lows are set, such a pattern will be called Cup & Handle.
Entry, stop loss and target rules are the same as in ascending triangle trading.
That's a nice cup & handle pattern on Gold on a 4H. Violation of its resistance triggered a significant trend-following movement.
The last pattern for buying Gold is horizontal parallel channel.
It should form after a completion of a bullish wave and represent a consolidation and indecision.
The price should set equal highs and consequent equal lows, respecting horizontal support and resistance.
A strong bullish signal to buy Gold will be a breakout of a horizontal resistance of the channel and a candle close above.
The principles of its trading strategy are very similar.
Open long position on Gold immediately after a candle close above the resistance or on its retest.
Stop loss should be placed below the support of the channel.
Take profit will be the next historic or (if there is no) psychological level.
Check this horizontal channel that was spotted on a daily time frame on Gold chart. After quite an extended consolidation within, the price violated its upper boundary and went up.
All these chart patterns have a unique shape and structure and are very easy to recognize. Apply them for trend-trading Gold on any time frame and good luck in your journey.
❤️Please, support my work with like, thank you!❤️