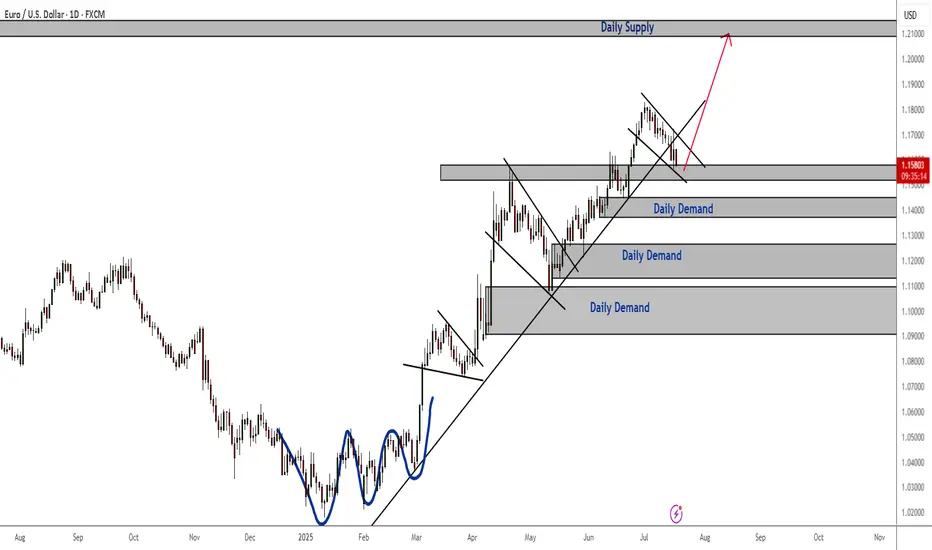
EURUSD Bullish Continuation Patterns and Consistent Demand The bullish continuation patterns and the consistent daily demand zones indicate that the trend is still bullish despite last week's bearish correction.
Price is currently reacting to a daily support zone. To confirm going long, especially long term, I recommend waiting for the current falling wedge to breakout and retest and then ride the bullish momentum to daily and weekly supply zones.
Wedge
XRP Hits $3.10 — Rising Wedge or Ready to Fly?XRP has been on a strong run over the past 24 days, rallying from $1.90 → $3.10 — a +62% price increase. But after hitting key resistance, is XRP about to correct, or will it break out further? Let’s dive into the technicals.
🧩 Market Structure
Rising Wedge Pattern:
The current market structure resembles a rising wedge, with XRP likely completing wave 5.
Rejection Zone Hit:
Price tapped the nPOC at $3.10 and rejected — providing a clean short opportunity.
📉 Key Support Levels & Confluences
Taking the full 24-day bullish move:
0.382 Fib Retracement: $2.6326 — aligns with liquidity pool below the $2.6596 swing low.
226-day Trading Range VAH: ~$2.62 (red dashed line) — adds confluence.
Daily Level: $2.60 — further support.
Anchored VWAP from $1.90 Low: ~$2.54 (rising over time).
✅ Conclusion: The $2.66–$2.60 zone is a critical support area and offers a solid long opportunity.
Trade Setups
🔴 Short Setup (After Breakdown Confirmation):
Wait for a sell-off & breakdown of the wedge.
Ideal entry: retest of the lower wedge edge, ideal short entry would be between 0.618–0.786 fib retracement.
🟢 Long Setup:
Entry Zone: $2.66–$2.60
SL: below VWAP line
Target: Fib 0.618 as TP
🧠 Educational Insight: Rising Wedges Explained
A rising wedge is a bearish pattern, often signalling weakening momentum as price climbs within narrowing highs and lows.
Key points:
➡️ Volume typically declines as the wedge matures.
➡️ Breakdown below the lower wedge edge often triggers stronger sell-offs.
➡️ Retests of the broken wedge support turn into ideal short entries.
Pro tip: Combine wedge patterns with fib retracement zones and VWAP levels for higher-confidence setups.
Watch for wedge breakdown confirmation before shorting.
_________________________________
💬 If you found this helpful, drop a like and comment!
Want breakdowns of other charts? Leave your requests below.

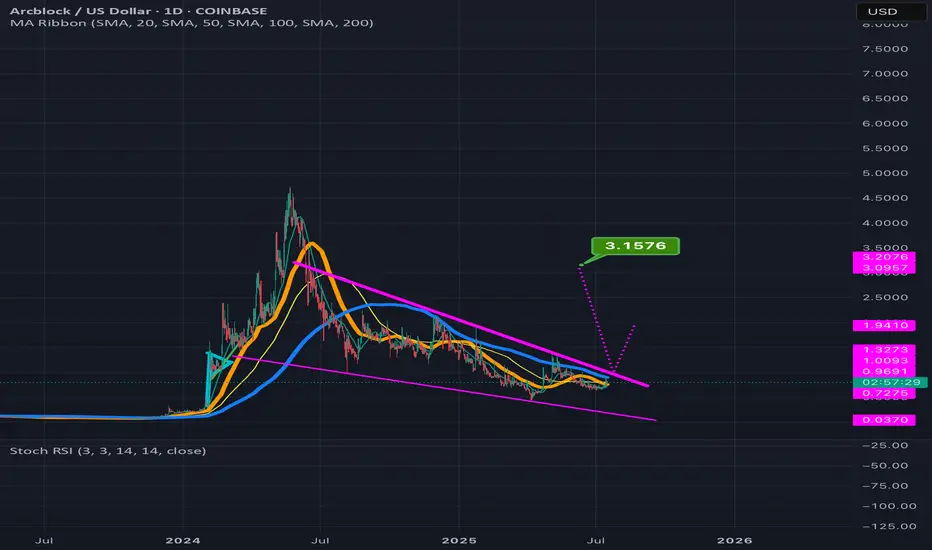
ABT can potentially 4x in value reading up from the wedge its inThe smaller pink dotted measured move line is for the inv h&s pattern its formed inside the wedge with the top trendline of the wedge doubling as the invh&s pattern’s neckline. Hitting that smaller target is more or less a 2x from current price action. If we hit the full falling wedge target that’s a 4x from where it is currently. *not financial advice*
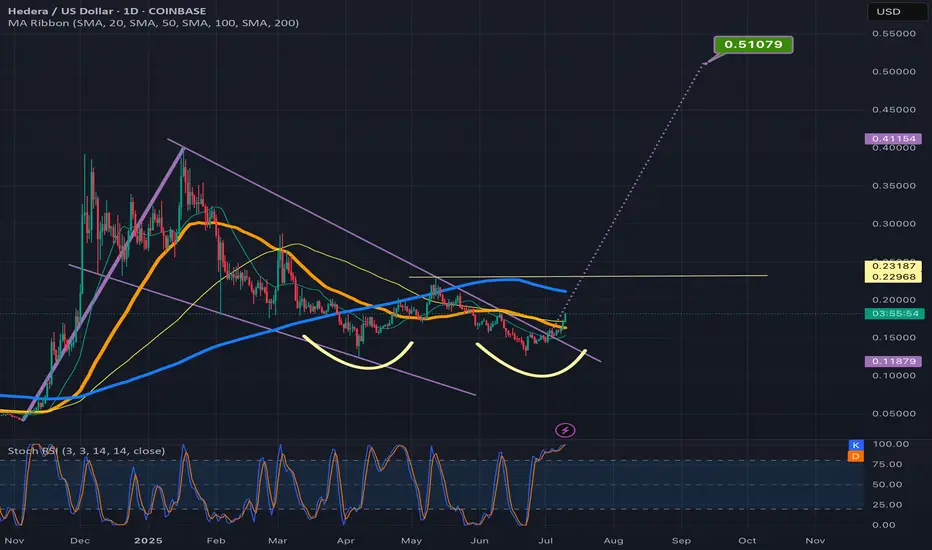
Hbar breaking upwar from fallingwedge/pennantAlso in a smaller double bottom setup here. *not financial advice*
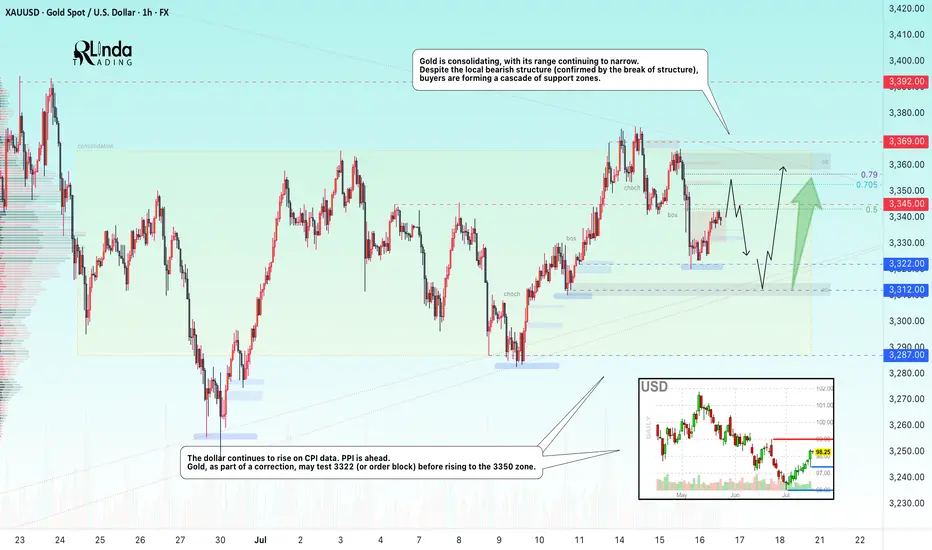
GOLD → Borders are shrinking. Consolidation continues...FX:XAUUSD is adjusting amid controversial CPI data and confirming the local bearish market structure. The PPI is ahead, and gold is consolidating, with its boundaries continuing to narrow...
Gold is recovering slightly but remains under pressure amid rising bond yields and a stronger US dollar. Higher inflation in the US reduces the chances of a quick Fed rate cut. Traders are cautious ahead of the PPI data release. If producer inflation exceeds forecasts, the dollar may rise again, putting further pressure on gold
Technically, we see consolidation in a symmetrical triangle pattern. Trading within the consolidation has a negative side - low volatility and unpredictable movements. The purpose of such movements is accumulation. However, decisions can be made based on relatively strong levels. In the current situation, we are seeing a rebound from 0.5 Fibonacci (I do not rule out a retest of the 0.7 zone before correction). The price may head towards the liquidity zone of 3322 before rising to the upper boundary of the consolidation and the zone of interest of 3350-3360.
Resistance levels: 3345, 3353, 3369
Support levels: 3322, 3312, 3287
The problem is that the price is in a consolidation phase. That is, technically, it is standing still and moving between local levels. You can trade relative to the indicated levels. Focus on PPI data. At the moment, gold is in the middle of a triangle and is likely to continue trading within the boundaries of a narrowing channel due to uncertainty...
Best regards, R. Linda!
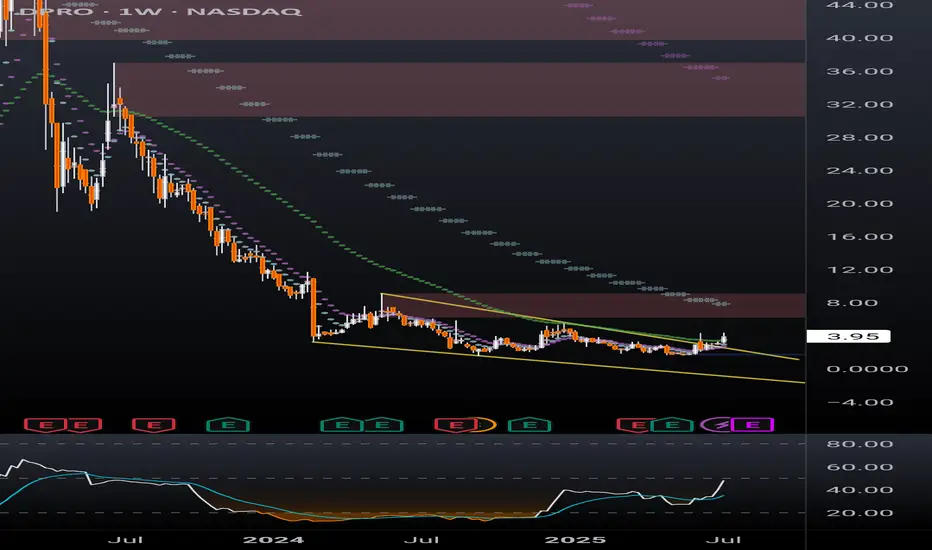
DPRO falling wedge breakoutDPRO has broken out of a falling wedge on the weekly. Ticker will respond well to Trump's "Big Beautiful Bill" which includes over $30 billion for defense/military spending. The drone company is already making progress with US military projects and is setting up for a strong rally.
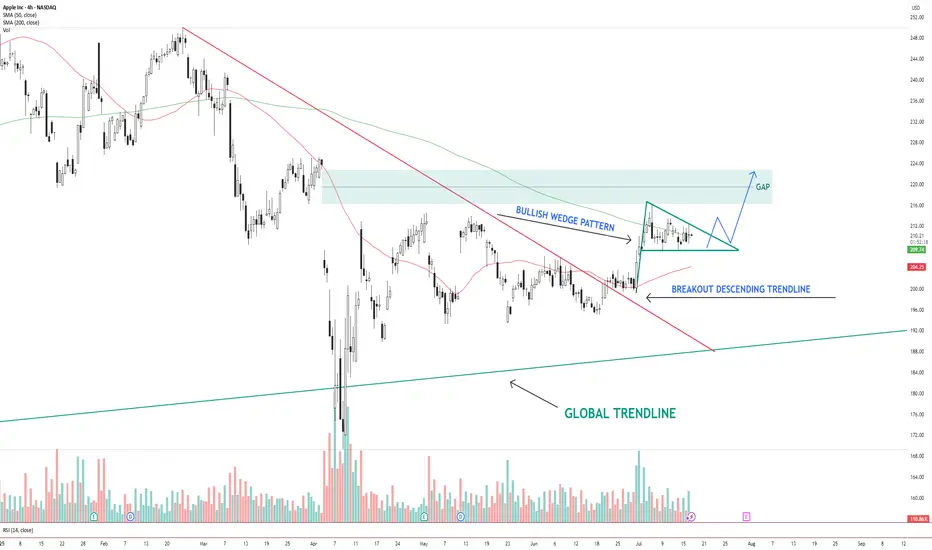
AAPL – Bullish Wedge Breakout Setup Toward Gap FillAAPL NASDAQ:AAPL has broken out of a descending trendline and is now consolidating inside a bullish wedge pattern . Price is holding above the 200 SMA and hovering near the 50 SMA.
The structure suggests a potential breakout above the wedge, with a clear gap area between $216–$224 acting as the next upside target.
Key levels:
Support: $206 (wedge base / 50 SMA)
Resistance: $216–$224 (gap zone)
Trend structure: Bullish consolidation after breakout
A clean breakout from the wedge with volume could trigger a continuation move toward the gap zone.
📌 Watching for confirmation and potential entry on a breakout + retest.
This is not financial advice. Always do your own research.
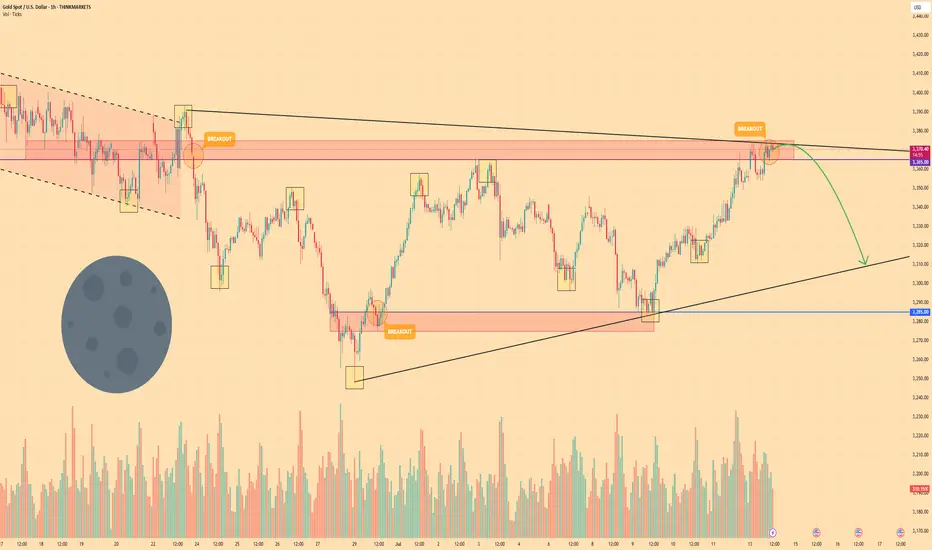
GOLD - Price can start to decline and break support levelHi guys, this is my overview for EURUSD, feel free to check it and write your feedback in comments👊
Gold initially traded inside a steady falling channel, carving lower highs at $3390 and lower lows around $3285 as bears held sway.
A brief fake breakout at $3365 briefly flipped sentiment, but sellers quickly reasserted control and pushed price back toward the channel floor.
Buyers then absorbed selling at the $3285 support area, sparking a rebound into a rising wedge pattern marked by converging trendlines.
Within this wedge, three minor breakouts failed to trigger sustained rallies, underscoring persistent resistance near the upper boundary.
I anticipate Gold to roll over from the wedge’s ceiling and break below $3365, targeting the wedge’s lower support line at $3310
If this post is useful to you, you can support me with like/boost and advice in comments❤️
Disclaimer: As part of ThinkMarkets’ Influencer Program, I am sponsored to share and publish their charts in my analysis.
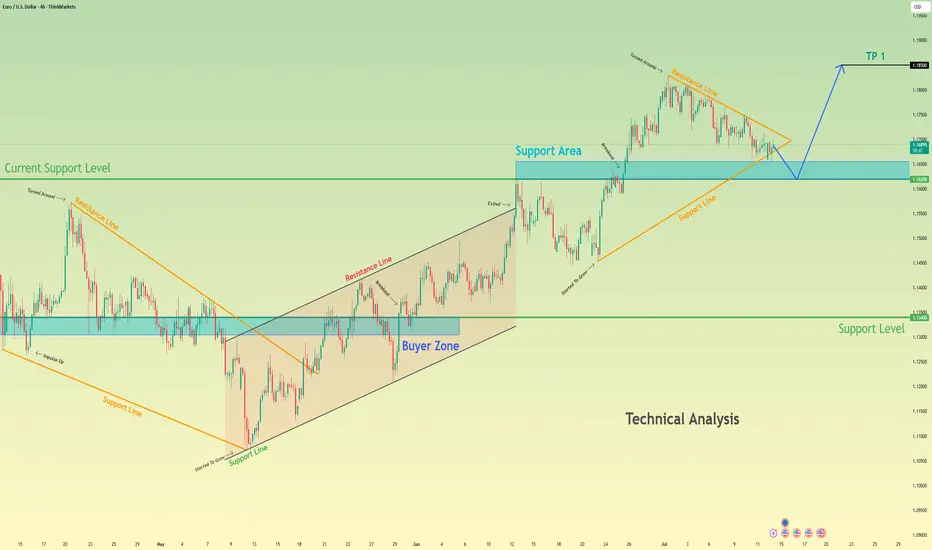
Euro may fall to support area and then start to growHello traders, I want share with you my opinion about Euro. The price previously moved inside a wedge formation, where it tested the buyer zone and showed a strong reaction from this area. After that, the pair broke out upward and started to trade inside an upward channel, building momentum and forming a clear bullish structure. Later, the price created a pennant pattern, often considered a continuation signal. But before continuing the upward trend, I expect the Euro to first exit from the pennant and decline toward the support area. This zone was previously resistantce, and now it may turn into a strong support. Now the price is trading near the pennant resistance, but I don’t expect a breakout right away. The market needs to correct before it resumes the uptrend. Once the price reaches the current support level or slightly lower, it may find demand again and bounce. That’s why I expect the Euro to retest the support zone and then grow further toward TP 1 - 1.1850 points. This target aligns with the upper border of the upward channel and would complete the continuation move after the pennant breakout. Given the previous structure, bullish momentum, and patterns on the chart, I remain bullish after the correction and expect the price to rise from the support zone. Please share this idea with your friends and click Boost 🚀
Disclaimer: As part of ThinkMarkets’ Influencer Program, I am sponsored to share and publish their charts in my analysis.
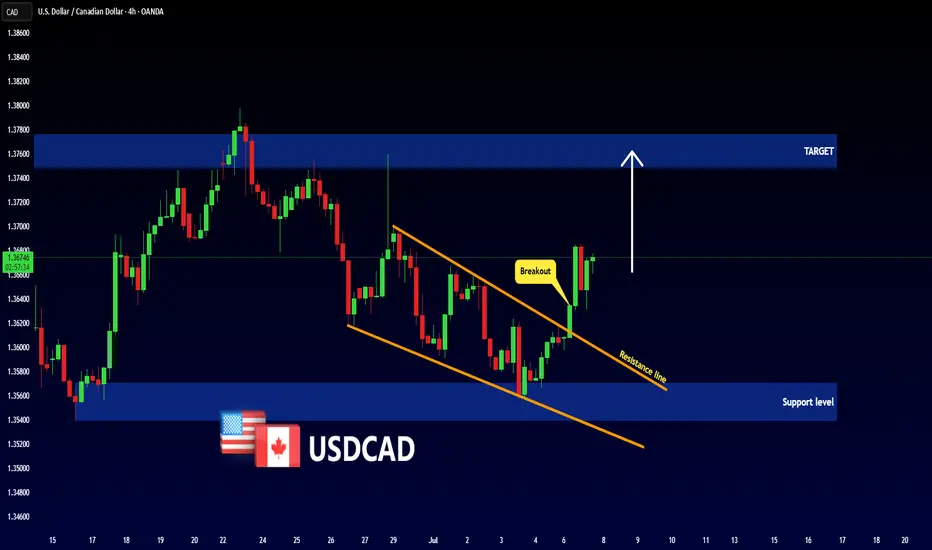
USDCAD - Bullish Falling WedgeHello Traders !
On Thursday 3 July, The USDCAD reached the support level (1.35400 - 1.35706).
The price formed a falling wedge pattern.
Currently, The resistance line is broken!
So, I expect a bullish move🚀
______________
TARGET: 1.37490🎯
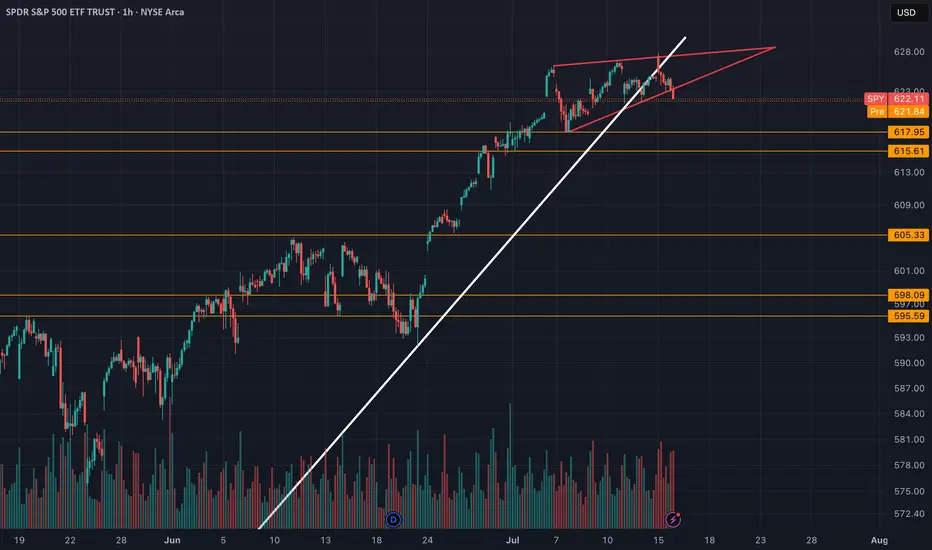
SPY (SP-500) - Rising WedgeYesterday we had a breakdown of the rising wedge on SPY. I draw out some important levels to look out for coming days/weeks. The trendline since april has also been broken. ICEUS:DXY is breaking out to which is increasing the risks for a "Risk off" scenario in tech stocks and crypto.
Nothing here should be interpreted as financial advise. Always do your own research and decisions.
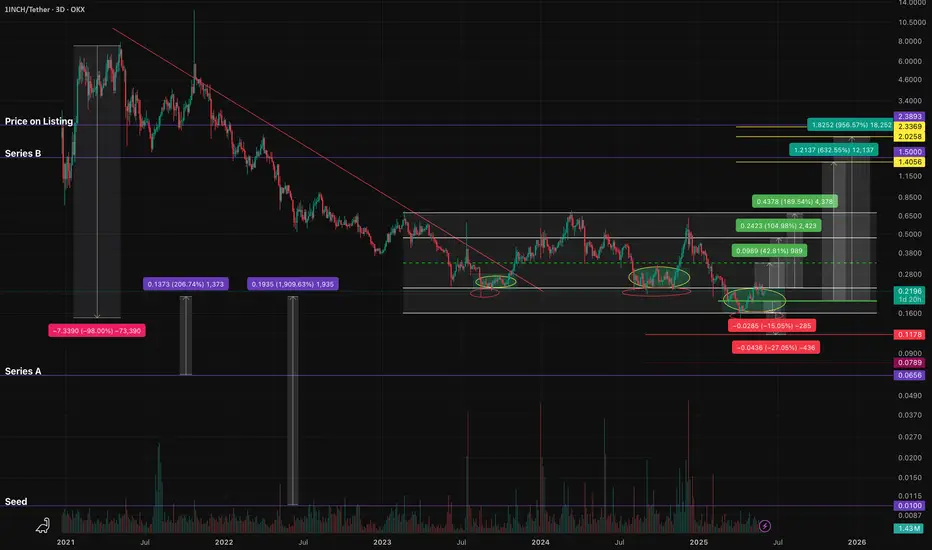
1INCHUSDT - fear zone, return to the channel, growth potential1inch - is a decentralized exchange (DEX) aggregator that combines multiple DEXs into a single platform, aiming to provide users with the most efficient routes for swaps across all platforms.
📍 CoinMarketCap : #160
📍 Twitter(X) : 1.3M
The coin has already been listed on exchanges during the distribution phase of the cycle and was partially sold off in waves. Then, in line with the overall market, it declined to more reasonable accumulation prices, shaking out small investors and those who entered positions on positive news.
The price has been moving within a horizontal channel for a couple of years, and the channel’s percentage range reflects the coin’s liquidity. Currently, the coin is in a fear zone, at its lowest price levels. In moments like this, very few people have funds left to accumulate positions, as they’ve already been trapped by optimistic bloggers and a positive news background earlier.
Many were wiped out recently due to a breakdown and consolidation below the previous support of the inner channel, and now there's emptiness and fear below. What’s happening now is an attempt to return back into the inner channel. If this zone holds, the channel targets may be realized.
Resistance zones where the price may react are marked on the chart. Potential final downside wicks are also indicated. It’s important to allocate funds wisely for position building and use proper percentage distribution, according to your own experience!
______
📌 Not financial advice. Observing structure and recurring phases.
Operate within your strategy and with an awareness of risks.
NZDCHF → Pre-breakdown consolidation on a downtrendFX:NZDCHF is forming a pre-breakout consolidation amid a downtrend. Focus on support at 0.4759. Global and local trends are down...
On July 10-11, the currency pair attempted to break out of the trend. In the chart, it looks like a resistance breakout, but technically it was a short squeeze aimed at accumulating liquidity before the fall. We can see that the price quickly returned back and the market is testing the low from which the trap formation began. The risk zone for the market is 0.4759 - 0.475. In simple terms, this is a bull trap against the backdrop of a downtrend. The NZD has passed through the risk zone. At this time, the currency pair is forming a pre-breakout consolidation relative to the support level of 0.4759 with the aim of continuing its decline.
Support levels: 0.4759, 0.4753
Resistance levels: 0.477, 0.4782
A breakout of the 0.4759 level and consolidation in the sell zone could trigger a continuation of the decline within the main and local trends.
Best regards, R. Linda!

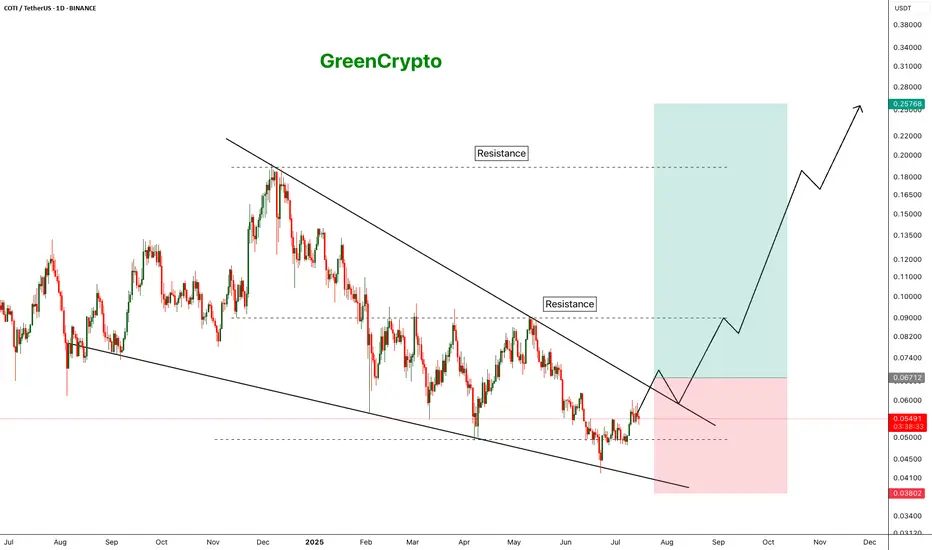
COTI - Crazy Breakout Soooooon- COTI is trading inside the falling wedge pattern
- Price is currently nearing the resistance trendline,
- A clear breakout of this trendline will push the price higher
- we will enter a long trade after the breakout
Entry Price: 0.06696
Stop Loss: 0.03793
TP1: 0.07746
TP2: 0.10366
TP3: 0.14599
TP4: 0.25150
Don't forget to keep stoploss
Cheers
GreenCrypto
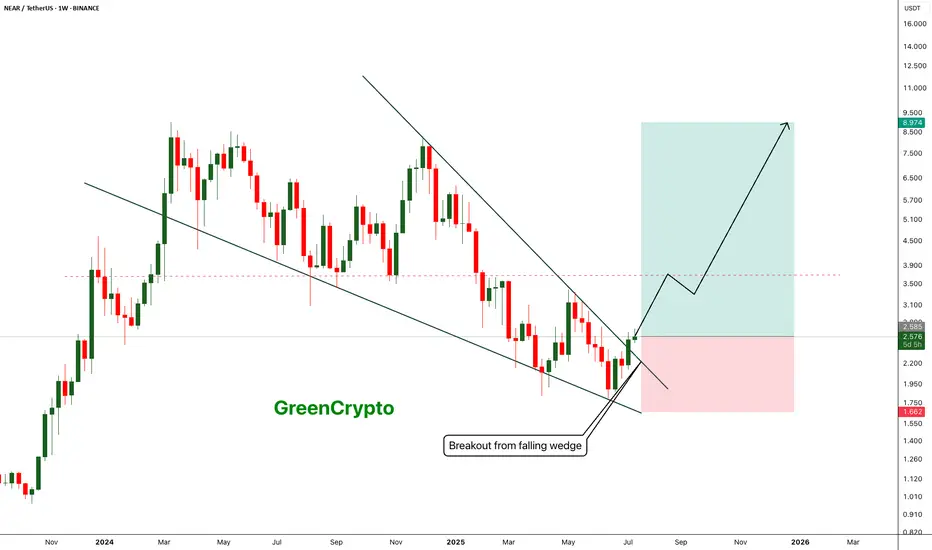
NEAR - Breakout from falling wedge pattern- Near has successfully broken out from the falling wedge pattern and now heading towards the next minor resistance around 3.6 range
- breakout from the minor resistance should push price towards the 9$ range
Entry Price: 2.57
Stop Loss: 1.66
TP1:2.935
TP2: 3.256
TP3: 3.986
TP4: 5.461
TP5: 7.102
TP6: 8.948
Stay tuned for more updates.
Cheers
GreenCrypto
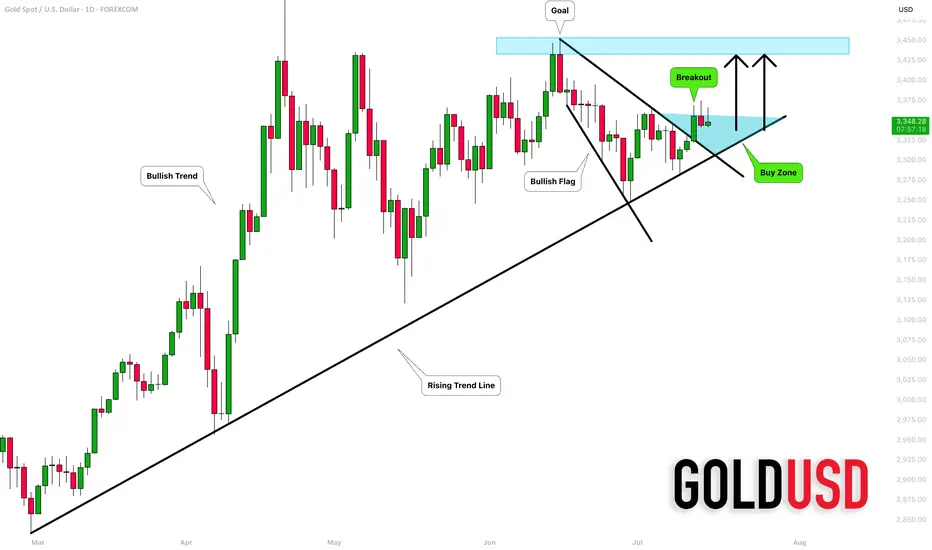
GOLD (XAUUSD): Mid-Term Outlook
Analysing a price action on Gold since March,
I see a couple of reliable bullish signals to consider.
As you can see, for the last 4 month, the market is respecting
a rising trend line as a support.
The last 4 Higher Lows are based on that vertical support.
The last test of a trend line triggered a strong bullish reaction.
The price successfully violated a resistance line of a bullish flag pattern,
where the market was correcting for almost a month.
A strong reaction to a trend line and a breakout of a resistance of the flag
provide 2 strong bullish signals.
I think that the market may grow more soon and reach at least 3430 resistance.
An underlined blue area will be a demand zone where buying orders will most likely accumulate.
❤️Please, support my work with like, thank you!❤️
LONG ON GBP/USDGU is currently in its pullback phase of its uptrend.
We have a nice sell side Liquidity sweep being completed at this moment.
Price should now tap into previous demand that broke a high to repeat history and rise again.
Very Nice Setup over 300 pips on the table to the previous high/supply zone.

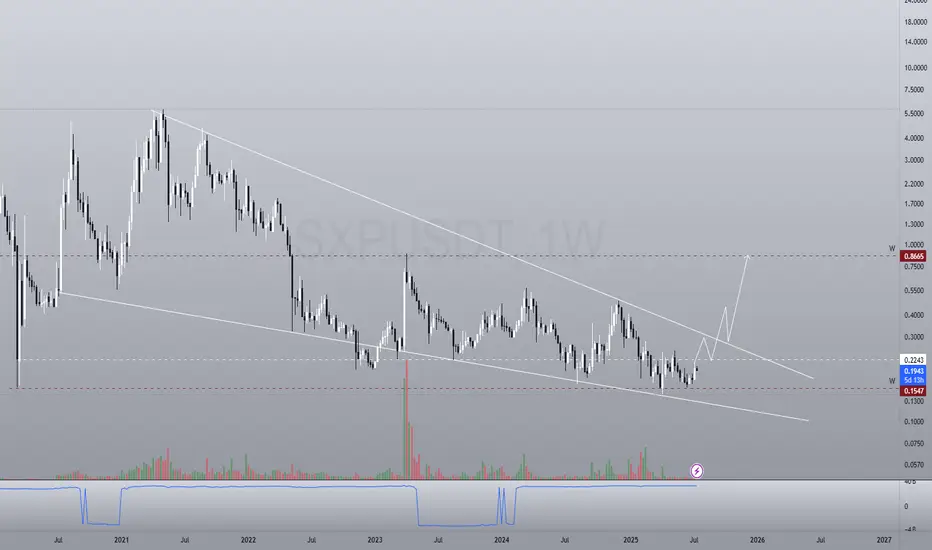
$SXP in falling wedge and retested weekly supportSaw this oldie in my watch list and seems like a good risk-reward setup on weekly chart. Held support, now needs to flip that smaller resistance in the wedge (white line) then break out.
Long term play (swing long)
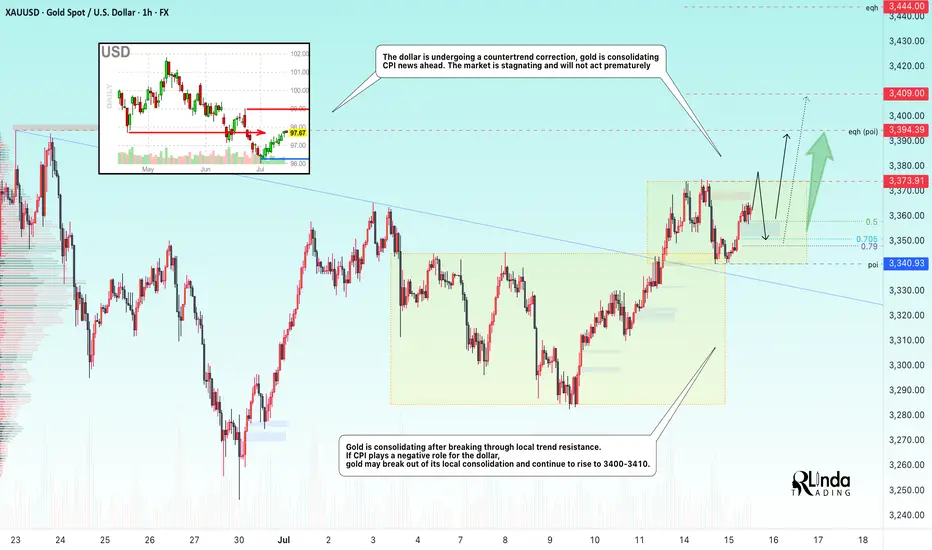
GOLD → Consolidation ahead of CPI. Chances for growth?FX:XAUUSD Gold is consolidating amid a correction in the dollar ahead of important news. Consumer price index data is due later today. The market is stagnant and will not move prematurely.
On Tuesday, gold rose slightly amid profit-taking ahead of the US CPI release. Investors are waiting for a signal from inflation: weaker data could strengthen bets on a Fed rate cut and support gold, while strong inflation would strengthen the dollar and put pressure on the metal. The situation is exacerbated by Trump's new tariff threats and his criticism of the Fed chair. Let me remind you of Trump's pressure on regulators regarding inflation and interest rate cuts.
Technically, gold is trading above the previously broken “symmetrical triangle” consolidation. Bulls are trying to hold their ground above 3340-3350. Focus on the current range of 3340-3373
Resistance levels: 3373, 3394
Support levels: 3350, 3340
Favorable news for gold could boost interest in the metal, which would generally lead to growth. However, there is a factor of unpredictability, and against this backdrop, gold may test support at 3350-3340. If the bulls manage to keep the price above this zone, we may see growth in the medium term. Otherwise, the price may drop to 3310-3280.
Best regards, R. Linda!
TON It will grow soon...So if you pay attention to the TON chart you can see that the price has formed a Ascending wedge which means it is expected to price move as equal as the measured price movement.( AB=CD )
NOTE: wait for break of the WEDGE .
Best regards CobraVanguard.💚

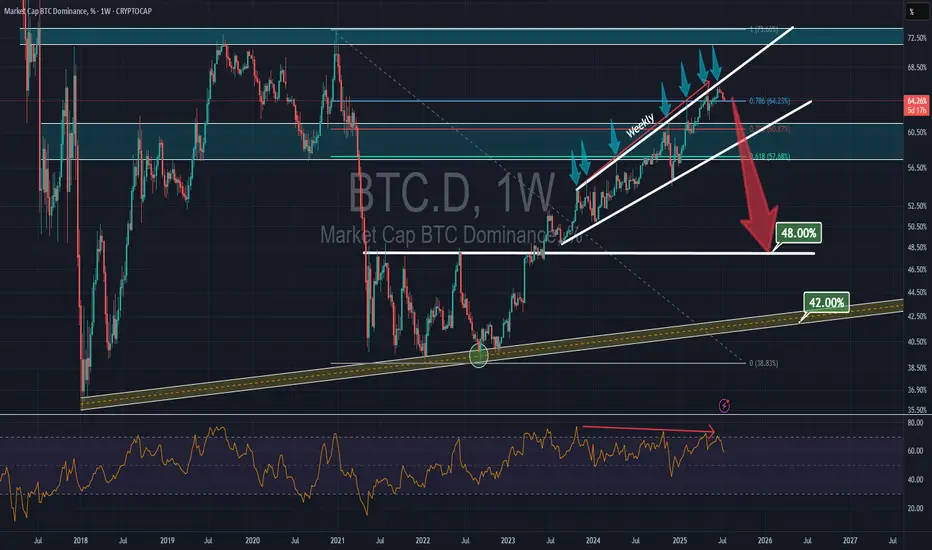
Bitcoin DOMINANCE dropssssBTC dominance has been within a rising channel since October 2023, showing a significant bearish divergence on the weekly RSI. After the seventh rejection from the channel's top, it may drop to the major support at 48%.
US500 evening analysisMy primary count of bullish price action since 7 April 2025 low sees regular flat (regular flat A, zigzag B, impulse C), impulse C with ending diagonal 5 of (5).
Median line (red line) of pitchfork was never tagged, implies price action eventually returning to origin (5098.6).
Ending diagonal invalid above 6307.2, bears with high reward, low risk opportunity.

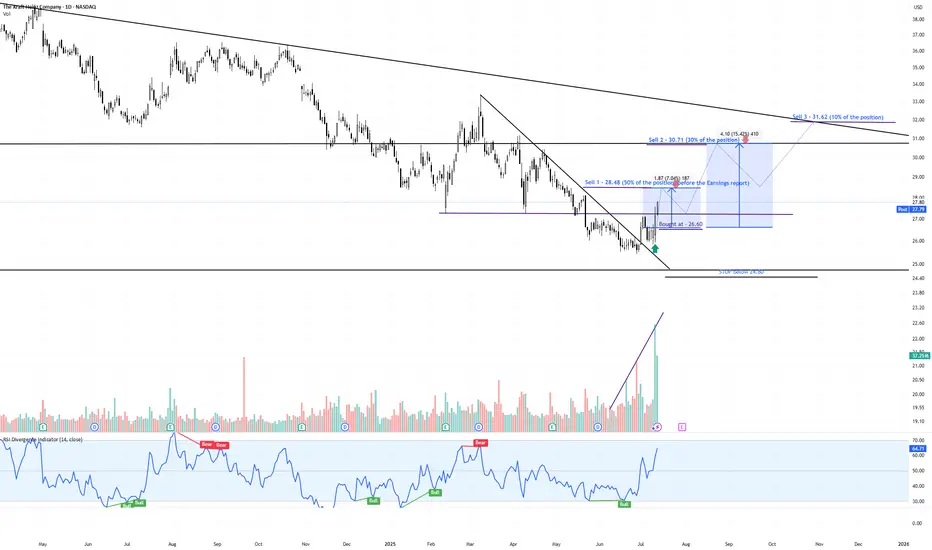
KHC – Momentum Reversal with Volume Surge & Tactical Exit Plan📈 Ticker: NASDAQ:KHC (The Kraft Heinz Company – NASDAQ)
📆 Timeframe: 1D (Daily)
💵 Current Price: $27.80
📊 Pattern: Falling Wedge Breakout + Volume & RSI Divergence
📌 Trade Setup:
✅ Our Entry: $26.60
⛔ Stop-Loss: Below $24.80
🔰 Confirmation Signals:
Bullish volume divergence: Selling pressure diminished while price made lower lows
Explosive green volume bar on breakout — strongest in 12+ months
RSI breakout above 60, confirming strong momentum and trend shift
💰 Profit-Taking Strategy:
📍Sell Zone Price Level % of Position Rationale
🥇 Sell 1 $28.48 50% Pre-earnings resistance – lock early profit
🥈 Sell 2 $30.71 30% Next strong resistance area
🥉 Sell 3 $31.62 10% Long-term descending trendline — potential reversal point
🔄 Remaining 10%: Optional trail with stop-loss raised, if momentum continues
📊 Technical Confidence & Probabilities:
🧠 Pattern: Falling Wedge
Bulkowski probability of breakout upward: ~68%
Average gain post-breakout: ~38%, though current targets are more conservative (15–19%)
📈 Volume breakout + prior divergence = strong institutional signal
📉 Risk clearly defined with stop at $24.80
📈 Target Gains vs Entry ($26.60):
🎯 Target Price Gain from Entry
Target 1 $28.48 +7.06%
Target 2 $30.71 +15.47%
Target 3 $31.62 +18.89%
🧾 Summary:
This is a high-probability breakout play, combining:
✅ Bulkowski-validated falling wedge
✅ Volume-based confirmation
✅ Clear stop and tiered exit strategy
✅ Strong risk/reward profile
“Our Entry Price: $26.60 – Breakout Backed by Big Money”
#KHC #TargetTraders #VolumeSpike #BreakoutTrade #TechnicalAnalysis #Bulkowski #StockMarket #Investing