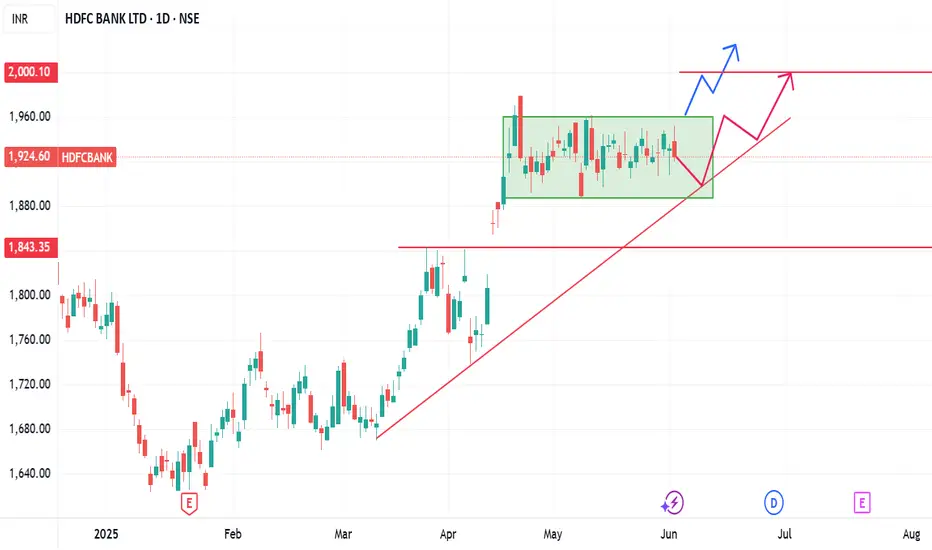
hdfc bank on side way formation hdfc bang today formed a negative pattern can go in consolidation for a while trendline support is good and needs to sustain above it for positive trend hold
Wedge
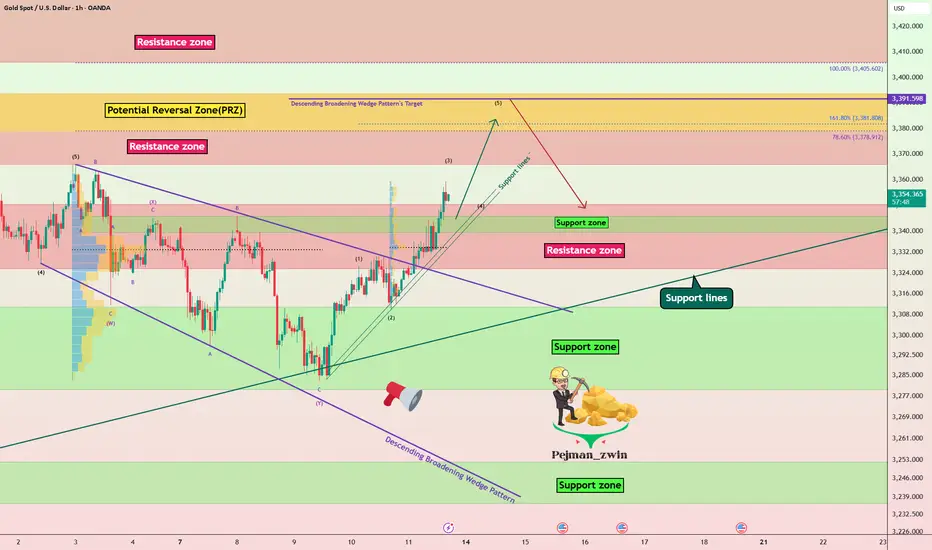
Gold Roadmap=>Short termGold ( OANDA:XAUUSD ) currently appears to have broken through the Resistance zone($3,350-$3,325) .
The Resistance zone($3,350-$3,325) was broken with the help of the Descending Broadening Wedge Pattern , the upper line of this classic pattern having served as an important resistance line for us in previous ideas .
In terms of Elliott wave theory , Gold has completed the Double Three Correction(WXY) within the Descending Broadening Wedge Pattern . It is currently completing the next five impulse waves . Wave 5 of these waves could end in the Potential Reversal Zone(PRZ) .
I expect Gold to rise to the Potential Reversal Zone(PRZ) , and of course, given the momentum of gold approaching PRZ , we can also look for Short positions in PRZ .
Note: Stop Loss (SL) = $3,329
Gold Analyze (XAUUSD), 1-hour time frame.
Be sure to follow the updated ideas.
Do not forget to put a Stop loss for your positions (For every position you want to open).
Please follow your strategy; this is just my idea, and I will gladly see your ideas in this post.
Please do not forget the ✅ ' like ' ✅ button 🙏😊 & Share it with your friends; thanks, and Trade safe.
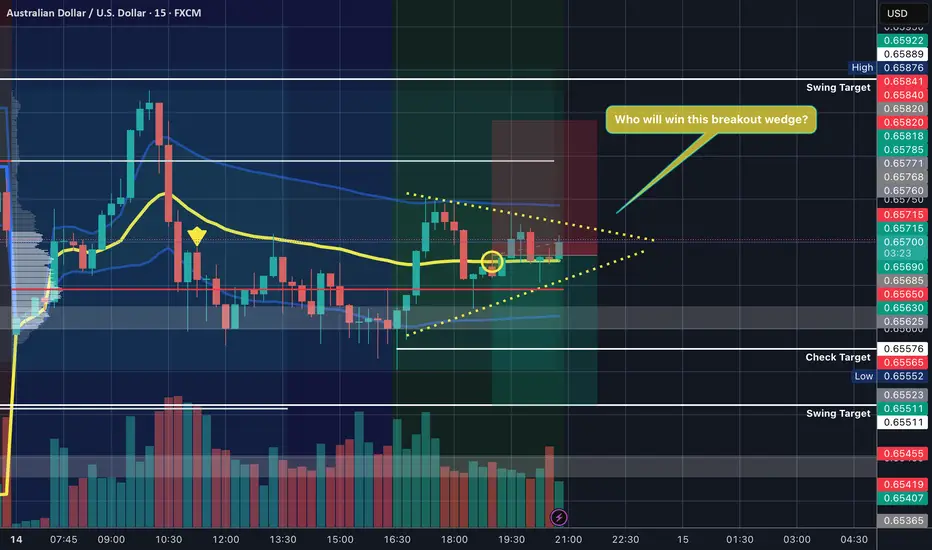
$AUDUSD - Who will win this breakout wedge? Who else is spotting this wedge in the OANDA:AUDUSD ?
As an orderflow trader, my bet is going Short $$$
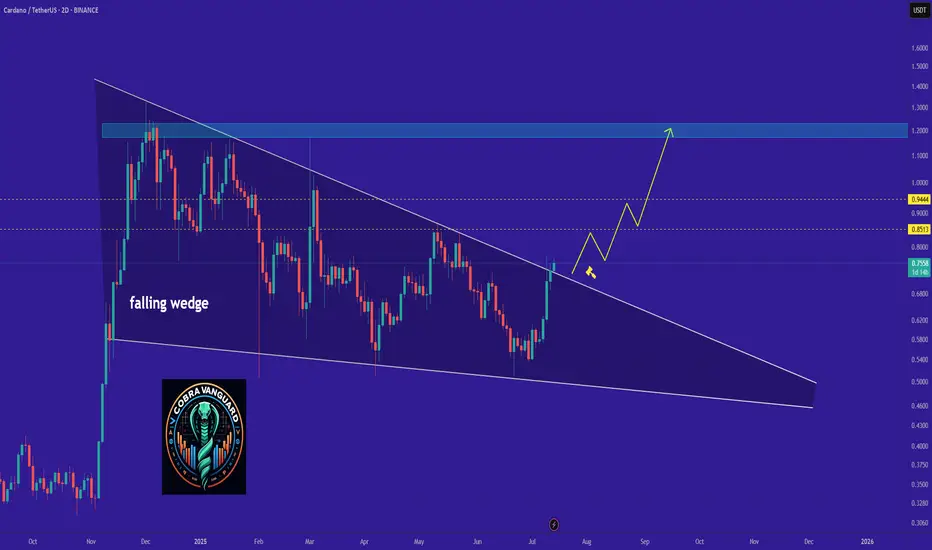
ADA - Time to buy again!The price has broken the wedge pattern, which means it can easily reach its previous high or even go higher.
Best regards CobraVanguard.💚
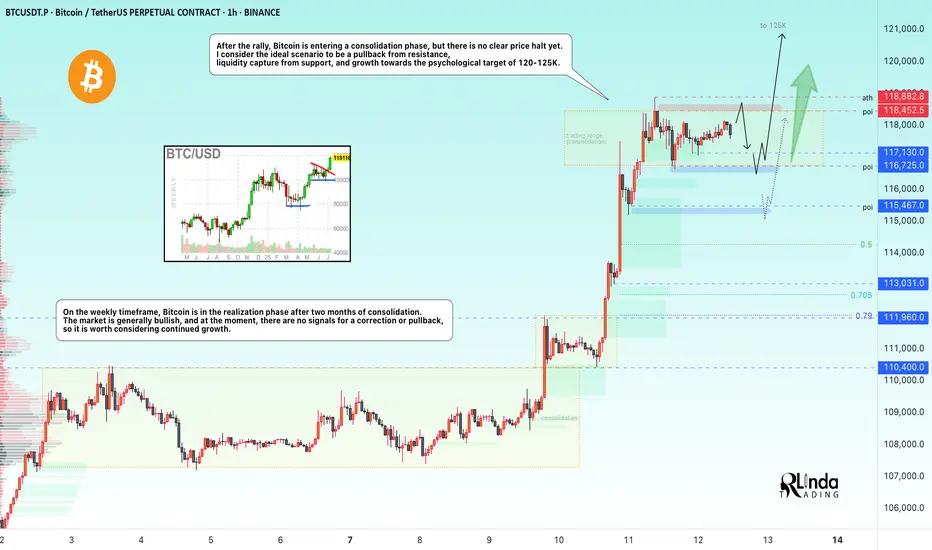
BITCOIN → Stopping after the rally? What next? 125K or 110K?BINANCE:BTCUSDT rose and updated its historical maximum to a new record of 118K with “kopecks” (different prices on different exchanges). Now the price has supposedly stopped and entered a consolidation phase, but it is too early to draw any conclusions based on this alone...
Fundamentally, Bitcoin rose following the SP500 and NQ100 indices. The reasons are clearly geopolitical. The correlation level is not high, but the flagship is following the stock indices, which are also updating their historical highs.
Technically, Bitcoin has emerged from a two-month consolidation and entered a realization phase. So what's next? Continuation of the phase or correction? Let's take a look.
On the daily chart, I would highlight two zones. The risk and sell zone is below 117,500. If the price closes below this zone today/tomorrow, we will most likely be able to look for signals for a possible correction. As part of the correction, we can expect a decline to 115,500, 114,300, or even to the old ATH of 112K.
The second zone is the buying zone. A closing price above 118,400–118,900 and consolidation with the gradual formation of a breakout of structure may hint at a possible continuation of growth toward psychological targets.
Resistance levels: 118,400, 118900
Support levels: 117100, 116700, 115500
In the chart above, I have highlighted the situations, levels, and zones that interest me more precisely.
Now I am waiting for Bitcoin to retest resistance or support and confirm certain levels, based on which decisions can be made. I think that in the near future, Bitcoin will show us where it is headed. Updates will be published as something interesting emerges...
Best regards, R. Linda!
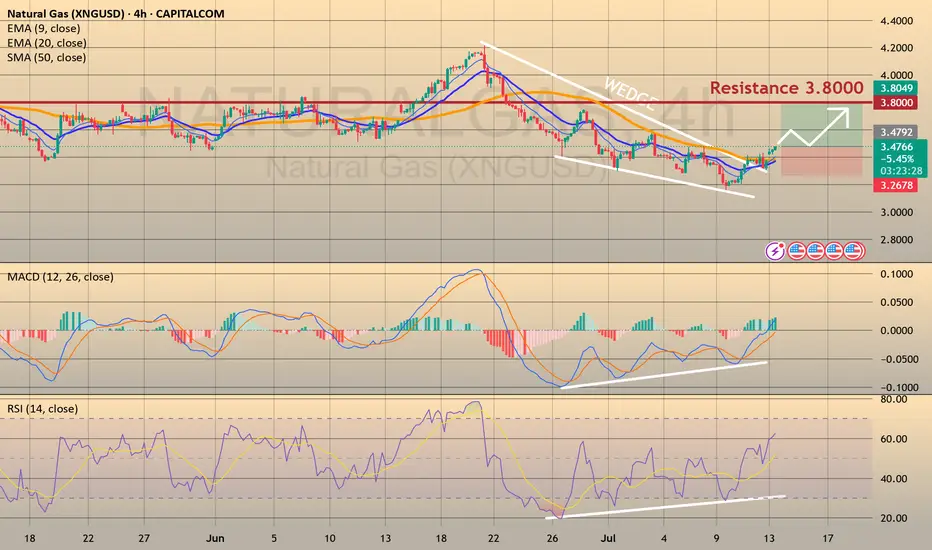
NATURAL GAS - REBOUND FROM THE MAJOR TRENDLINE AND ANOTHER LONG CAPITALCOM:NATURALGAS
Last week on Wednesday and Thursday we observed the false breakout of the major trendline. Eventually, Thursday ended up bullish, gaining 4.8% day-to-day. On Friday the asset has been trading majorly sideways, retesting the major trendline (pic 1). Technically, looks like the divergence on RSI, MACD and Momentum works out as well as the bullish wedge (pic 2). Fundamentally, we still have warm temperature weather forecasts in the U.S. and bullish Thursday's EIA report. Additionally, today the market opened with a bullish gap and continues to grow, which is a good signal for the buyers.
Considering major levels here, I decided to open long positions:
🔼 a market buy order at 3.4556 with
❌a stop loss at 3.2995 and
🤑a take profit at 3.7927
At 3.6000 would be reasonable to reduce long position on a half. Thank you for the attention!
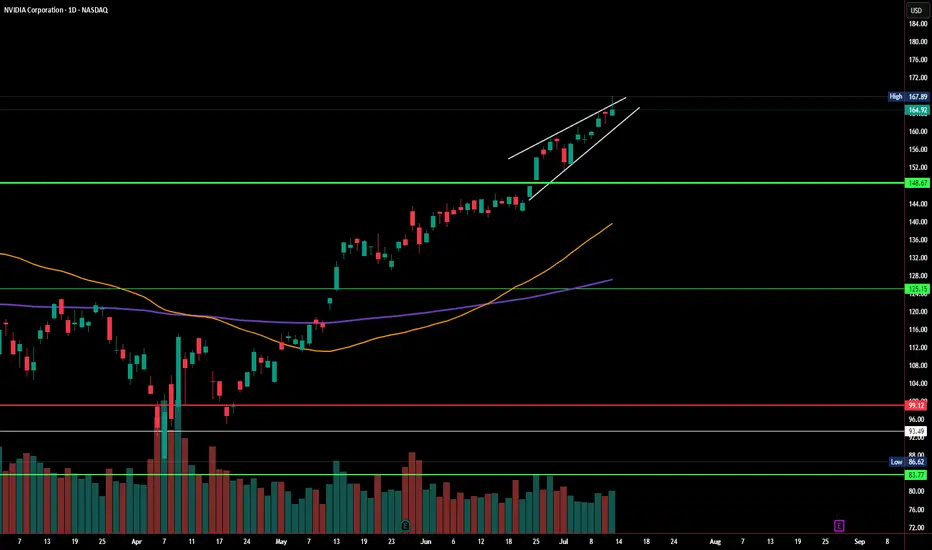
NVDA Daily Chart – Rising Wedge Alert!Just analyzed this NVDA setup. We’re seeing a clear rising wedge forming near the top of a strong run-up — typically a bearish reversal pattern. Price tagged $167.89 and pulled back slightly, closing at $164.92.
If this breaks down, watch the $148.67 - 151.31 area, and below that $125 as a key level. Bulls want to see a strong hold and breakout above $168 to invalidate the wedge.
#NVDA #NVIDIA
TRBUSDT: Massive Bullish Setup or a Fakeout Trap?Yello Paradisers — is TRBUSDT gearing up for a major breakout, or is this just another fakeout before a deeper drop? Our previous calls have been consistently accurate, and now this chart is flashing multiple signals that deserve your full attention.
💎Currently, TRBUSDT has formed a textbook falling wedge pattern, a well-known bullish reversal signal. What's adding strength to this setup is a clear bullish divergence, suggesting that momentum may be shifting in favor of the bulls. Even more compelling, the price is now holding firmly inside a bullish Order Block (OB) zone, which is aligned with the 200 EMA — a powerful confluence that increases the probability of a bullish move significantly.
💎For aggressive traders, this could be a valid spot to enter immediately, capitalizing on the current structure and zone. However, for those looking for a more calculated entry with improved risk-to-reward, waiting for a pullback could provide a much better setup — with the potential to offer over 4.5 RR, making it a high-probability trade idea.
💎That said, it’s important to manage risk carefully. If TRBUSDT breaks down and closes candle below the bullish OB zone, this would invalidate the bullish setup entirely. In that case, the smart move would be to wait patiently for new price action to form before making any decisions. Reacting emotionally here could lead to unnecessary losses, so discipline is key.
🎖Strive for consistency, not quick profits. Treat the market as a businessman, not as a gambler. If you want to be consistently profitable, you need to be extremely patient and always wait only for the best, highest probability trading opportunities.
MyCryptoParadise
iFeel the success🌴

USDT DOMINANCE Huge Crash incoming? Everyone seems to be ignoring the breakdown of the rising wedge on the weekly timeframe of USDT dominance. While many are clinging to small hopes of Bitcoin reaching new highs—some targeting $130K, others $150K—they’re overlooking a major pattern that could flip the entire game.
Just think for a moment: if this pattern plays out and USDT dominance hits its target, it could drop all the way down to 1. 5% to 2%. When that happens, imagine where Bitcoin's price could go. The upside potential is massive.
You can exit at 2% for safe side.
Nothing in trading is ever 100% certain—anything is possible—but this is a scenario that most people are missing. And if it does unfold, it could trigger a supercycle and potentially the biggest blow-off top in Bitcoin’s history.
Keep this possibility in mind. Watch closely. The chances of this playing out are high.

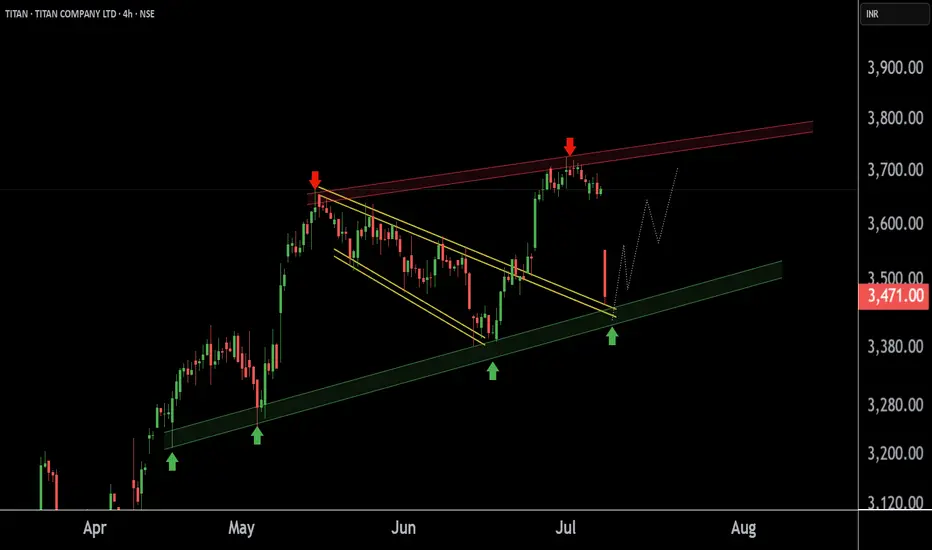
Titan at Best Support Zone !! This is the 4 hour chart of Titan Company.
Titan having a good support zone near 3400-3460 level.
If this level is sustain , then we may see higher prices in Titan company.
Thank You !!
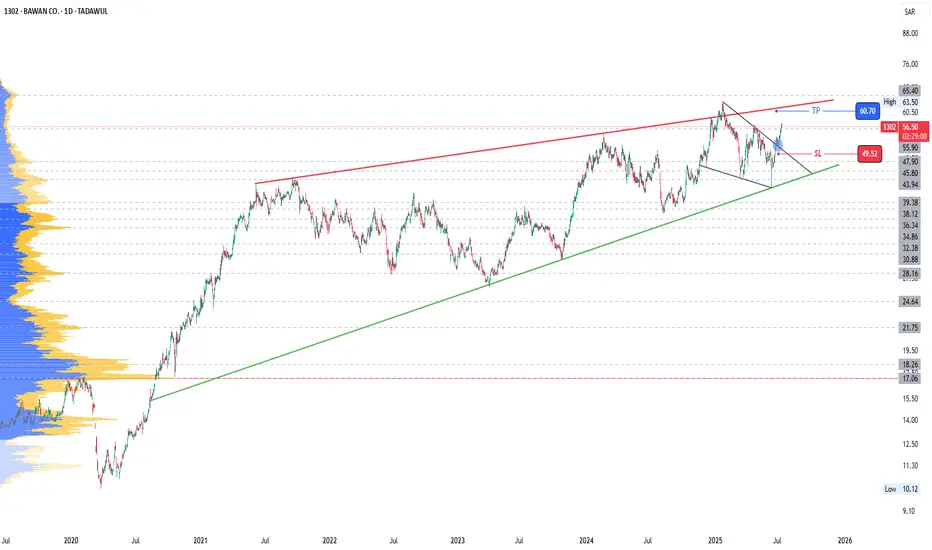
1302: Breakout of trendline resistance1302
Moving within a Rising Wedge
Price has just broken a short term resistance.
Short trade up to the top of rising wedge can be taken
Levels are marked
Trail SL accordingly.
Do proper risk management.
Watch for breakout of Rising Wedge top (Resistance)
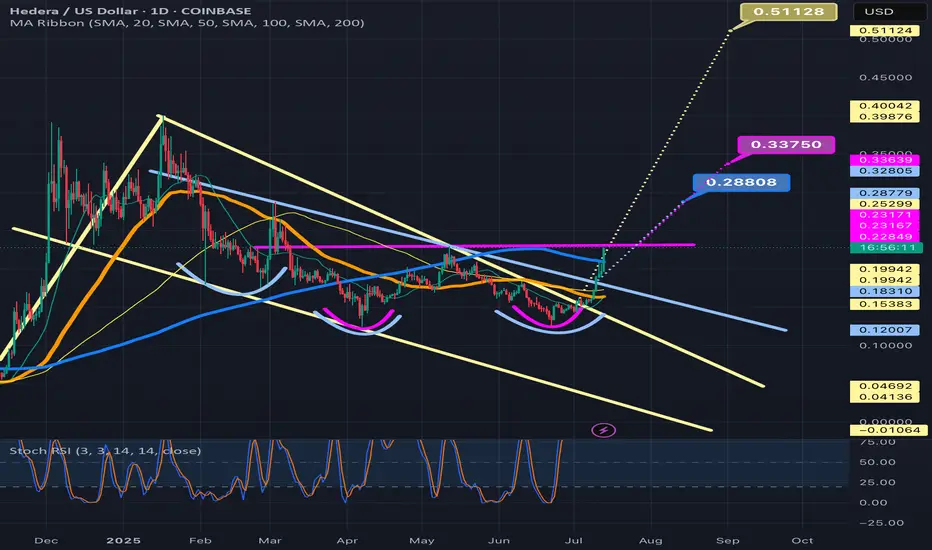
A linear Chart version of the current HBAR bull patternsIt just dawned on me that I had my chart on logarithmic for the previous 2 posts I amde about HBARUSD. As usual, the chart patterns on the log chart tend to have much higher breakout targets than the version of the chart patterns that appear on the linear chart. As soon as I realized this I went back in and adjusted the patterns to their linear chart erosions. The inverse head and shoulders remained mostly the same but the bullflag/desceding channel has now morphed into a falling wedge/bullish pennant. As you can see the breakout target for all 3 patterns is a much lower price than what the price targets were on the logarithmic chart. That’s not to say that the logarithmic targets are invalid, I think what will most likely occur Ike usually is both chart’s targets will be validated, it will likely just take much longer for the logarithmic chart’s targets to be reached as is how things usually pan out. *not financial advice*
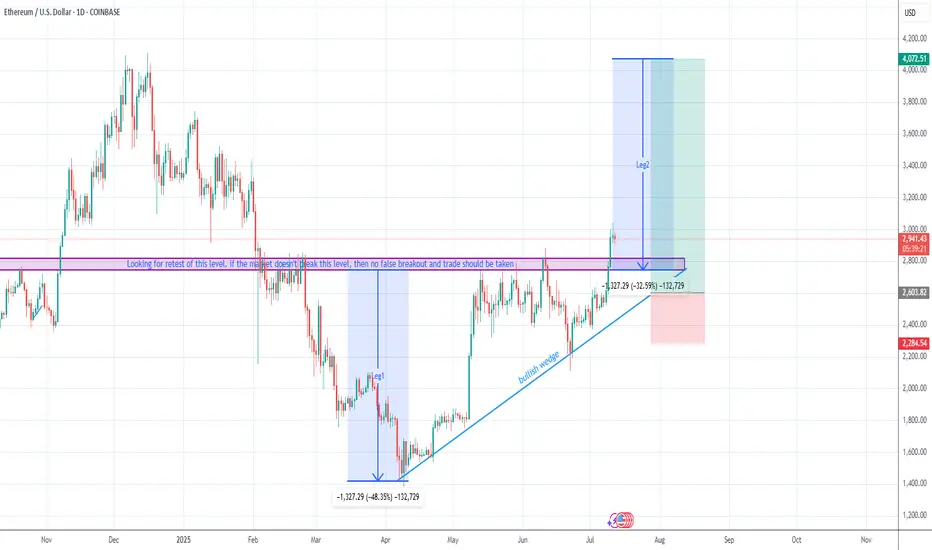
Wajani Investments: ETHUSD Analysis
ETHUSD has currently formed a triangle with a resistance broken to the upside. In most circumstances, I’ll like to wait for a retest of that resistance, i.e. resistance-becomes support to be sure that the breakout was not false. Once that level is tested and held, I’ll take a trade assuming Leg2 would have a similar move like Leg1. This is a very good trade with a 1:4 RR.
If you have any questions, feel free to ask. You can add or subtract from this idea.
Remember, trading always carries risks, and this is for EDUCATIONAL PURPOSES only.
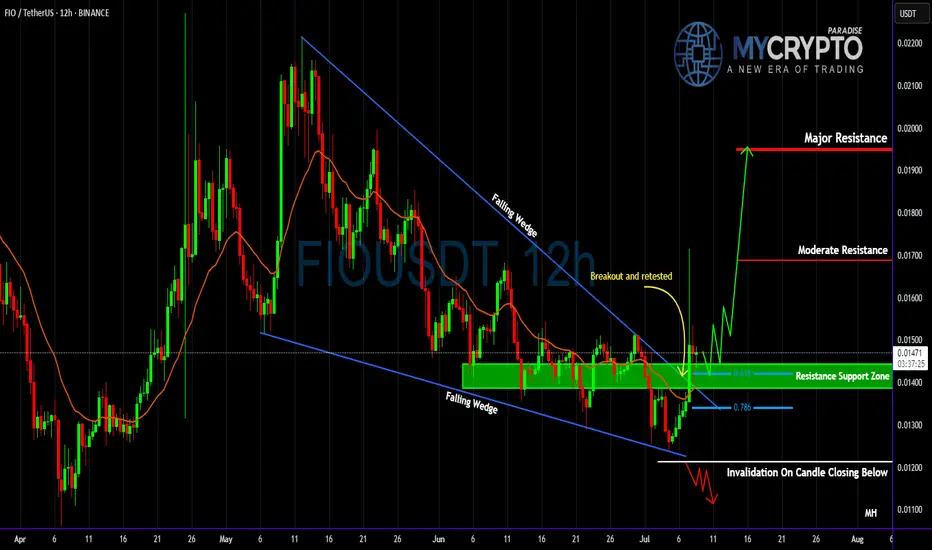
FIO Breakout: Is This the Calm Before a Massive Move or a Trap?Yello Paradisers! did you catch the breakout on #FIOUSDT or are you still sitting on the sidelines while opportunity unfolds? The recent move is shaping up to be a high-probability setup, but only for those who understand the market structure and know how to manage risk properly.
💎#FIO has been consolidating inside a well-defined falling wedge on the 12-hour timeframe—a pattern known for its bullish reversal potential. After weeks of compression, we finally saw a clean breakout to the upside, followed by a textbook retest of the wedge’s upper boundary. This breakout-retest sequence confirms that the previous resistance has now flipped into a support zone, a key technical signal we always monitor closely.
💎Adding further conviction to the setup, FIO is currently supported by multi-timeframe EMAs, acting as dynamic support. When combined with horizontal levels, these EMAs offer traders additional confluence and often indicate that the market is preparing for a stronger impulsive move. What’s particularly notable here is the alignment with key Fibonacci retracement levels. The price is holding just above the 0.618 retracement level—a golden pocket that often acts as a springboard in continuation setups. This creates a high-confluence support zone between 0.0139 and 0.0143, where bulls have a clear technical advantage.
💎To the upside, should keep a close eye on two major resistance zones. The first lies at 0.01689, which marks moderate resistance and the likely first target should bullish momentum continue. The next level of interest is 0.01950—identified as a major resistance zone. A break above that could open up significant upside potential, but we’ll stay measured and reactive based on how price interacts at each level.
💎On the other hand, the invalidation level is clearly defined. A candle closing below 0.01213 would invalidate the current bullish structure. If this level is breached, it’s a strong signal that the setup has failed and the risk needs to be cut immediately. No second chances there—discipline is key.
💎All in all, FIO has triggered a technically clean breakout from a falling wedge, retested the breakout zone, and is now forming a strong base above multiple supports. However, confirmation is always key. As long as it holds above the 0.0139–0.0143 support cluster, the bias remains bullish and the probability favors continuation to the upside.
We are playing it safe right now, Paradisers. If you want to be consistently profitable, you need to be extremely patient and always wait only for the best, highest probability trading opportunities.
MyCryptoParadise
iFeel the success🌴
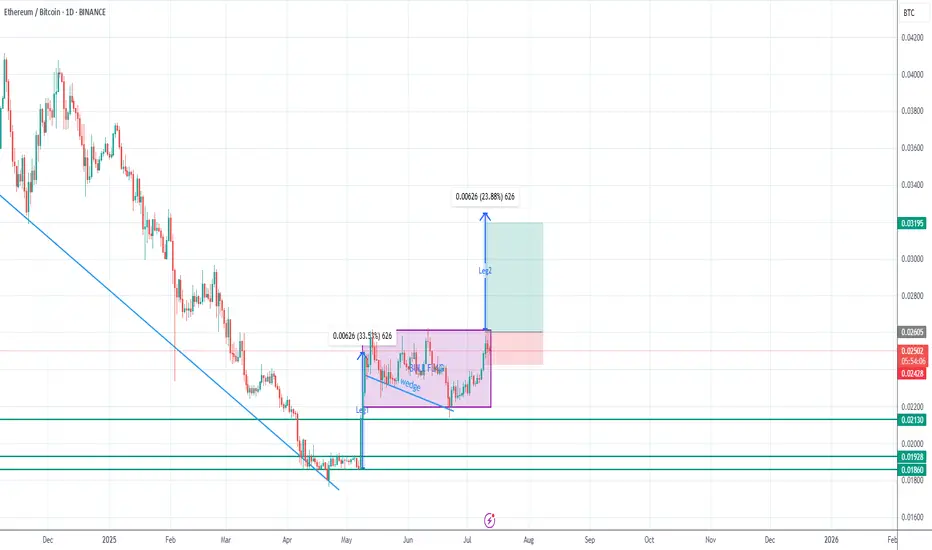
Wajani Investments: ETHBTC Analysis
ETHBTC has formed a bullish flag (rectangle) which signifies trend continuation. Aside from that, there’s a bullish wedge still supporting a move to the upside. This analysis shows we would have a Leg2 move like Leg1 and even higher. This is a good trade with a 1:3 risk.
Remember, trading always carries risks, and this is for EDUCATIONAL PURPOSES only.
Let me know your views.
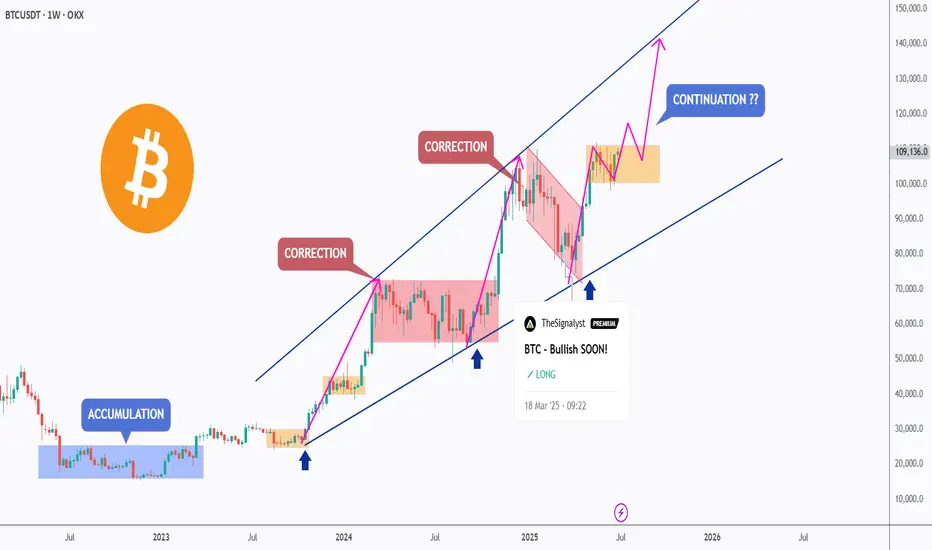
BTC – Bullish Continuation Ahead ?Bitcoin has been trading within a well-defined rising channel since mid-2023, respecting both upper and lower bounds beautifully.
After each impulsive move, we’ve seen healthy corrections followed by bullish continuations — a classic market structure in play.
🟦 Accumulation Zone: After a long accumulation phase, BTC kicked off a strong bullish cycle.
🟥 Correction Phases: Each major move was followed by a red correction zone before resuming the uptrend.
🟧 Current Phase: BTC is consolidating just below the upper channel boundary. A breakout above this zone could confirm the next bullish wave toward $140K+.
🔵 Key Observations:
Structure remains intact within the channel
Previous breakout zones now acting as support (blue arrows)
Continuation patterns are forming, signaling potential upside
🏹As long as the orange zone holds, BTC remains in a bullish structure, and a breakout would likely push us to new highs.
📍Will history repeat and BTC continue its journey toward the upper channel boundary? Let’s wait for confirmation!
💬 What’s your bias here? Are you bullish or waiting for a deeper pullback?
📚 Always follow your trading plan regarding entry, risk management, and trade management.
Good luck!
All Strategies Are Good; If Managed Properly!
~Richard Nasr
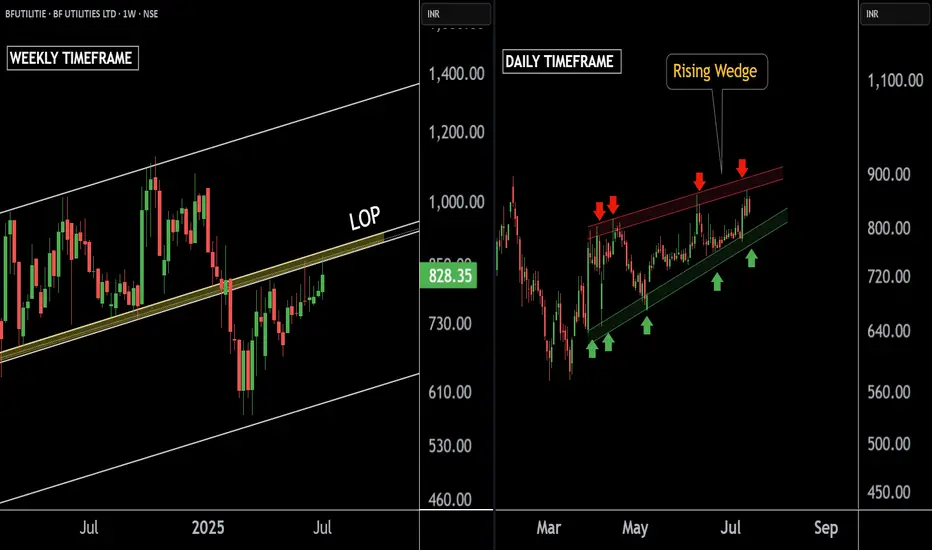
BF UTILITIES LTD 'S KEY LEVEL || BREAKDOWN OR BREAKOUT ??These are two charts of BF Utilities – one on the daily timeframe and the other on the weekly timeframe.
In the first chart : BF Utilities is sustaining near its Law of Polarity (LOP), which is acting as a resistance zone around the 880–890 range.
In the second chart : BF Utilities is forming a Rising Wedge pattern, with the resistance also lying in the 870–880 zone.
If this level is sustain ,then we may see lower price in BF Utilities.If this level is broken, the stock may move towards the upper boundary of the channel.
Thank you !!
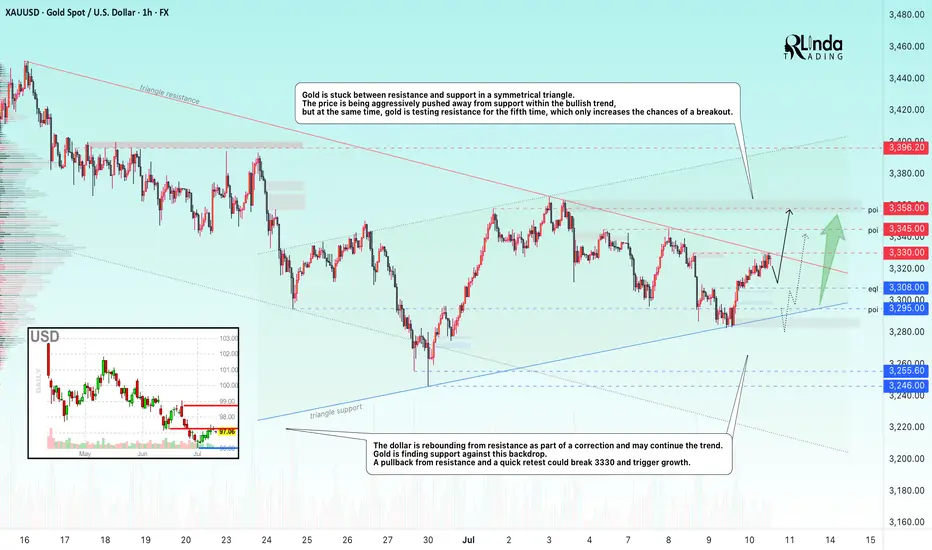
GOLD → Retest of consolidation resistance. Breakout?FX:XAUUSD is consolidating in a symmetrical triangle pattern. The price is stabilizing amid a falling dollar and uncertainty...
Gold is recovering after falling to $3,283 thanks to a weaker dollar and lower bond yields amid concerns over Trump's new tariff threats. The announced tariffs against seven countries, including Brazil and the Philippines, have heightened tensions, partially offsetting the Fed's hawkish signals. Markets are now awaiting new data from the US and speeches by Fed officials, which could influence the further dynamics of gold.
Technically, gold is squeezed between the resistance and support of a symmetrical triangle. The price is being aggressively pushed away from support within a bullish trend, but at the same time, gold is testing resistance for the fifth time, which only increases the chances of a breakout.
Resistance levels: 3330, 3345, 3358
Support levels: 3308, 3295
If gold continues to storm the local resistance at 3330 and the triangle resistance during consolidation, we will have a good chance of catching the breakout and growth. An additional scenario could be growth after a shake-up of the triangle support and the global trend.
Best regards, R. Linda!
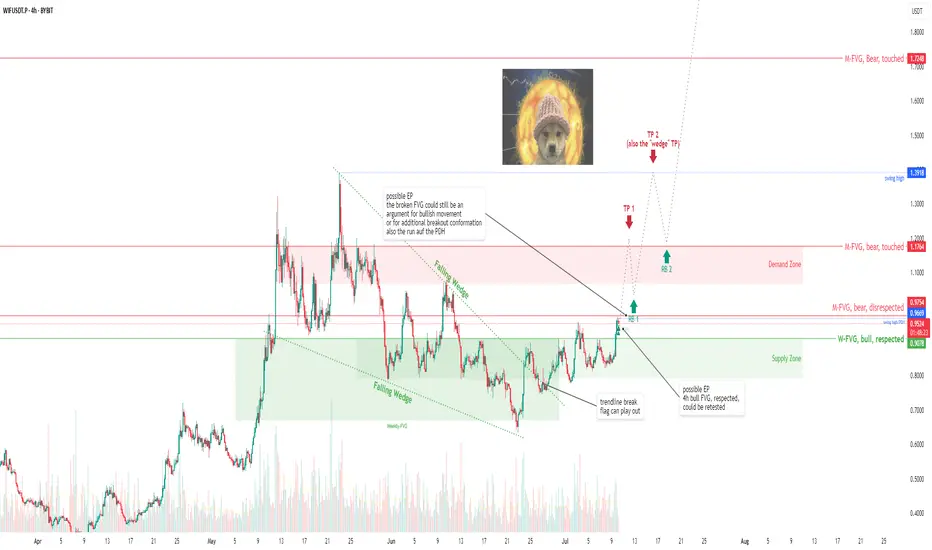
WIF/USDT: A dog wif hat lost faith but may become Pehoenix soon WIF/USDT: A dog wif hat lost faith but may become Pehoenix soon
after a long lasting crash WIF started a decent move again
was heavyly rejected
in consolidation since then
building a "Falling Wedge"
the supposed breakout happend
but there is still way more to come
For this one I'm not going to explain everything in detail what me made find my BIAS, narrative etc.
But at least enough Information that should be "useful" or "work you must not do buy yourself then".
That could be the beginning of a race back to at least baseline or somehow below.
For now, the trade is only planed to TP 1. Also im already in.
I stepped in cuz:
- there are several FVGs on several timeframes. The price is likely to play them out and should than react that way. I followed them and we should be bullish now. One good argument is that the weekly bullish FVG keeps nicely respected, while the bearish monthly FVG is actually struggeling.
- very bullish Price Action on WIF
- the TP from the "Falling Wedge" alone would be 1.3943
So TP1 + 2 got really much conflunce. And 3 as well, tru pressure from the market. Maybe even higher, but im not that far yet.
I closed a WIF trade that evening, did the analysis after that, and just opened it again without trigger :D
But there are triggers and u should use them:
RB 1+2+3
Price Action
pullbacks into FVGs on 1h f.e.
"Hammer" candles with high Volumen
break of structure on a LTF
That was the second Idea i made here ever. So i'm happy you made it that far, thank you.
Also feel free to comment the trade/the writing style, question, whatever.
Sugartongue, and my hunger is still young. But I'll chase lights until the morning comes. And the world is flashing at the window.
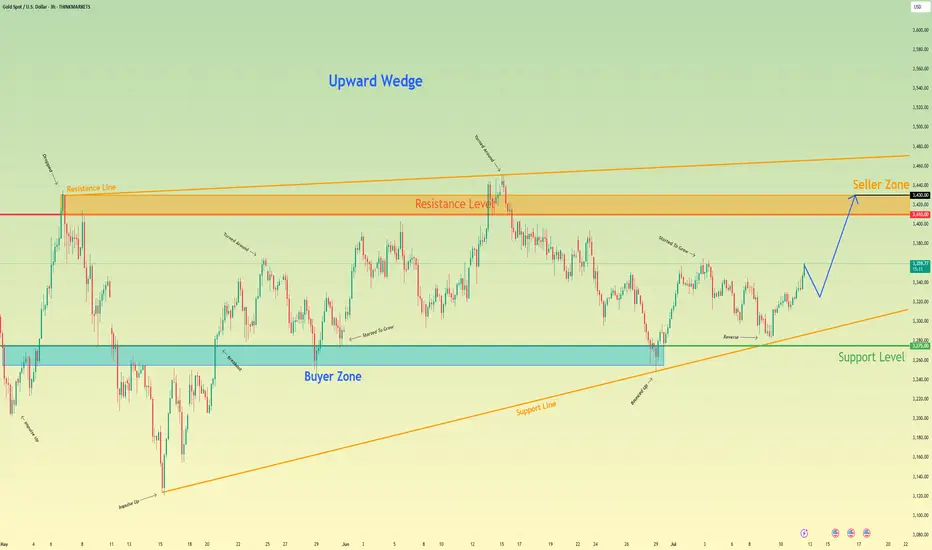
Gold can reach resistance level, break it and continue to riseHello traders, I want share with you my opinion about Gold. Recently, price formed a clean upward wedge pattern and is showing strong bullish behaviour. After bouncing off the support level at 3275, the price entered the buyer zone (3255 - 3275) and reversed with a confident impulse up, signalling renewed interest from buyers. From there, price has consistently respected the support line, printing higher lows and slowly climbing back toward the resistance level at 3410. This level has acted as a significant rejection area before, but this time, the structure looks stronger. Each pull-back has been shallow, and buyers are stepping in faster. The momentum is slowly building. Now the price is trading just below resistance and moving with a bullish trajectory. I expect Gold to continue its climb, first reaching the Resistance Level, and then targeting the seller zone (3410 - 3430). That’s why I’ve set my TP at 3430 points - right inside this upper area where I anticipate profit-taking and potential reversal. Given the bullish pattern structure, the wedge formation, and the strength of recent impulses, I stay bullish and expect further growth in the coming sessions. Please share this idea with your friends and click Boost 🚀
Disclaimer: As part of ThinkMarkets’ Influencer Program, I am sponsored to share and publish their charts in my analysis.
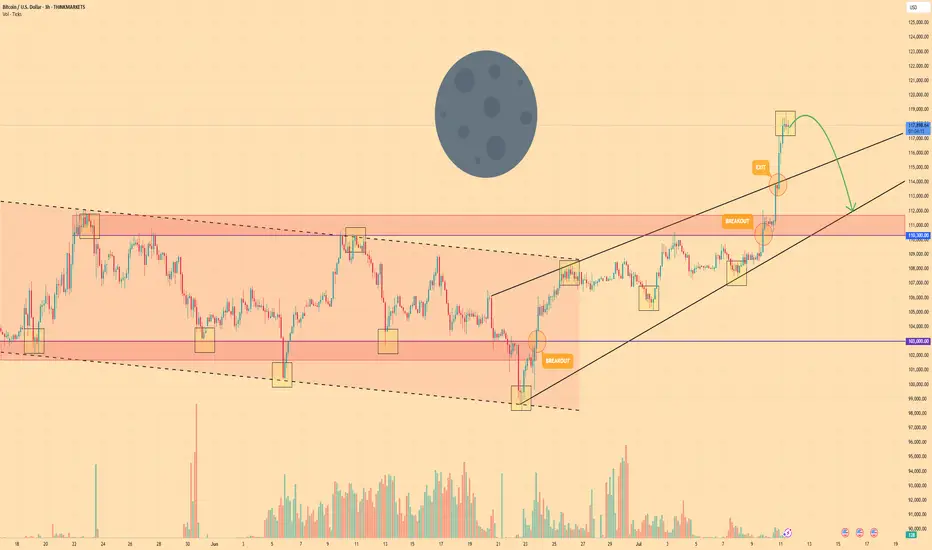
BITCOIN - Price can go into correction after reaching new ATHHi guys, this is my overview for BTCUSD, feel free to check it and write your feedback in comments👊
Bitcoin spent weeks confined to a tight falling channel, carving out a series of lower highs and lower lows as sellers maintained full control of the market.
The breakout above $110300 ignited a powerful rally, propelling BTC into an ascending wedge formation and driving price sharply higher toward a fresh all-time high at $118800.
Once the ATH was reached, selling pressure reasserted itself, halting further upside and triggering a loss of bullish momentum.
This lightning-fast climb to $118800 appears to have drained buyer enthusiasm.
Key support now resides around $110300 - $111700, backed by the wedge base.
Given the exhaustion of buyers and the clear wedge resistance, I anticipate BTC to retrace toward the $112000 area following its recent surge.
If this post is useful to you, you can support me with like/boost and advice in comments❤️
Disclaimer: As part of ThinkMarkets’ Influencer Program, I am sponsored to share and publish their charts in my analysis.
GBPUSD set for a move lower?Table is set! The GBPUSD is in a rising wedge, with the test (today) of the 61.8% Fibonacci level once again and now ascending wedge support and horizontal support as well. A break of the 1.3530 would put the 1.3440 breakout point (high from Sept 2024) and a possible breakdown back below the 1.3370 level. Bulls should be cautious with this technical setup.

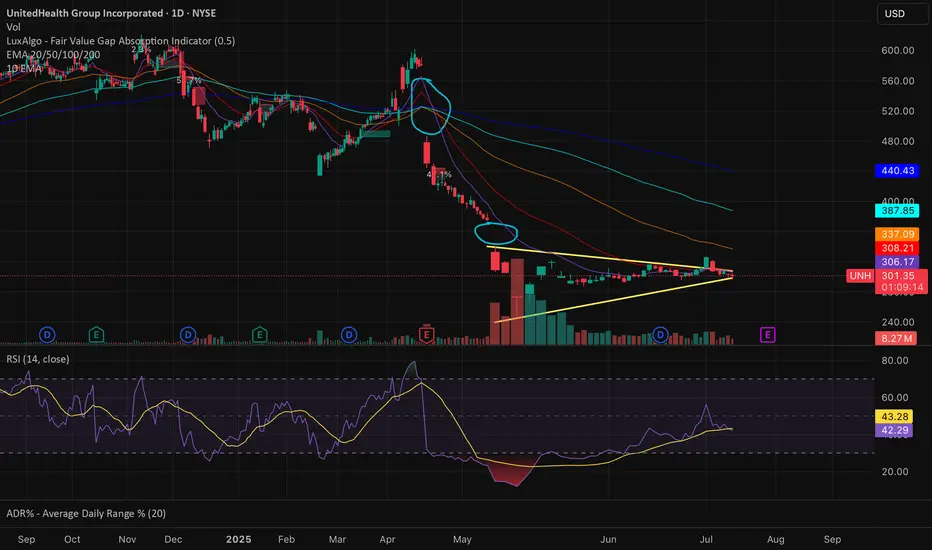
UNH setting up for a big moveUNH wedge... gaps to fill... obviously some uncertainty and earlier tried to break out, but an eventual breakout to the upside is written on the wall