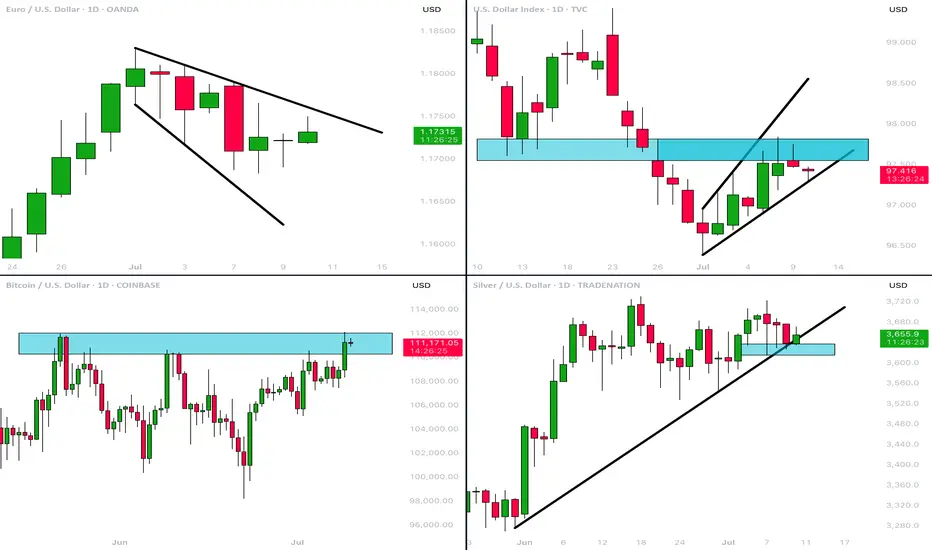
MarketBreakdown | EURUSD, DOLLAR INDEX, BITCOIN, SILVER
Here are the updates & outlook for multiple instruments in my watch list.
1️⃣ #EURUSD daily time frame 🇪🇺🇺🇸
The price started a correctional movement after it updated
a high the first of July.
The market formed a bullish flag pattern.
Your next trend-following bullish signal will be a breakout and a daily
candle close above its resistance.
2️⃣ Dollar Index #DXY daily time frame 💵
The market corrects in a bearish flag pattern.
I see a test of a significant horizontal resistance cluster now.
Your signal to see will be a bearish violation of a support
of the flag and a daily candle close below.
3️⃣ #BITCOIN #BTCUSD daily time frame
Though the price managed to update the All-Time High
yesterday, the market did not manage to close above
a current major resistance.
I believe that we will see another attempt of the market to breakthrough.
Your bullish confirmation will be a daily candle close above the underlined resistance.
4️⃣ #SILVER #XAGUSD daily time frame 🪙
The price reached an important confluence demand zone
based on a rising trend line and a horizontal key structures support.
Probabilities will be high to see a bullish movement from that.
Do you agree with my market breakdown?
❤️Please, support my work with like, thank you!❤️
I am part of Trade Nation's Influencer program and receive a monthly fee for using their TradingView charts in my analysis.
Wedge
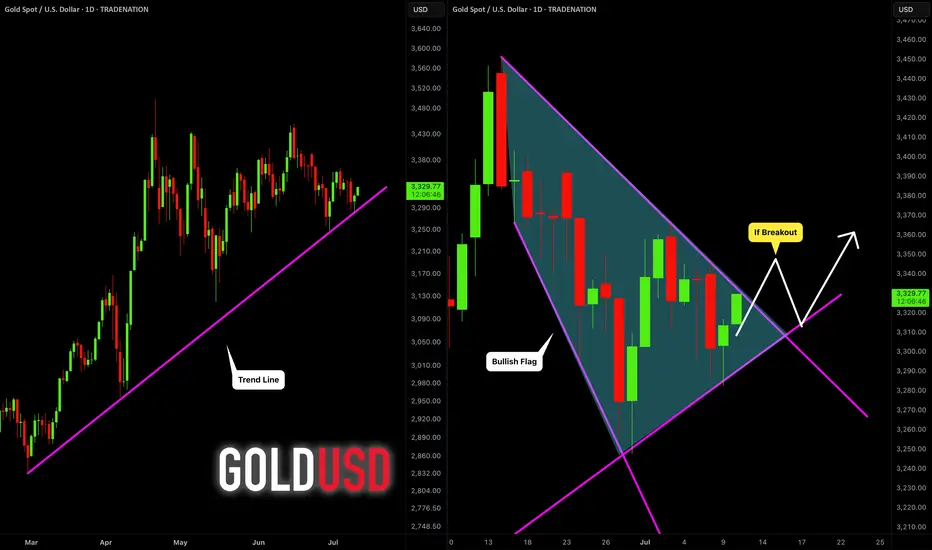
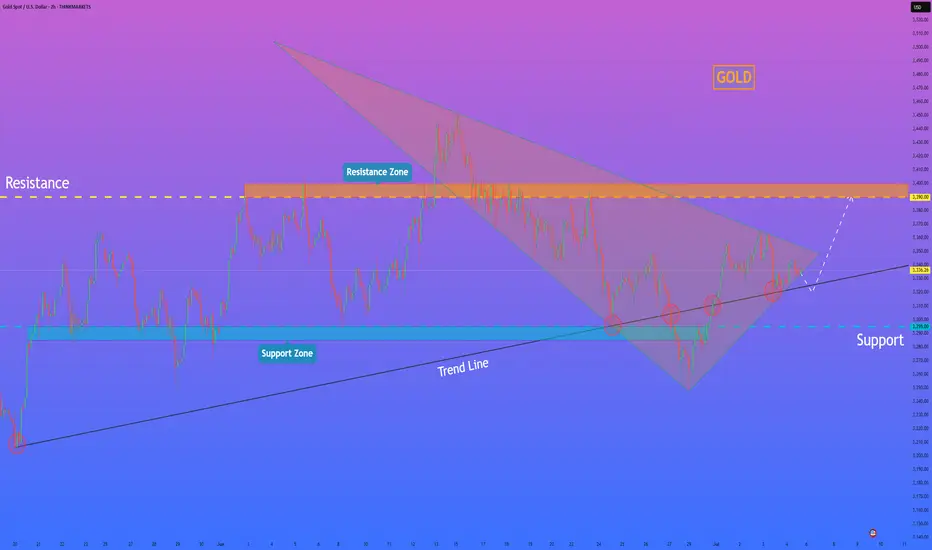
GOLD (XAUUSD): Important Decision Ahead
As I predicted, Gold went up from a trend line yesterday.
The price is now testing another trend line - a falling resistance
of a bullish flag pattern.
The next reliable bullish signal that you can look for is its
bullish breakout and a daily candle close above that.
A bullish move is going to follow then.
❤️Please, support my work with like, thank you!❤️
I am part of Trade Nation's Influencer program and receive a monthly fee for using their TradingView charts in my analysis.
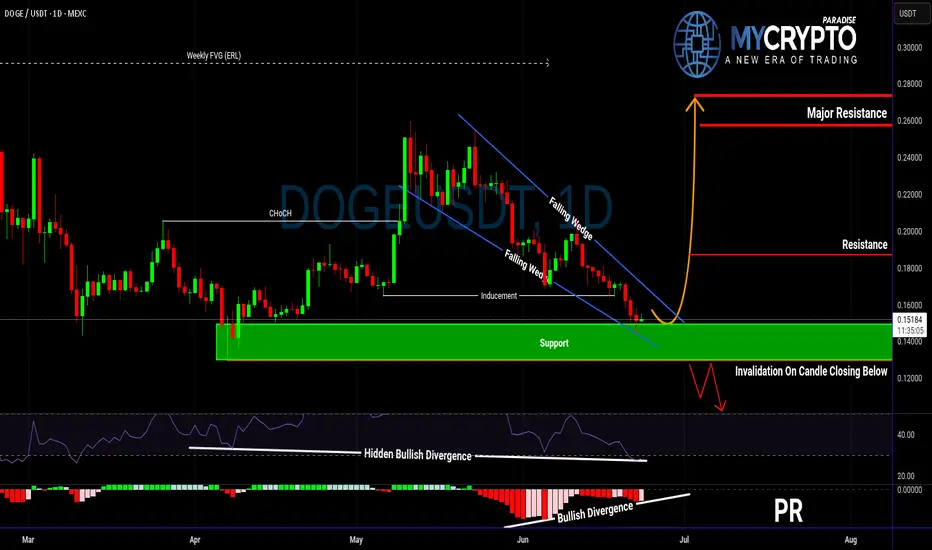
Is DOGE About to Explode or Collapse?Yello Paradisers! Are you ready for what could be DOGE’s most explosive move in weeks? DOGEUSDT is currently developing a very interesting bullish setup that deserves attention.
💎The pair has formed a falling wedge — a pattern that often precedes a breakout to the upside. This comes right after a confirmed bullish Change of Character (CHoCH), indicating that buyers are quietly stepping back in.
💎Even more important, we’ve seen a classic inducement grab, meaning early liquidity has been taken out, clearing the way for a potential real move. On top of that, there’s hidden bullish divergence on the RSI and clear bullish divergence on the MACD. This combination of signals significantly increases the probability of a bullish reversal from the current support zone.
💎If DOGE prints a convincing bullish candlestick pattern at these levels, it could offer a high-probability long opportunity with a strong risk-to-reward ratio. But be careful — if the price breaksdown and closes candle below this key support, the bullish scenario becomes invalid, and it’s better to wait for a more favorable structure to develop.
Strive for consistency, not quick profits. Treat the market as a businessman, not as a gambler. This is the only way you will make it far in your crypto trading journey. Be a PRO.
MyCryptoParadise
iFeel the success🌴
MeghaHorn or BowTie Pattern !!!Key Observations:
Pattern Formation:
A broadening wedge or megaphone pattern (also likened to a bow tie) is forming.
Price is oscillating between expanding trend lines.
Labeled waves: 1, 2, 3, 4, 5 within the pattern.
Critical Zones:
Buy Above: $2,815.98 (upper boundary of the wedge).
Sell Below: $2,258.03 (lower boundary of the wedge).
No Trading Zone: Between $2,258 – $2,815 (uncertainty/consolidation area).
Price Target:
If price breaks below, Target 1 is indicated around $1,800 or below (implied from structure).
Current Price:
Trading at $2,748.56, up +5.05%, within the “No Trading Zone”.
Summary:
The chart suggests waiting for a breakout or breakdown from the wedge pattern to determine the next move. A breakout above $2,815 could signal a buy opportunity, while a breakdown below $2,258 could trigger a sell with a potential target near $1,800.
Ask ChatGPT

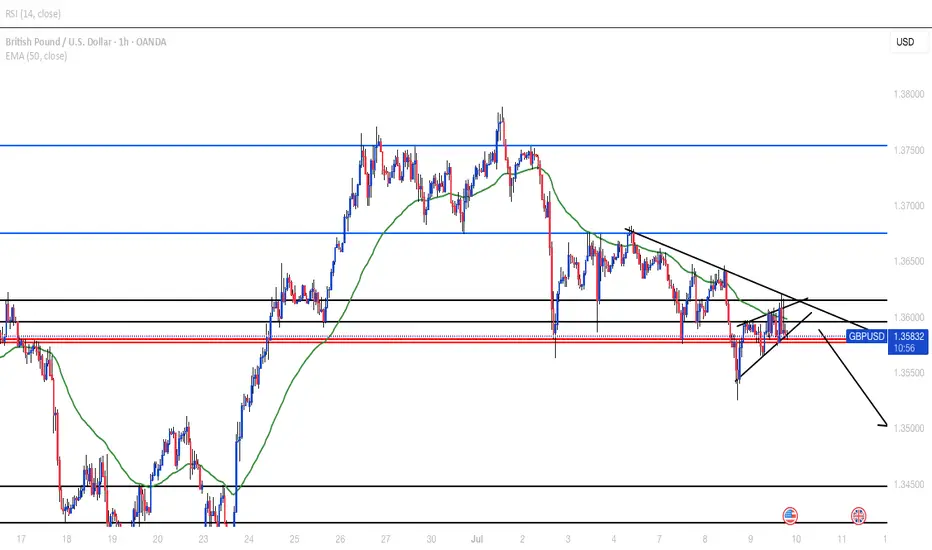
GBPUSDPrice reached a major weekly resistance and started selling with the daily giving a strong bearish engulfing last week. H4 formed a double top and started creating lower highs. H1 has formed a third bearish wedge. Waiting for clear breakout to look for shorts. Watch out for fundamentals this week.
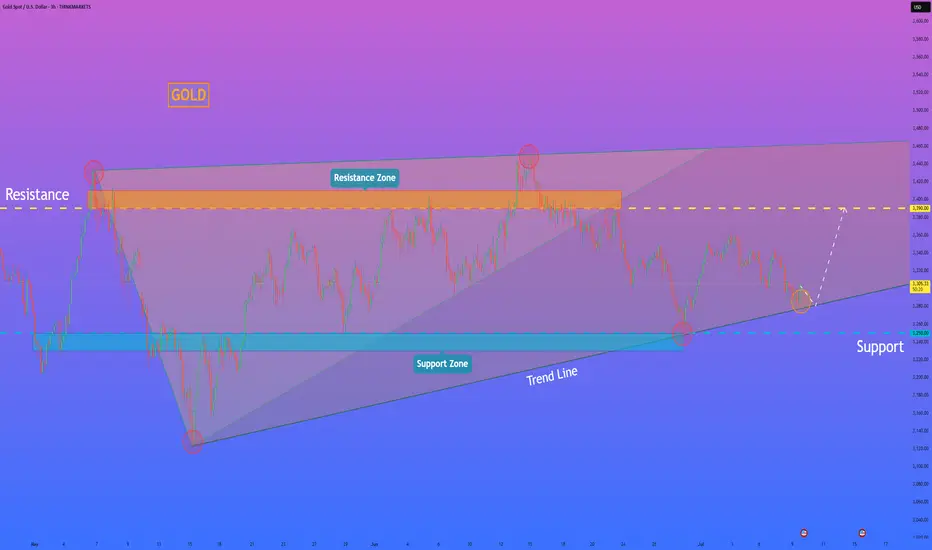
HelenP I. Gold can rebound from trend line and start to move upHi folks today I'm prepared for you Gold analytics. In this chart, we can see that gold has formed a clear wedge pattern, and within it, we can also observe a smaller triangle forming. This structure reflects a narrowing price range and growing tension between buyers and sellers. After testing the upper boundary near the resistance zone at 3390 - 3410 points twice, gold started moving lower and now approaches the trend line again. This level has already held as support multiple times, and each time the price touched it, it showed a rebound with renewed buying interest. Now the price is again trading near this trend line, around the 1300s area, and a small triangle has formed inside the larger wedge. This triangle may act as a base for the next upward movement. I believe that as long as gold respects this trend line and doesn’t break below the 3250 - 3230 support zone, the probability of upward continuation remains strong. My current target is the 3390 resistance level, which aligns with the top boundary of both the wedge and the resistance zone. A breakout above the triangle may give the price enough momentum to approach this area again. That’s why I remain bullish in this situation and expect a bounce from current levels, followed by an upward move toward the resistance. If you like my analytics you may support me with your like/comment.❤️
Disclaimer: As part of ThinkMarkets’ Influencer Program, I am sponsored to share and publish their charts in my analysis.
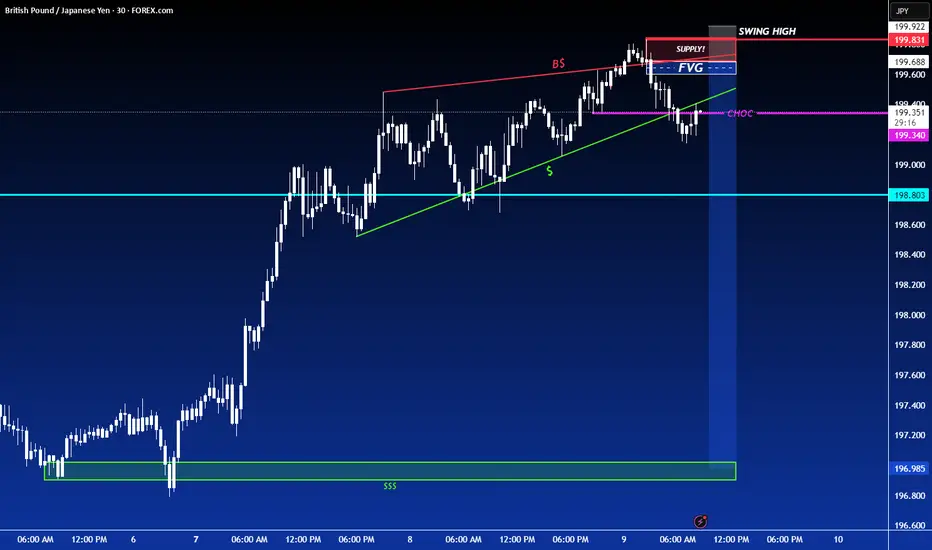
SHORT ON GBP/JPYGJ currently has broken a strong low of a rising wedge pattern (which is a bearish reversal pattern.
I am waiting for price to hit the supply zone before entering for a sell.
So a sell limit order will need to placed at the supply zone to take advantage of this opportunity.
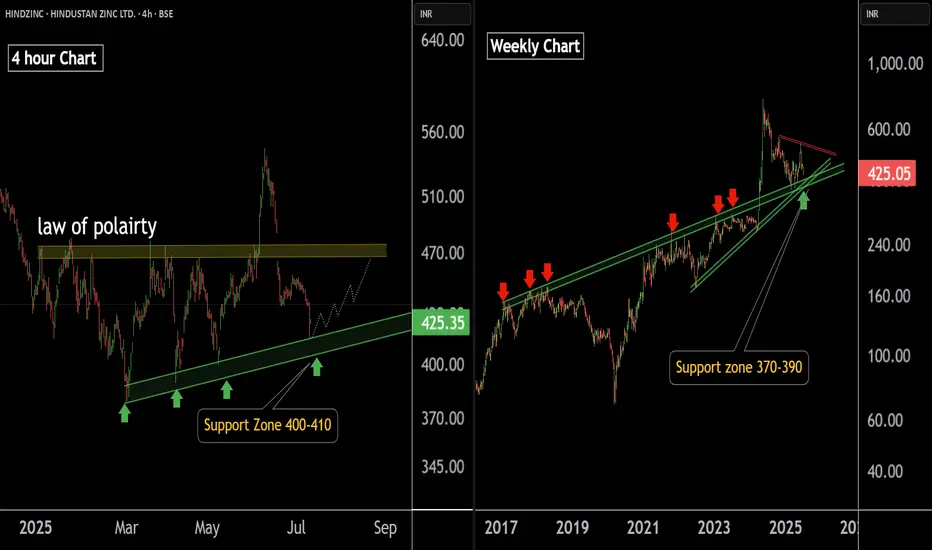
HINDUSTAN ZINC LTD at Best Support !!There are two charts of Hindustan Zinc — one on the 4-hour time frame, and the second on weekly time frame.
Chart 1 (4-Hour Timeframe):
The stock is moving in a Higher High, Higher Low (HH-HL) structure, indicating a bullish trend.
Support zone is observed near the 400–410 range.
Chart 2 (Weekly Timeframe):
On the weekly chart:
the stock is approaching a major support zone in the range of ₹375 – ₹390, which has historically held strong.
If this level is sustain then we may see higher prices in HINDZINC.
Thank You !!
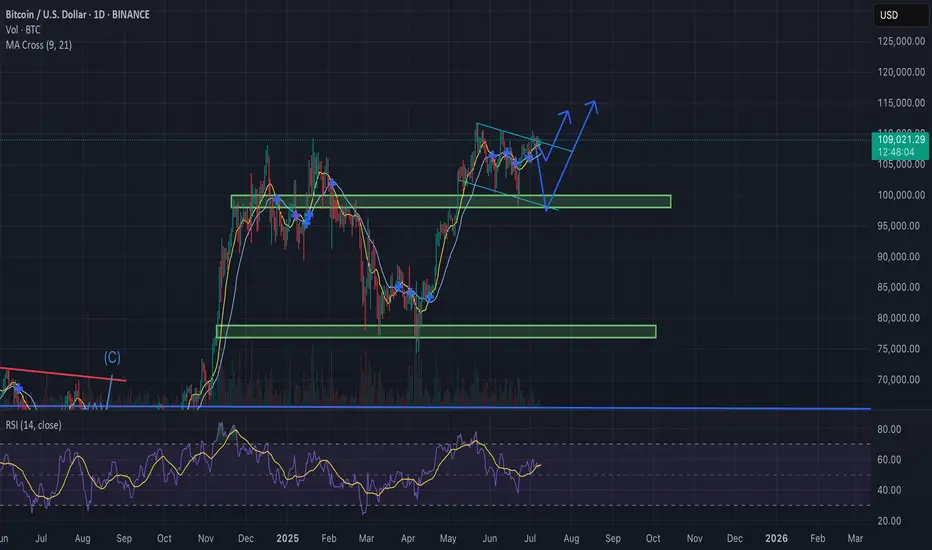
Bitcoin Update – Bullish Falling Wedge in Play?BTC/USD is currently trading near $108.8K, compressing within a falling wedge formation — historically a bullish continuation pattern, especially after a strong uptrend.
Why the Bias Remains Bullish:
Bullish MA Cross: Short-term MAs (9/21) are aligned for upside momentum.
Falling Wedge: Price compressing with lower highs and lows, coiling for a breakout.
RSI Strength: RSI (purple) remains elevated, supporting continued upside pressure.
Fundamental Catalysts:
Trump delays trade war announcements, reducing global uncertainty.
FOMC meeting in late July: Trump pushes for rate cuts, potentially bullish for risk assets like BTC.
If BTC breaks out above the wedge resistance with convincing volume:
Retest likely at ~$110K
Targets : $115K → $120K+
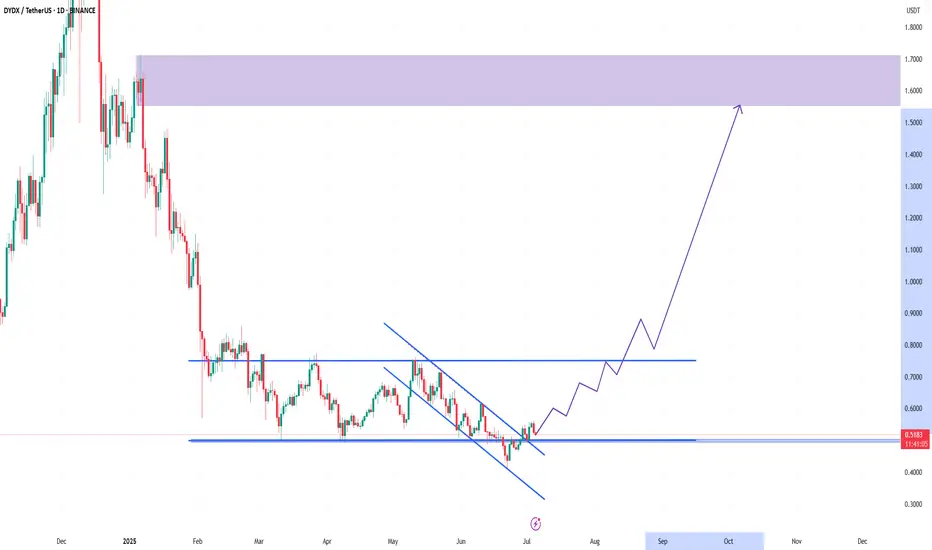
DYDX Breakout from Falling Wedge | Targeting $1.60+# DYDX Breakout from Falling Wedge | Targeting $1.60+
📈 **DYDX/USDT Analysis – Daily Timeframe**
DYDX has just broken out of a falling wedge pattern – a classic bullish reversal formation – after holding a strong support zone around **$0.50**. This zone has acted as a reliable demand area for several months.
---
🔍 **Technical Highlights:**
- ✅ Falling wedge breakout confirmed with daily candle close above resistance
- 🟢 Strong support at $0.50–$0.52
- ⚠️ Horizontal resistance at $0.75 may act as a short-term barrier
- 🚀 Potential rally toward major resistance at **$1.60–$1.70** (target zone)
---
🎯 **Profit Targets:**
- First Target: **$0.75**
- Final Target: **$1.60 – $1.70**
❌ **Invalidation (Stop-loss idea):**
- If price breaks below $0.48 with volume, the bullish scenario may be invalidated.
---
📊 This setup is based on breakout structure and potential trend reversal. If volume confirms, this could be the beginning of a new mid-term uptrend.
💬 Let me know what you think about this setup! Would love to hear your feedback.
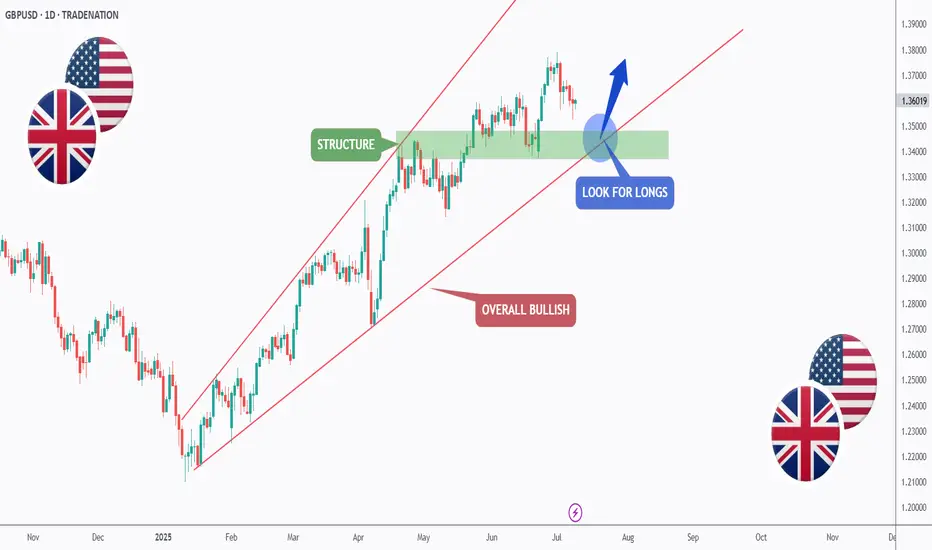
GBPUSD - Macro Trend Continues!Hello TradingView Family / Fellow Traders. This is Richard, also known as theSignalyst.
📈GBPUSD has been overall bullish trading within the rising channel marked in red. And it is currently retesting the lower bound of the channel.
Moreover, the green zone is a strong structure.
🏹 Thus, the highlighted blue circle is a strong area to look for buy setups as it is the intersection of the lower red trendline and structure.
📚 As per my trading style:
As #GBPUSD approaches the blue circle zone, I will be looking for bullish reversal setups (like a double bottom pattern, trendline break , and so on...)
📚 Always follow your trading plan regarding entry, risk management, and trade management.
Good luck!
All Strategies Are Good; If Managed Properly!
~Rich
Disclosure: I am part of Trade Nation's Influencer program and receive a monthly fee for using their TradingView charts in my analysis.
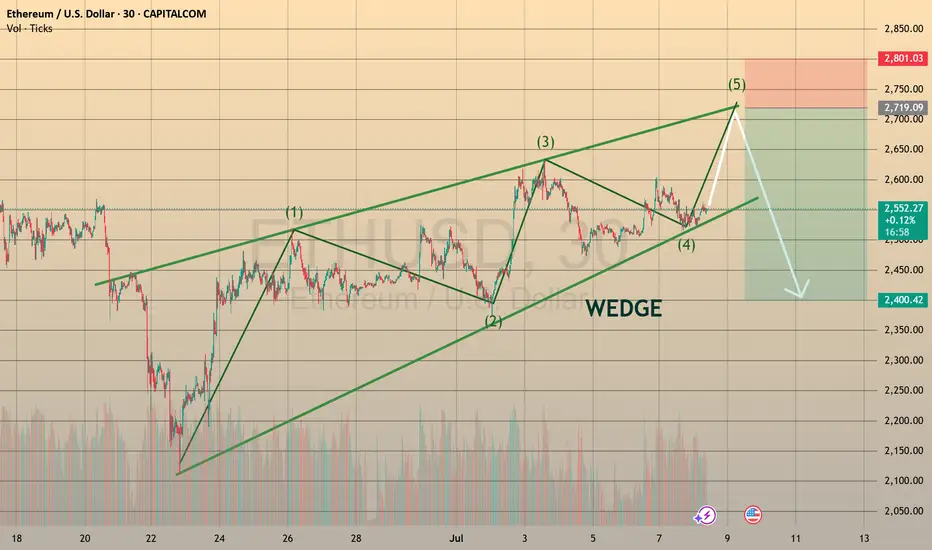
ETHUSD SHAPING THE BEARISH WEDGE, READY TO DECLINE
Ethereum has been forming the bearish wedge since the June 23th. The asset goes precisely according to Elliot 5-waves formation and is currently starting the wave E, rebounding from the lower border of the chart pattern.
What a trader may do?
We may go aggressive and trade long right immedia CAPITALCOM:ETHUSD tely with a take profit slightly below the 2,700.00 resistance level
🔼 a market buy order at 2544.19 with
❌a stop loss at 2489.90 and
🤑a take profit at 2691.35,
risk-reward ratio is 1:2.71 (nice one!)
However, I prefer to stay conservative and wait till the price tests the 2,700.00 level and enter the position there with
🔽 a pending sell stop order at 2691.35 with
❌a stop loss at 2759.92 and
🤑a take profit at 2409.89
risk-reward ratio here will be 1:4.1 (even better!)
In mid-term, I still expect ETHUSD to trade within a 2,400.00-2,700.00 range. So after assets reaches the 2,400.00, could be reasonable to look for new long opportunities! But will see.
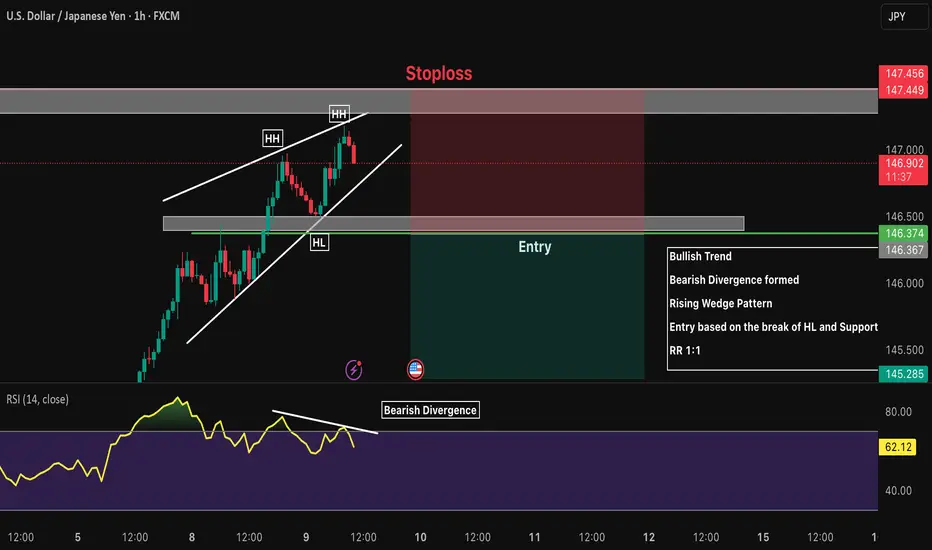
USDJPY 1H Short Bullish Trend
Bearish Divergence formed
Rising Wedge Pattern
Entry based on the break of HL and Support
RR 1:1
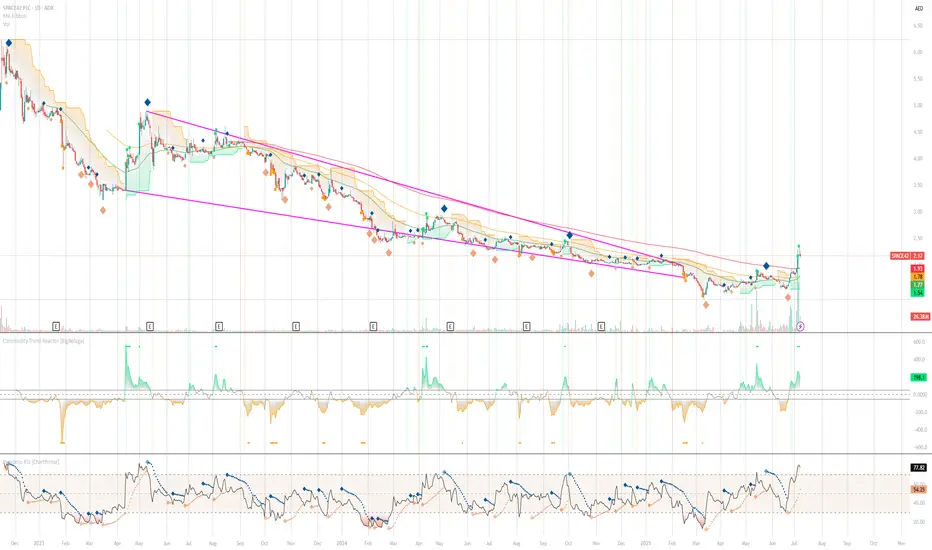
Wedge Watch: SPACE42 Poised for Liftoff from Falling Orbit?
➤ 📈 RECOMMENDATION: BUY (Speculative)
➤ 🔍 REASONING:
📉 Chart Pattern: This is a falling wedge — a classic bullish pattern often seen at the end of a downtrend.
🚀 Bullish Signal: A breakout above the upper wedge line 📈 typically signals the start of an **uptrend**.
📊 Volume: Look for increasing volume** on the breakout 🔊 — this confirms momentum.
📐 Trend Structure: The narrowing price range with higher lows = buyers are stepping in gradually 💪.
🛠️ Action Strategy:
🟢 Entry: Buy on breakout above the upper trendline.
🛡️ Stop-loss: Just below the recent swing low inside the wedge.
🎯 Target: Take the height of the wedge and project it upward from the breakout level.
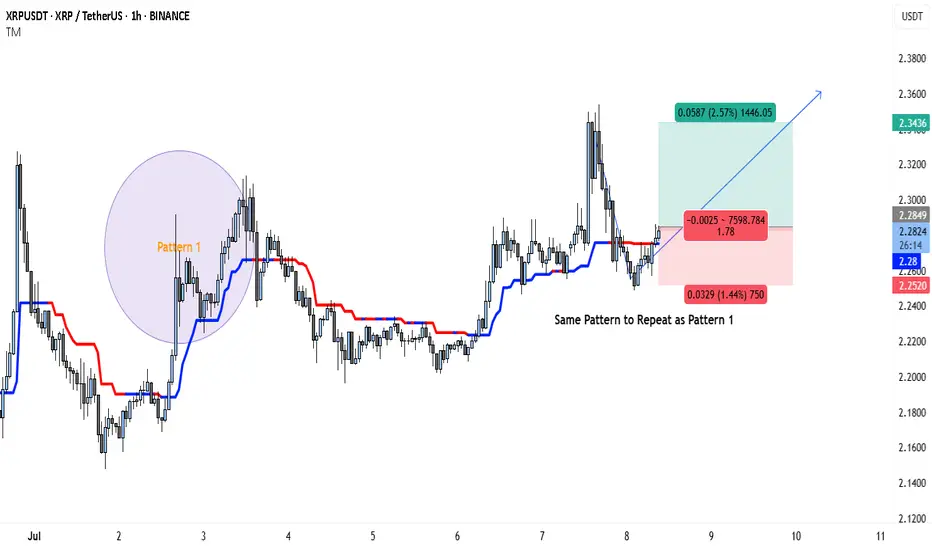
XRP Pattern Repeats—Next Move to $2.34?The XRP/USDT 1-hour chart is showing a compelling setup that may mirror a previously bullish price pattern. The left side of the chart highlights Pattern 1, which played out after a period of sideways consolidation followed by a breakout, resulting in a strong upward move. Now, price action is repeating a similar structure with nearly identical conditions forming.
In Pattern 1, XRP consolidated in a tight range, flipped the trend indicator from red to blue (suggesting a momentum shift), and then surged higher. This same transition is occurring again in the current market phase. Price has reclaimed the trend baseline, which has turned blue, hinting at growing buyer strength.
The idea here is that XRP could be preparing for another impulsive move to the upside, identical to what happened before. The setup is visually marked with a trade box showing entry, stop-loss, and target levels.
Trade Idea Based on Current Pattern
• Entry: 2.2849
• Target: 2.3436
• Stop-loss: 2.2520
• Reward-to-Risk (R:R): ≈ 1.78
• Potential Gain: 2.57%
• Potential Loss: 1.44%
The structure favors a long position, as long as the price holds above the 2.25–2.26 support range. A break below this could invalidate the setup and trigger the stop-loss. If the breakout is confirmed with volume, XRP could move rapidly toward the 2.34 level and possibly beyond.
This kind of fractal behavior, where patterns repeat themselves in similar market conditions, is common in crypto. With the trend indicator already flipping bullish and price forming higher lows, the probability of continuation looks solid—especially for short-term traders.
As always, trade with proper risk management, and be cautious of volatility that can trigger stop-hunts in tightly ranged zones.
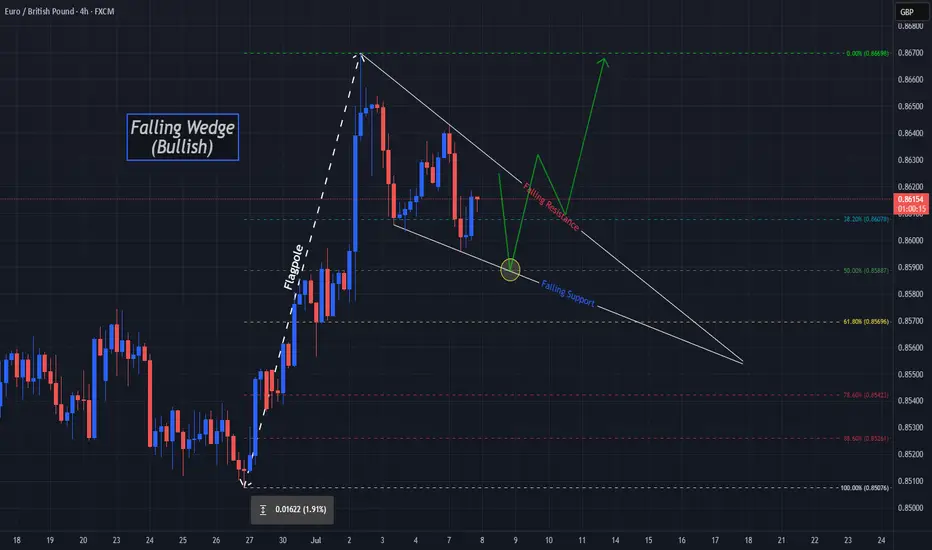
Bulls Could "Wedge" Their Way Into Higher Prices On EGOANDA:EURGBP has made some impressive moves up since the Low from May 29th and Price just fell short of the Highs of April 11th before falling into a very familiar Bullish Pattern, the Falling Wedge!
The Falling Wedge is typically a Bullish Pattern where we expect Price to give us a Bullish Break of the Falling Resistance and Successful Retest of the Break before Price heads Higher!
Wedge Patterns can play both Reversal and Continuation Patterns dependent upon the location they form and surrounding Major Support/Resistance or Highs/Lows. In this case, we will be looking for a Continuation with Price being in an Uptrend before pausing slightly for a Consolidation Phase to form the "Triangle" of the Pattern.
*It is important to note that both the Falling Resistance and Falling Support have only been tested twice where three tests of both Trendlines should point to a strong equilibrium from both Bears and Bulls, validating the legs of the Triangle and strengthening the Consolidation Bias. ( So we could see Price test the Falling Resistance one last time before falling down to the Falling Support for a 3rd test! )
Lastly, when it comes to a Wedge Pattern, we should suspect that once Price makes a 3rd Test of the Falling Support and Retraces to the 50% Fibonacci Level @ .85887, this will signal the End of the Consolidation Phase!
- And this will be the time to enter!
**Once the Pattern is Confirmed and Breakout is Validated, based on the "Flagpole" or Rally prior to Price falling into the Consolidation Phase we can anticipate Price to potentially rise to the most recent High on April 11th of .87374 and give the next Previous High on November 16th 2023 of .87657 a try!
Fundamentally, news is light this week for both currencies in the pair with GDP m/m releasing for GBP on Friday, July 11th with a Forecast of .1%, a .4% increase from June's -.3%
Also, CPI y/y for GBP will be released the following week on Wednesday, July 16th.
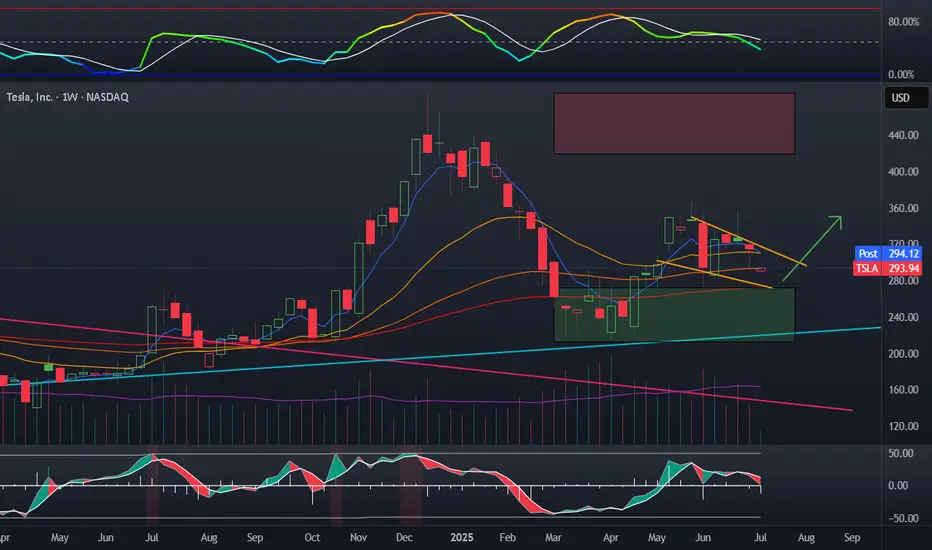
TSLA consolidation before expansionTesla despite being effected once again by fud is ready to pop. Average volume is up, a bear flag has played out, and oscillators reset. This 55 EMA on the weekly is a nice DCA zone. A bounce here or around 270 is likely. I think we see another try at 350 in coming weeks.
My plan:
Averaging down on TSLL, in CSP, already captured a few rounds of covered calls
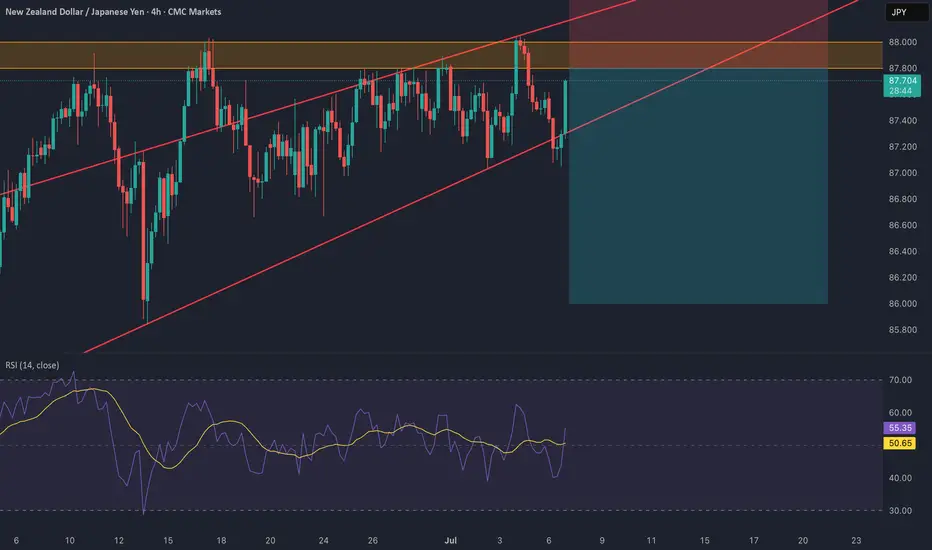
NZD/JPY: Bearish Wedge Before RBNZ CatalystThis is a high-conviction trade idea for NZD/JPY , where a perfect storm of technical and fundamental factors is aligning for a significant short opportunity. The setup is clean, the reasoning is strong, and we have a clear catalyst on the horizon. 🚀
Fundamental Analysis 🌪️
The macro picture is the primary driver here, creating a powerful bearish case.
1️⃣ Monetary Policy Divergence (🇳🇿 vs 🇯🇵): This is the core engine of the trade. The Reserve Bank of New Zealand (RBNZ) is dovish, signaling rate cuts amid a fragile domestic economy. In stark contrast, the Bank of Japan (BoJ) is hawkish, having started a historic policy normalization to combat persistent inflation. This fundamental clash is strongly bearish for NZD/JPY.
2️⃣ Risk-Off Catalyst (🇺🇸): The market is nervous ahead of the July 9th US tariff deadline . This uncertainty is creating a classic "risk-off" environment, which typically strengthens the safe-haven JPY and weakens risk-sensitive currencies like the NZD.
3️⃣ The RBNZ Decision (🏦): The main event on July 9. The market expects a "dovish hold," meaning even if rates are unchanged, the forward guidance will likely be very cautious, highlighting economic risks and signaling future cuts. This is the catalyst that could trigger the sell-off.
Technical Analysis 📉
The 4H chart provides crystal-clear confirmation of the fundamental weakness.
1️⃣ Bearish Rising Wedge: Price is being squeezed into a classic bearish reversal pattern. This shows that buying pressure is exhausted, and the market is preparing for a move to the downside.
2️⃣ Key Resistance Zone: The wedge is pushing directly into a heavy supply zone between 87.80 and 88.00 . This area has acted as a firm brick wall 🧱, rejecting multiple attempts to move higher.
3️⃣ RSI Momentum: The RSI below the chart confirms the weakening momentum. It's failing to show strong bullish power, which supports the price action and signals that the uptrend is running out of steam. 💨
The Trade Plan 🎯
Based on this analysis, the plan is to enter with a limit order to get an optimal entry price on a potential final spike into resistance.
Direction: Short (Sell) 📉
Order Type: Limit Sell
Entry: 87.80 📍
Stop Loss: 88.40 🛡️
Take Profit: 86.00 💰
Risk/Reward Ratio: 1:3 ⭐⭐⭐
This setup presents a rare confluence of fundamental divergence, technical weakness, and a clear catalyst.
Trade safe and manage your risk.
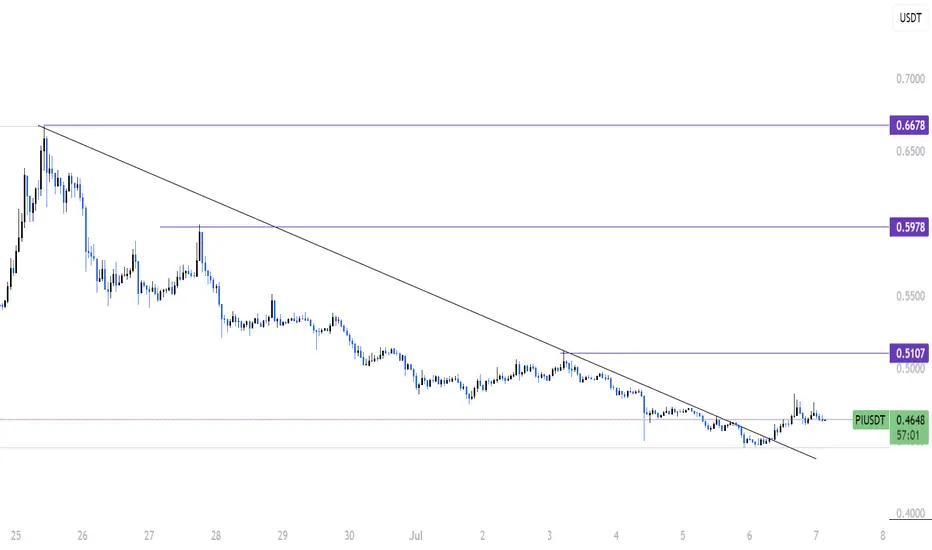
PI breakout from wedge and Trendline !!🚨 PI Breakout Update 🚨
Hey traders, hope you're all doing great!
Looks like PI just broke out of a strong trendline, and things are getting interesting.
We’ve seen solid support holding for a while, and now bulls are starting to wake up.
This move could be the start of something big if momentum continues.
Still early, but signs are pointing towards a possible bullish leg up.
Watch for a clean retest of the trendline — that could be your confirmation.
Volume is building nicely, and price action is starting to shift.
If you're tracking PI like I am, this is one to keep an eye on.
🔔 Follow for more updates and let's catch this move together!
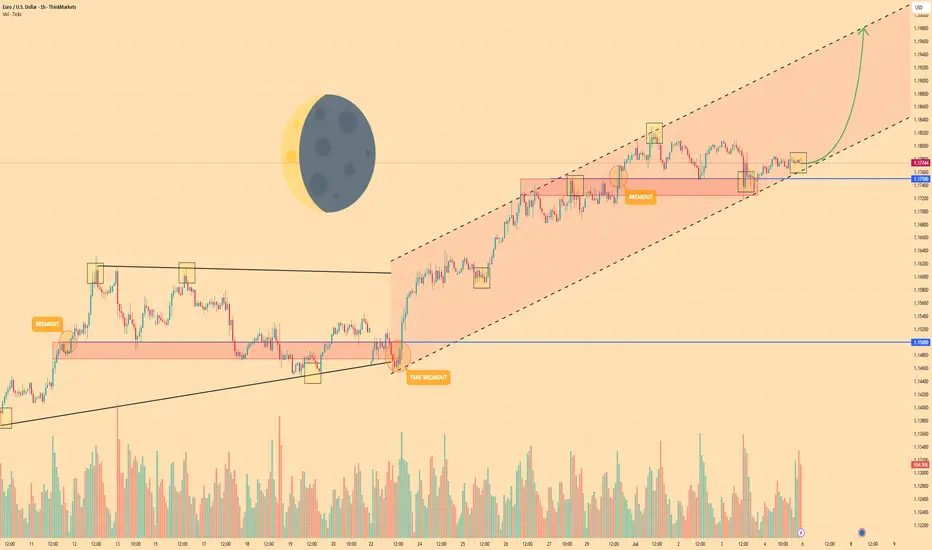
EURO - Price can continue to grow inside rising channelHi guys, this is my overview for EURUSD, feel free to check it and write your feedback in comments👊
The price traded in a flat range between $1.1500 and $1.1750 for an extended period, testing both extremes multiple times with low volatility and indecision.
A breakout above $1.1750 initially looked promising but turned into a fakeout when sellers quickly pushed the price back below $1.1725, trapping aggressive longs.
After that shakeout, buyers regained control and propelled EUR into a rising channel, marked by higher highs and higher lows since the end of June.
Price has since respected the lower boundary of this rising channel near $1.1725–$1.1750, using it as reliable support for continued gains.
With two confirmed breakouts and the channel structure intact, bullish momentum suggests the pair can extend its move higher within the channel.
I expect Euro to continue climbing toward the next key resistance at $1.1980, where the upper channel line and structural supply zone converge.
If this post is useful to you, you can support me with like/boost and advice in comments❤️
Disclaimer: As part of ThinkMarkets’ Influencer Program, I am sponsored to share and publish their charts in my analysis.
HelenP I. Gold can correct to trend line and then bounce upHi folks today I'm prepared for you Gold analytics. If we look at the chart, we can see that gold has formed a broadening wedge pattern with several touches of the trend line, which acts as a dynamic support. After a strong drop, the price found support near the 3295 level and rebounded, forming a local upward movement. However, bulls have not yet shown a strong impulse, and the price is still trading below the resistance zone between 3390 and 3400 points. Currently, the price is hovering just above the trend line, and appears to be testing this support again. I expect a short decline, possibly to the area around 3295 - 3285 points - that’s the key support zone. If this area holds and we see a bounce, it will confirm that buyers are still active and ready to push the price up again. In this case, we could see gold continue moving inside the wedge pattern and aim for the upper resistance. My goal is set at the 3390 level, right near the wedge's upper border and strong resistance. This target matches the local highs from previous attempts, and if bulls gain momentum, they may try to break through this zone. But for now, I remain cautiously bullish and expect gold to bounce off the trend line and move upward toward the resistance. If you like my analytics you may support me with your like/comment.❤️
Disclaimer: As part of ThinkMarkets’ Influencer Program, I am sponsored to share and publish their charts in my analysis.
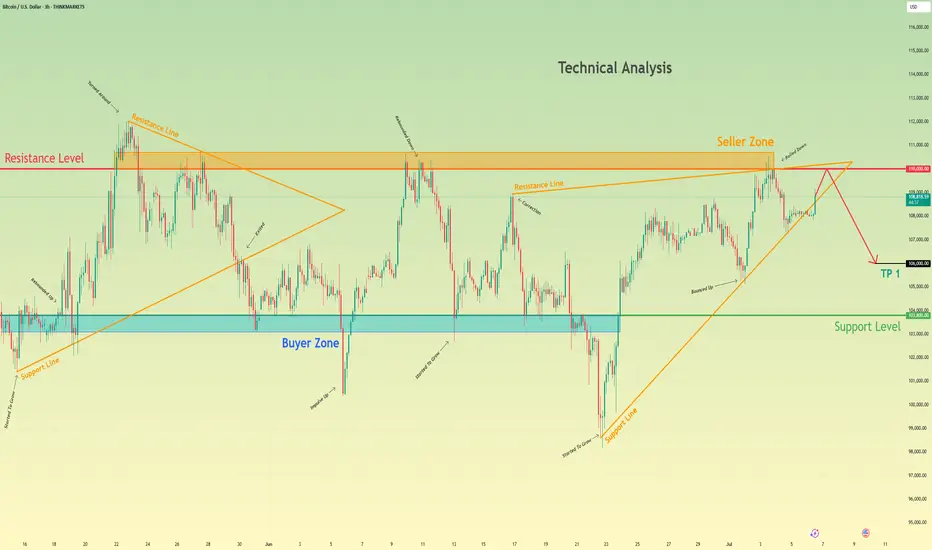
Bitcoin can rebound from resistance level and start to declineHello traders, I want share with you my opinion about Bitcoin. Recently, the price broke above a local resistance and quickly approached the key resistance level at 110000, which also aligns with the upper boundary of the seller zone (110000 - 110700 points). This area has already proven its strength multiple times, causing sharp rejections in the past. Moreover, the price has tested it again recently and failed to break through. In addition, we can see a triangle structure, which fits the logic of a pennant pattern after a bullish wave. However, the latest move upward has already lost momentum near the apex, and the price is now trading just under the upper edge of this formation. That makes this zone technically overloaded and vulnerable to a downside reversal. Based on this, I expect Bitcoin to test the resistance level one more time and then roll back down toward TP 1 at 106000 points, a zone near previous liquidity accumulation and a local consolidation range. If selling pressure increases, the price might aim for the buyer zone (103800 - 103100). Given the current rejection at resistance, the structure of the triangle, and the reaction inside the seller zone, I remain bearish and expect further decline toward the support. Please share this idea with your friends and click Boost 🚀
Disclaimer: As part of ThinkMarkets’ Influencer Program, I am sponsored to share and publish their charts in my analysis.
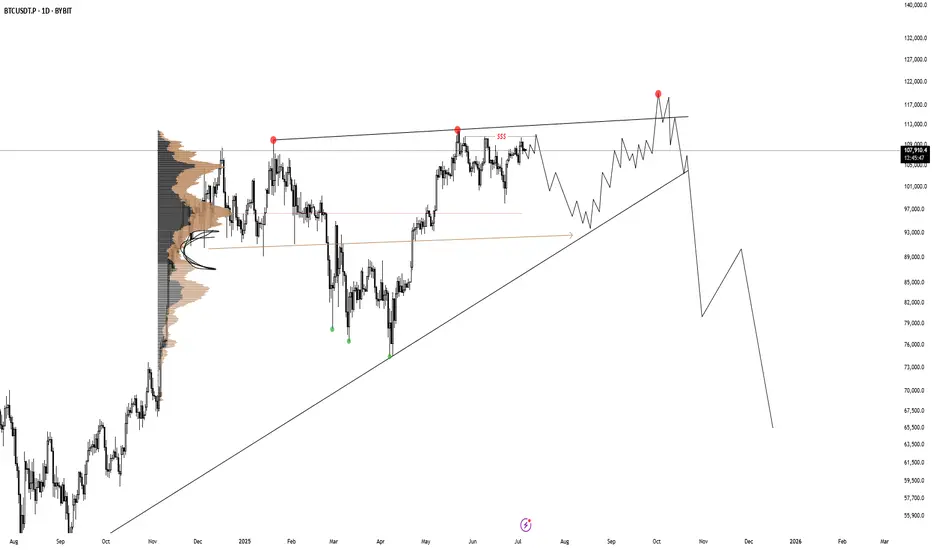
BTC HTF Distribution V2This is still the main scenario I'm looking for until it's invalidated. A build up like this, followed by a fake breakout out of this rising wedge as 3rd tap would be perfect.