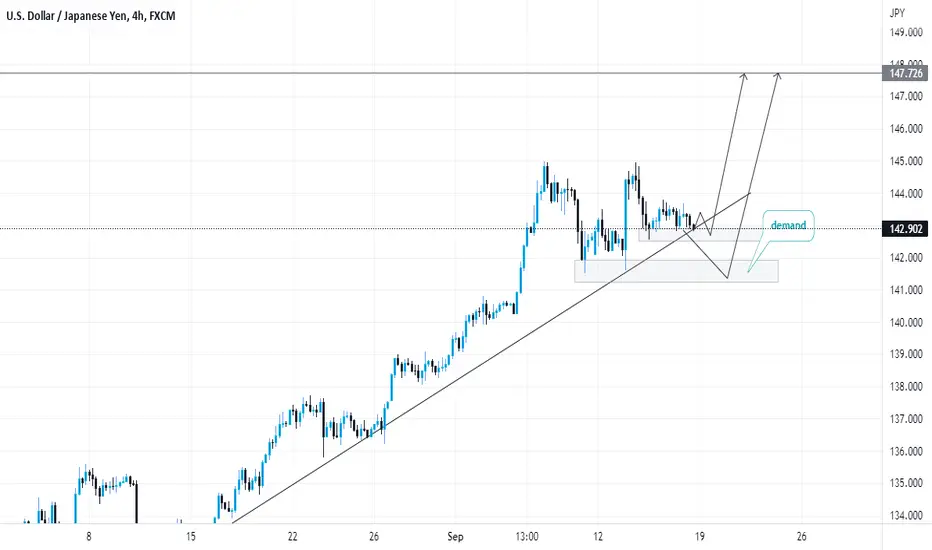
USDJPYThis is my analysis on USDJPY. we are in a long term uptrend on the monthly tf to 4hr tf so our bias for now is to the upside, we can see the retracement to the 4hrs demand zone before we resume the continuation. unless we break the demand no need of selling
Weeklyanalysis
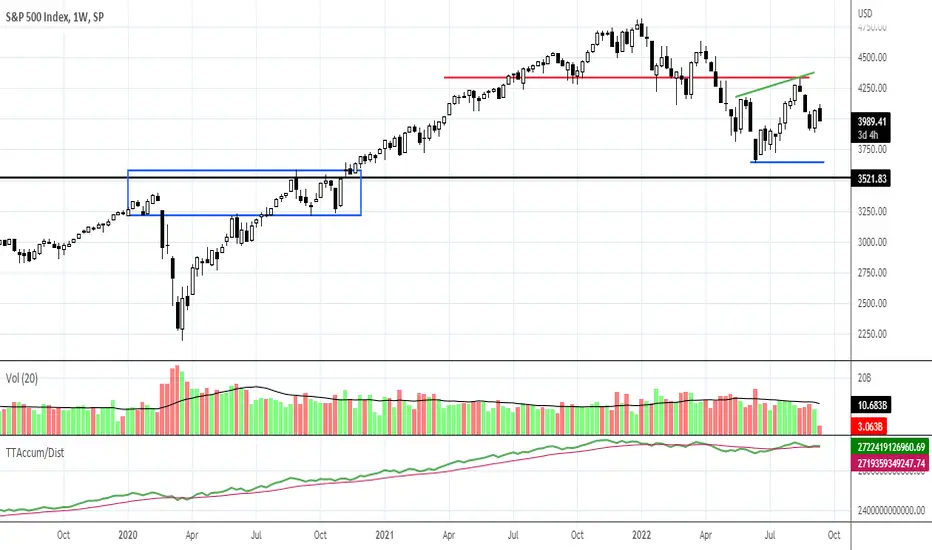
SPX: Watching Strong Support from the 2020 HighsWeekly charts are ideal for evaluating the retest of the lows of the stock market’s bottom attempt which reached a higher high in August. Volume on the weekly scale shows lower activity than in the prior weeks. The lows of June are still not yet reached; that is the level that is being retested currently. Support is strong at the 2020 yearly highs, which is also the neck of the bear market of 2020.
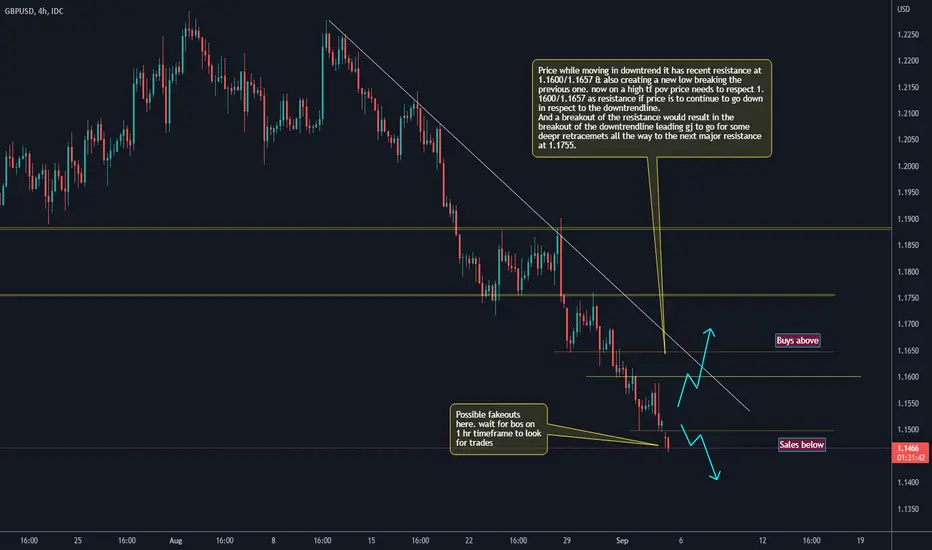
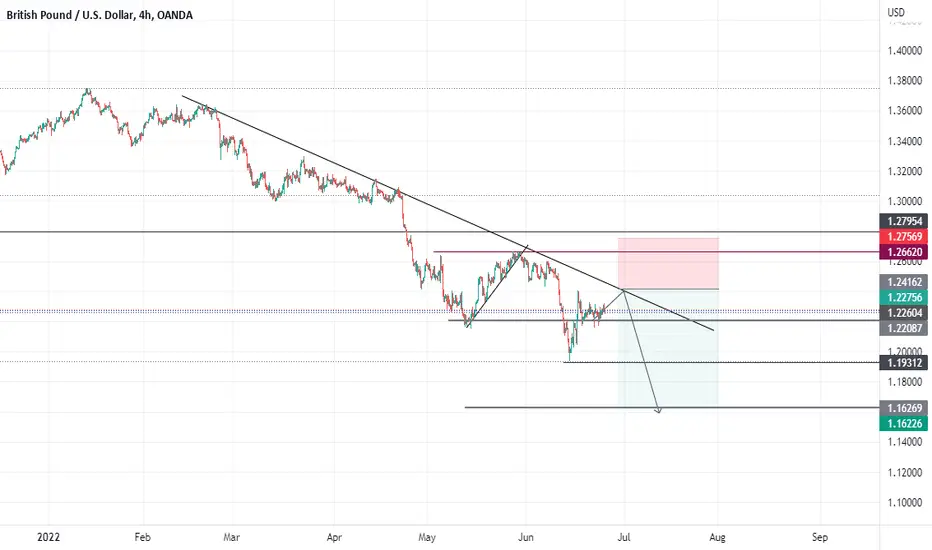
GBPUSD 05/09/2022 to 09/09/2022Price while moving in downtrend it has recent resistance at 1.1600/1.1657 & also creating a new low breaking the previous one. now on a high tf pov price needs to respect 1.1600/1.1657 as resistance if price is to continue to go down in respect to the downtrendline.
And a breakout of the resistance would result in the breakout of the downtrendline leading gj to go for some deepr retracemets all the way to the next major resistance at 1.1755.
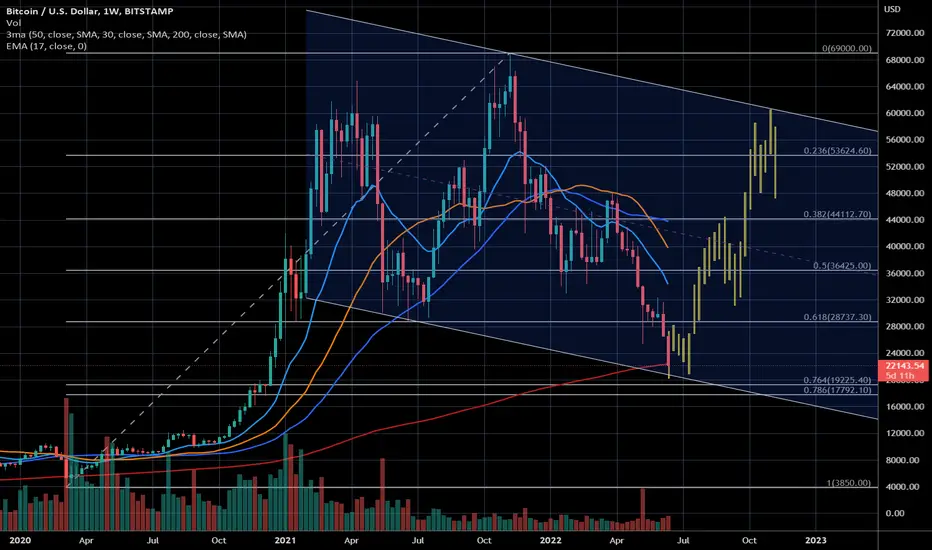
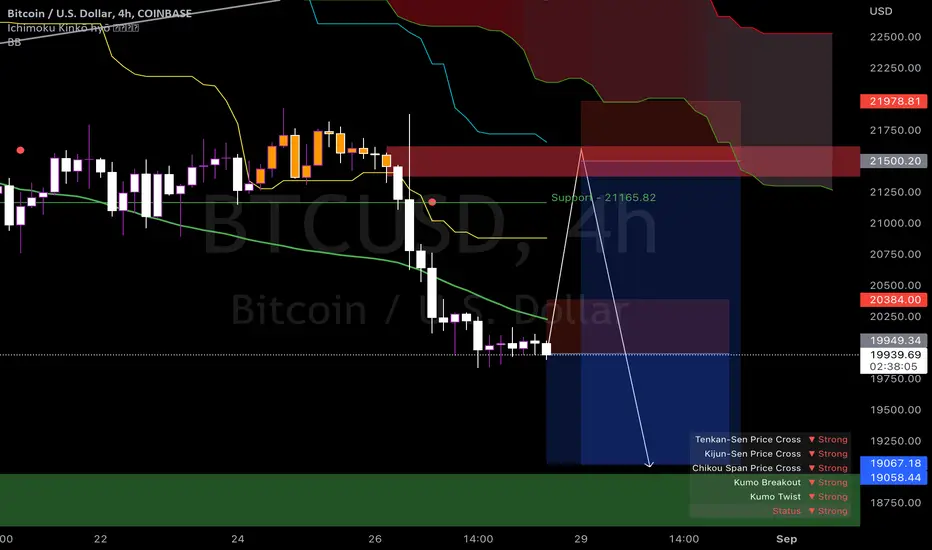
BTCUSD SELL IDEA (28.8.22)BTC broke the trendline (rising wedge) on 4hr and retested it, so I entered a first small sell with a tp at next demand zone, but it will very likely hit my SL, so I added an 3x big sell limit at the supply zone above us, that would be a 5RRR. You also can leave TP open and close partial at that level and let rest run till 10k-15k; because this could be a possible long term price.... use this opportunity and buy as much as you can.... BTC likely wont be that cheap ever again
GBPUSD Weekly Chart Analysis From 29 AUG to 2 SEP 2022GBPUSD closed the week with such bearish engulfing move after a retest on a newly formed downtrendline. so if gu is to continue moving down then it should keep on respecting the zone at 1.1939 as its resistance & continue to push down by breaking below 1.1716.

GBPJPY Weekly Chart Analysis From 29 AUG to 2 SEP 2022GBPJPY if is to continue to push up to 164.758, then it needs to respect the uptrendline & the key zone at 159.962 as its support. A breakout of that key zone would be a breakout of the uptrendline leading gj to push down all the way to 157.869.

GBPUSD Weekly Chart Analysis 15th to 19th August 2022The expected move from the upcoming week is explained through the arrows & marked key zones purely based on trendline & price action.

MichFX | GBPUSD started the next round of bearish movement
With an overall bearish trend , GBPUSD has finished a week+ bullish movement by reaching a strong resistance zone . It broke the ascendant channel and started its bearish movement. A successful retest of the zone will confirm the downtrend and will give more confidence to open short positions.
Share your opinion in the comments and support the idea with like.
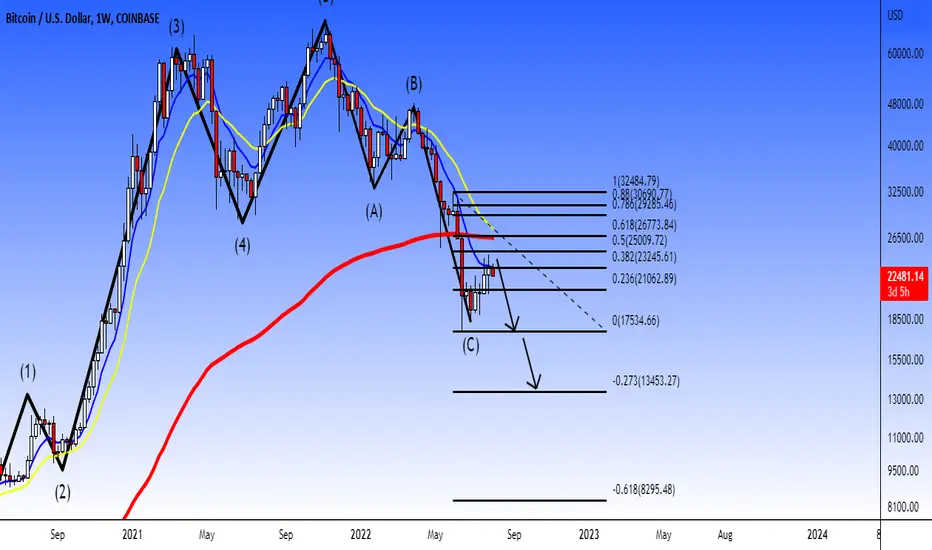
Weekly Analysis Overview: BitcoinIn this weekly analysis, Bitcoin it's in the 0.382% Fibonacci level, what we could to expect a market crash of another 40% to see. I expect that Bitcoin goes to $17,600 USD, and also the most lower price will be around $13,450 USD to watch and look if that price could be the stop of the bear market to know what could to happen in the future.
I'm still bearish in Bitcoin and altcoins.
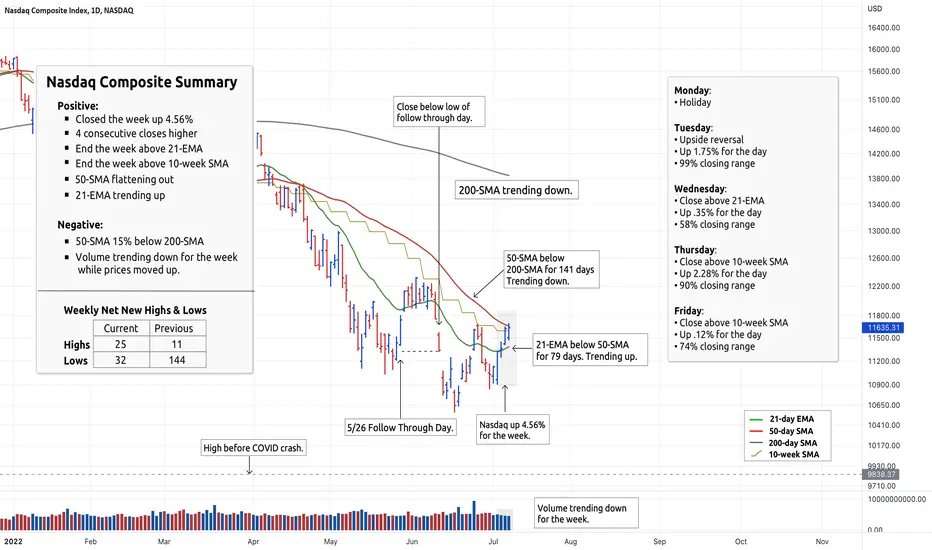
Nasdaq Composite Summary - Week of 7/15/2022Summary of weekly price and volume action, as well as net new highs and lows, on the Nasdaq Composite for the week of 7/15/2022.
Click on the chart below to view the details:
AMZN AnalysisPrice is on a downtrend. Seems like a wyckoff accumulation schematic has started with a change in character. However, price has created sell-side liquidity with a bullish POI nearby. I'm expecting a short term bearish move to take the liquidity and tapping into the bullish POI before we see any uptrend.

AMC AnalysisPrice is on a downtrend. Price is building sell-side liquidity once again. Price has left sell-side liquidity from Mar 2021 - Jun 2021, sitting a lot of stop-losses. I'm expecting price to drop towards the bullish POI below.

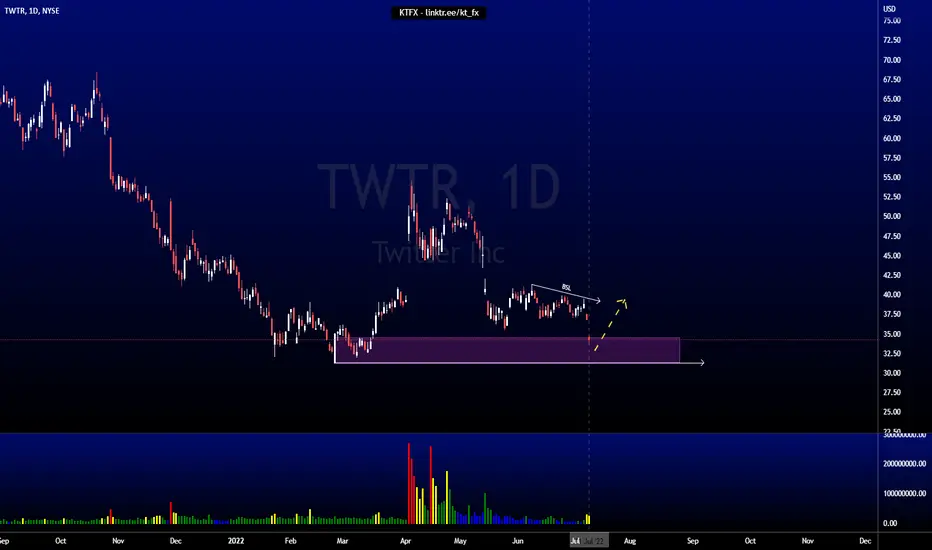
TWTR AnalysisPrice is on a downtrend, currently at a bullish POI. I'm expecting price to rally from here, taking out the buy-side liquidity created above. However, I do note of the fundamentals for this company and there is also a probability that price can take out the lows at 31.30. I'm leaning towards the bullish price movement.
NVDA AnalysisPrice is on a downtrend. Price has just tapped into a bullish POI. I'm expecting the price to do a short-term rally into the bearish POI at 181.22 area before continuing with the bearish trend.

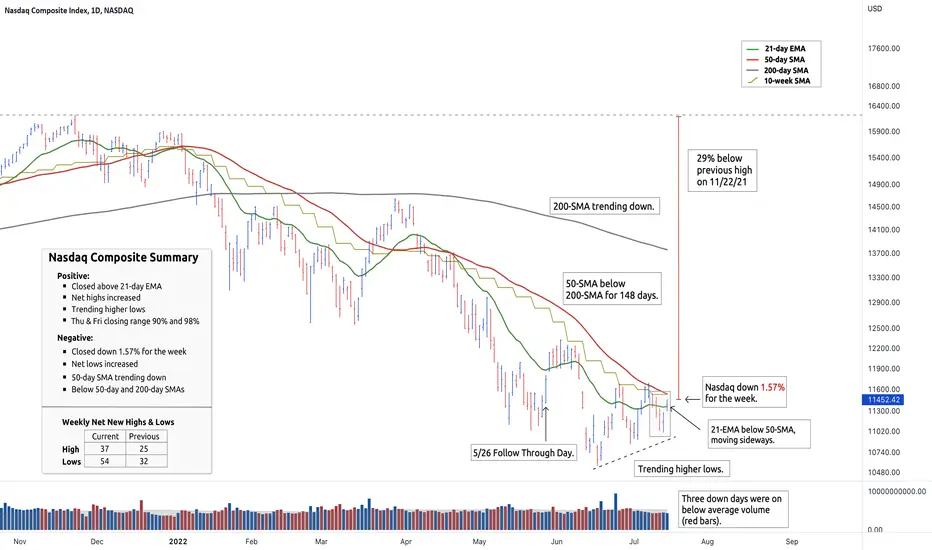
Nasdaq Composite Summary - Week of 7/8/2022Summary of weekly price and volume action, as well as net new highs and lows, on the Nasdaq Composite for the week of 7/8/2022.
Click on the chart below to view the details:
Big picture view of the Nasdaq Composite:
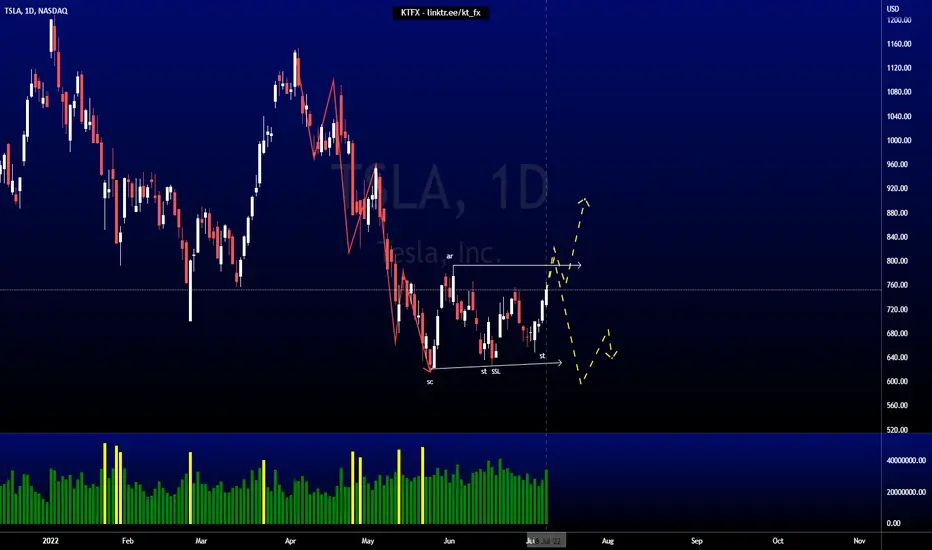
TSLA AnalysisPrice is consolidating and is in a wyckoff accumulation schematic. Price is trying to break higher high. Expect price to break above AR at 792.63 and push lower taking out sell-side liquidity being built.
NIO AnalysisPrice is on an uptrend. Price has taken liquidity above 23.98. Expect price to retrace down to bullish POI.

FFIE AnalysisPrice is on an uptrend. Price took liquidity and stop hunted the highs at 5.97. Price is unable to close higher. Expect price to retrace down to bullish POI.

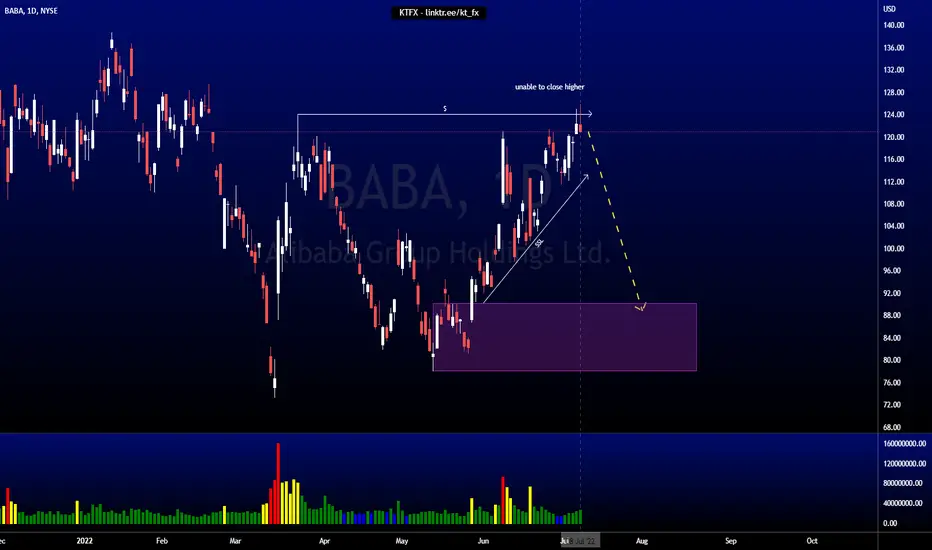
BABA AnalysisPrice is on an uptrend. Price took liquidity and stop hunted the highs at 124.11. Price is unable to close higher. Price has been building sell-side liquidity on its way up. Expect price to retrace down to bullish POI.
AAPL AnalysisPrice is on a downtrend.
Price is hitting a bearish POI.
Expect price to continue downtrend from here.
We might see price starting phase A of wyckoff accumulation schematic.

GBPUSDmy bias on gbpusd still remain bearish, tho anything can happen in the market but for now I'm expecting the market to retraced and form a new lower high around 1.24030 which in turn will create a double top and we short from there, if your bias is bullish you have to wait for the break of 1.27000 level
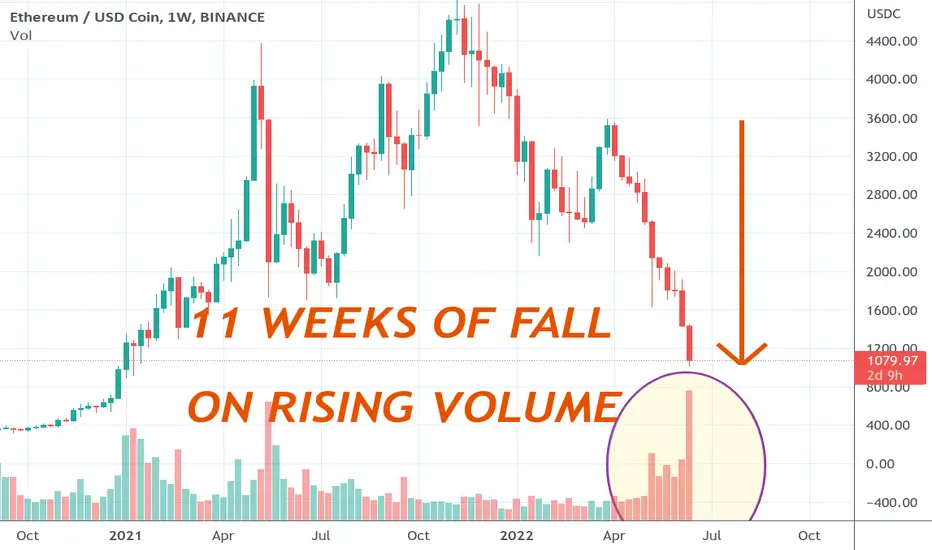
ETHEREUM WILL FALL FOR 12 WEEKS TOO.EVERYTHING IS IN THE CHART.
The volume continues its Unabated rise,
while ETH continues its UNabated FALL FOR 11 consecutive weeks.
Think about it - ELEVEN WEEKS OF STRONG FALL.
Plus
RISING VOLUME
IT WILL FALL NEXT WEEK TOO.
Quo vadis Bitcoin?This is what Bitcoin COULD do now. The channel over the weekly timeframe is on the bottom side well supported. So lower prices should only occur by touching the bottom line in the following weeks.