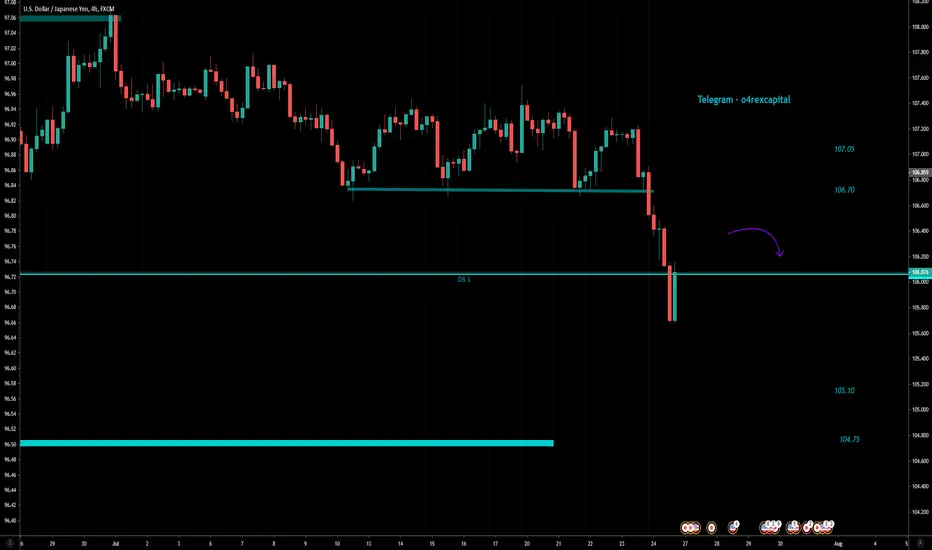
USDJPY Weekly Forecast for 27th-31st July 2020Key levels for this week -
106.70
105.10
104.75
- Going into this week looking for bearish continuation
- Any pullbacks towards key level will be used for new entries
Weekly forecast/Sunday analysis highlights the overall market trend with key levels to get an idea of the best targets in the upcoming week(s)! Projection of the market with technical analysis and is to be used for ideas, entry point analysis is done on a daily basis for entries with minimal drawdown!
Every week Includes analysis for
CRUDE OIL / XTIUSD
GOLD SPOT/ XAUUSD
Us dollar index / DXY
USDJPY
EURUSD
GBPUSD
AUDUSD
NZDUSD
USDCAD
BTCUSD
AND MANY MORE - Entries taken on markets with the best opportunities. Only low risk high reward setups with minimal drawdown!
Weeklyforecast
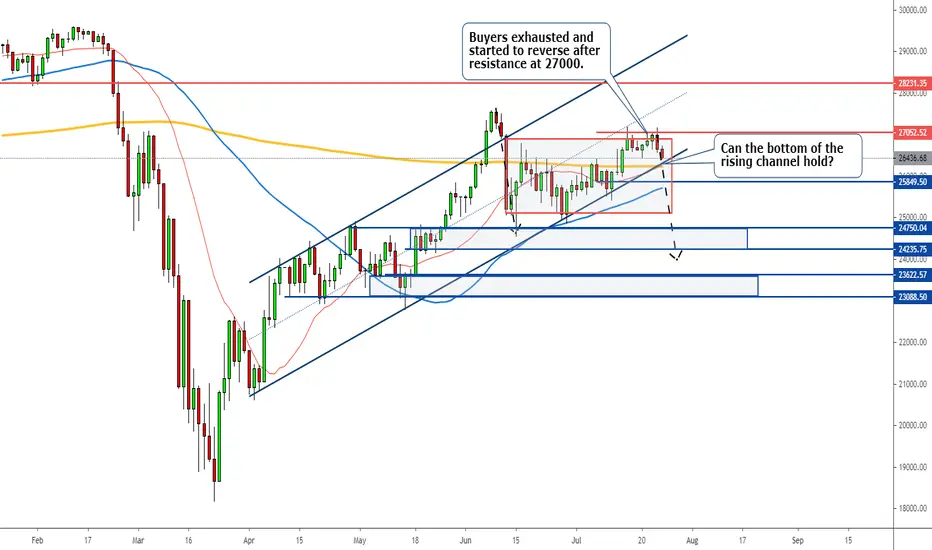
Dow Jones: Is this the beginning of a 2nd SELL-OFF?Since coronavirus first broke out in February globally, the global stock market has tanked and plunged in a devastating fashion but has quickly recovered once the lockdown began and the economy started to open up again.
However, it is obvious right now that the US is facing a relapse as new COVID cases rose to an all-time high, and death rate picked up again.
Besides, the US-China tension has worsened in one of the worst situations, and also, the US stock market is obviously overbought and is mostly driven by the government through unprecedented printing of the dollar.
The Dow Jones fell sharply since the COVID cases started to spike again in early mid-June and it struggled to climb as the situation was not under control.
Moving forward, we can see a prominent sign of exhaustion as one of the biggest US stock markets, Apple, plunged last week.
The price was seen resisted at 27000 and started to reverse in the last 2 trading days.
We will see a retest of the bottom of the 4-month rising channel and chances are it will break below if COVID situation, as well as the US-China tension, continued to worsen.
So to draw a conclusion, the long-awaited 2nd wave of a sell-off could happen anytime, and we see the price plunging towards the 24000 and 23000 regions in the next couple of weeks.
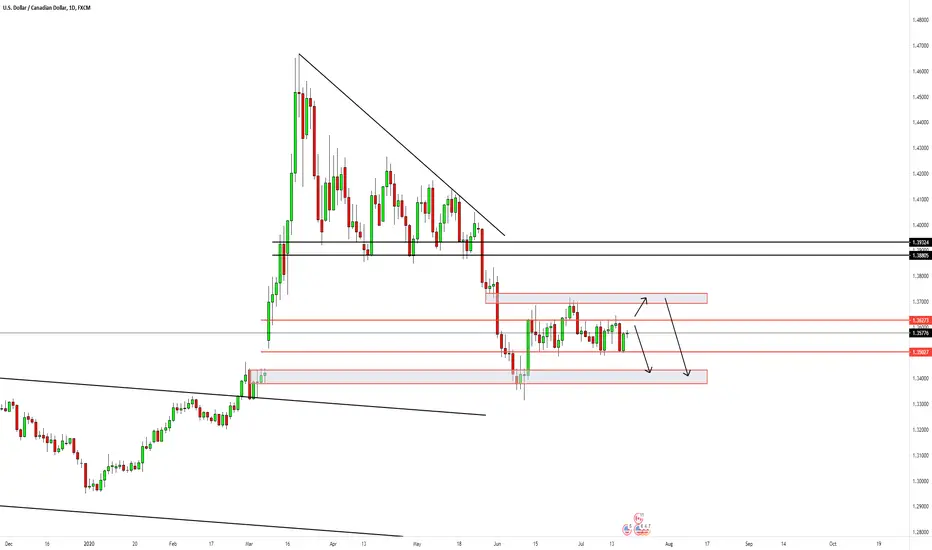
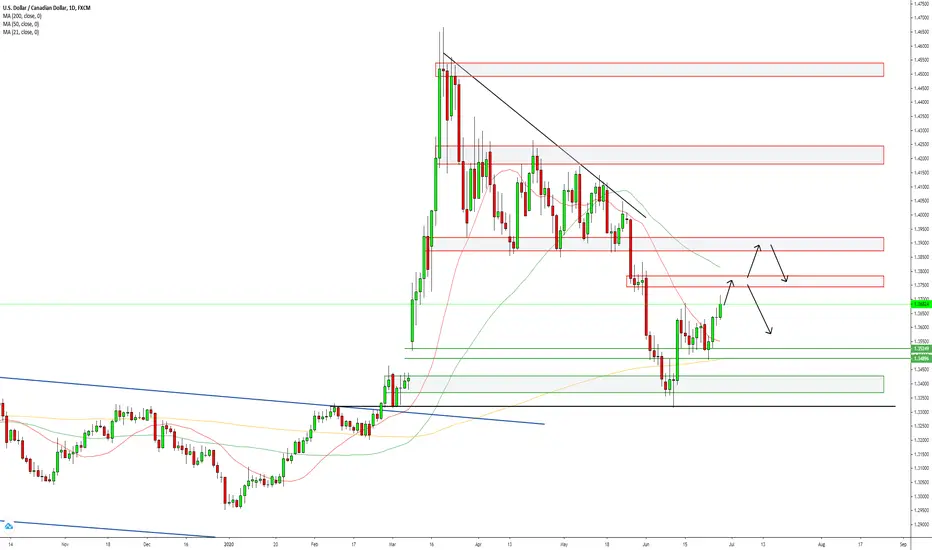
Can USDCAD break strong support level?USDCAD has finished forming a Head and Shoulders pattern, and has successfully formed a bearish wave reaching the previous low before finding support.
We can see that the price USDCAD is currently in is a significant price of interest, forming 2 doji candles this week.
Should price be supported this week, we could wait for a retracement back to the neckline of the Head and Shoulders pattern before continuing to sell USDCAD .
However, should price break current support at the start of the week, we could then wait for a retest of this support turned resistance before selling USDCAD again.

USDCAD Weekly Forecast 27th - 31st JulyUSDCAD has finished forming a Head and Shoulders pattern, and has successfully formed a bearish wave reaching the previous low before finding support.
We can see that the price USDCAD is currently in is a significant price of interest, forming 2 doji candles this week.
Should price be supported this week, we could wait for a retracement back to the neckline of the Head and Shoulders pattern before continuing to sell USDCAD.
However, should price break current support at the start of the week, we could then wait for a retest of this support turned resistance before selling USDCAD again.


USDCAD Weekly Forecast for 20th-24th July 2020 Key levels for week ahead
1.35
1.3730
1.3865
- Overall market is in bullish structure but due to choppy market (potentially nice consolidation for continuation) will just let market breathe and show clearer signal for new entries.
- If DXY analysis goes as planned this pair should do as well.
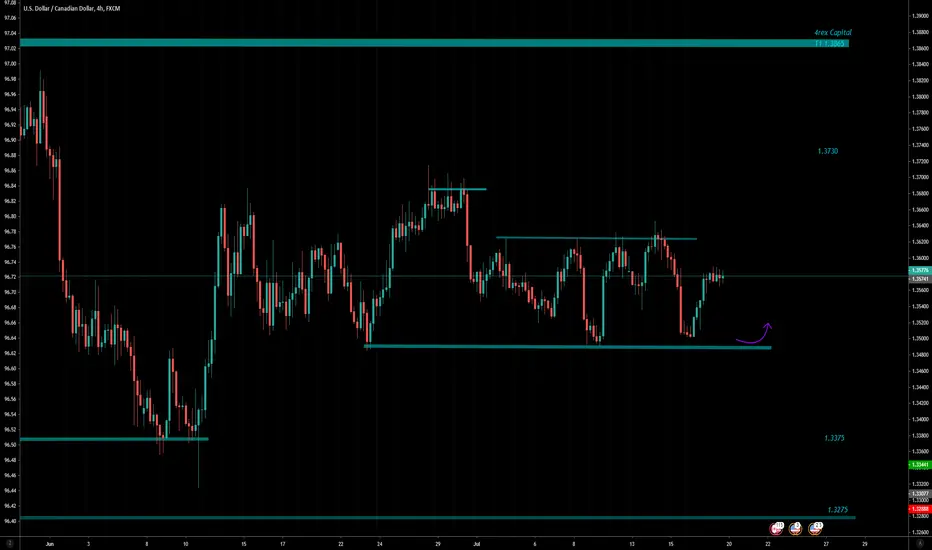
USDCAD Range BoundUSDCAD continued moving within it's range without a direction this week.
This is good for us as it provides a clear selling price, at the top of the range.
Before closing, USDCAD got supported at the bottom of the range once again, therefore, this week we could look to sell USDCAD at the top of the range once price gets resisted.
However, if USDCAD breaks above the current range first, we could wait to sell USDCAD at previous supply zone.

USDCAD Weekly Forecast 20th - 24th JulyUSDCAD continued moving within it's range without a direction this week.
This is good for us as it provides a clear selling price, at the top of the range.
Before closing, USDCAD got supported at the bottom of the range once again, therefore, this week we could look to sell USDCAD at the top of the range once price gets resisted.
However, if USDCAD breaks above the current range first, we could wait to sell USDCAD at previous supply zone.
Dollar Falls Slowly But SteadilyThe dollar continued to fall last week and reached a 1-month support level at 95.8.
It rebounded at first but gains were wiped out in the very next candle, showing a lack of buyers at the support.
The dollar is currently establishing a bearish trend within an H4 falling channel, both highs and lows are continuing to form lower, and thus a clear-cut bearish market.
This week, we shall continue to look for a selling opportunity.
1) If the dollar rebounded off from the current support, wait for the price to reach resistance zone 96.2 - 97.35, as well as the top of the H4 falling channel, and look to sell.
2) If the dollar breaks below the current support, simply wait for a pullback towards the breakout level to sell again.
Look out for the near 2-year support level which coincides with a W1 rising trendline.

ENGBTC is waiting for a weekly breakout 🦐ENGBTC is waiting for a weekly breakout (red rect).
According to Plancton's strategy, we can set a nice order
–––––
Follow the Shrimp 🦐
Here is the Plancton0618 technical analysis, please comment below if you have any question.
The ENTRY in the market will be taken only if the condition of Plancton0618 strategy will trigger.

GO/BTC I found A amazing trade of " GOCHAIN/BTC " AT weekly timeframe. Accurate Double Bottom Found. All TP have been mentioned.

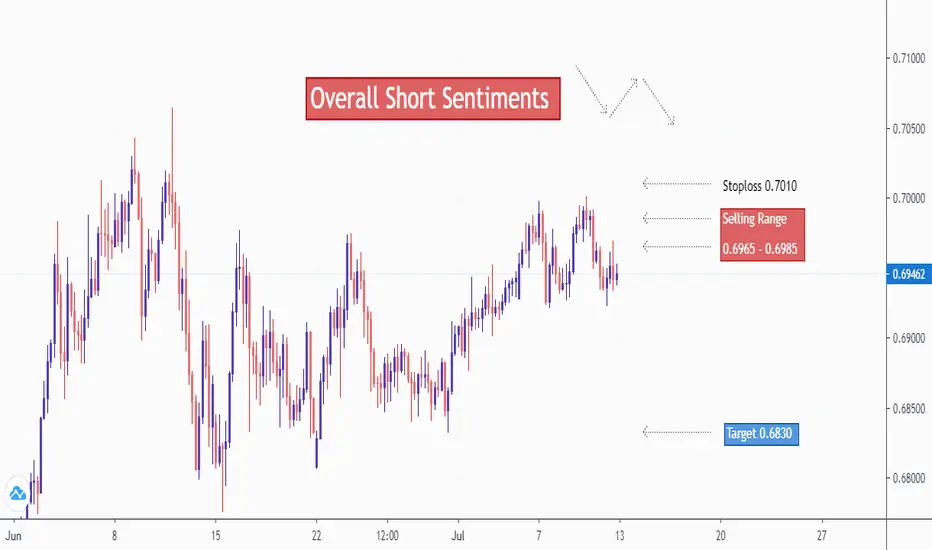
AUDUSD Short Trade Setup | Weekly Trade Setup 13-17-July-2020In upcoming week we will be focus on this pair for Short Opportunities !
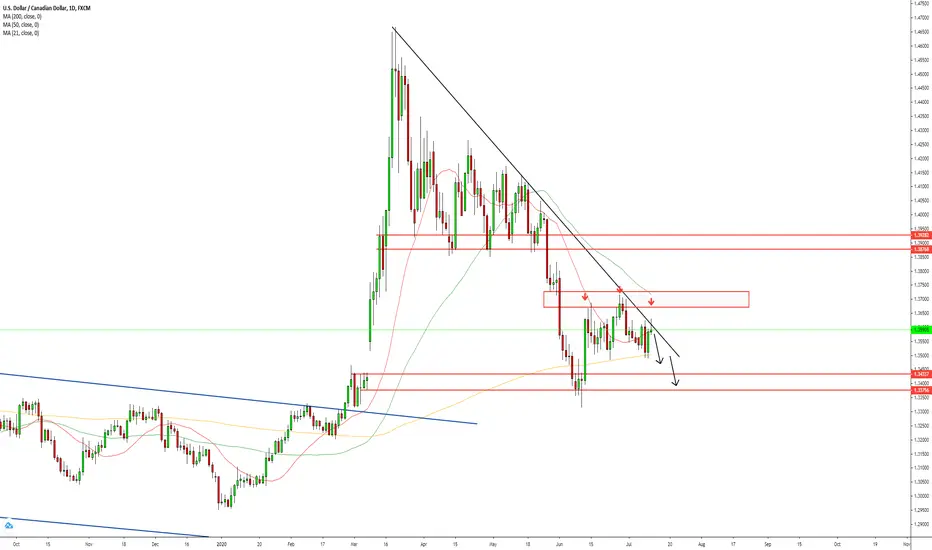
USDCAD Head and ShouldersUSDCAD has been moving sideways after a major downtrend breaking out of a descending triangle a couple of weeks ago.
After this week, we can see that price has formed somewhat of a head and shoulders pattern, with current price forming the last shoulder.
Additionally, the last shoulder is currently forming on a strong resistance point from a falling trendline.
Should this resistance hold, we could look to sell USDCAD back it's previous low price.
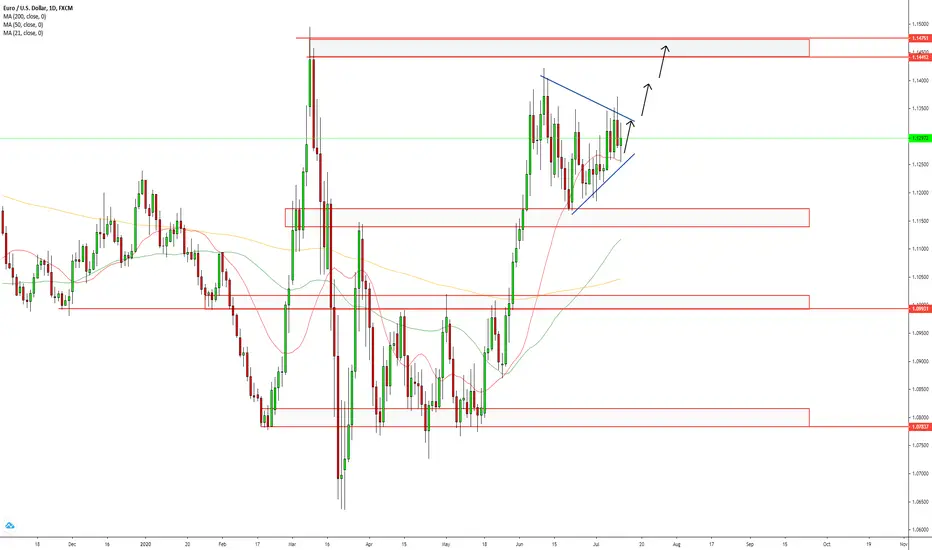
EURUSD Impending Break OutEURUSD's movement this week has been definitely leaning more towards ranging, with a slight bullish bias.
As we can observe from price movement, higher lows have been forming, however price is still being rejected from the previous high.
On the daily timeframe , we can definitely see a consolidation pattern being formed, nearing its end soon.
Thus we can expect a breakout of the pattern sometime this week.
On the H4 timeframe, a rising channel could be seen, with price being supported at the bottom of the channel right now.
This week, we could look to buy EURUSD at current price, or we could also wait for a breakout of the pattern before buying on retracement for more confirmation.
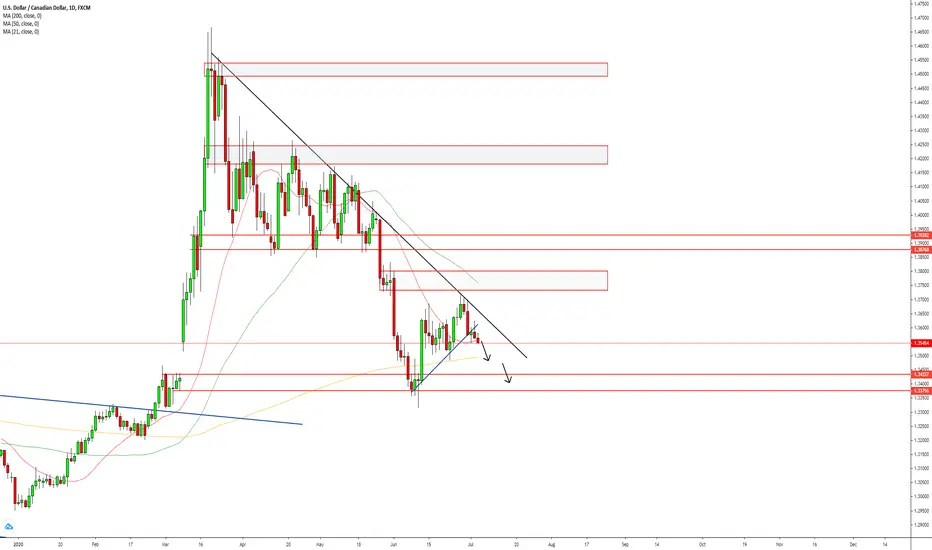
USDCAD Start of New Downtrend?USDCAD has completed 2 waves of retracement and got resisted at the top of a falling trendline early this week before starting a downtrend.
Price has also broken a rising trendline indicating that there could be room for more downside.
We could look to continue selling USDCAD this week should there be a small retracement, before next support zone seen at 1.3435 - 1.3380.

Weekly Analysis AXY,JXY,EXY,BXY,CXYThis is the weekly analysis for the week commencing 28.06.2020
======================
NOTE:Truths
-Traders will do the same thing over and over again.
-In trading, no one to blame and no one to question what price did.
-Price can break any low/High because anything can happen.
If you fully allign your thinking in line with the truth about the market then you will win.

USDCAD End of Retracement?USDCAD has been continuing its retracement after finding support early this week.
However, price is soon reaching a supply zone, which coincides with the 68.2% fibo level. Should price be resisted here, it would be a good opportunity to short USDCAD again. If price were to break above this zone, next level of resistance could be seen at previous major consolidation, around 1.3935 - 1.3880.
USDCAD Weekly Forecast 29 June - 3 July.USDCAD has been continuing its uptrend after finding support early this week.
However, price is soon reaching a supply zone. Should price be resisted here, it would be a good opportunity to short USDCAD again. If price were to break above this zone, next level of resistance could be seen at previous major consolidation, around 1.3935 - 1.3880.

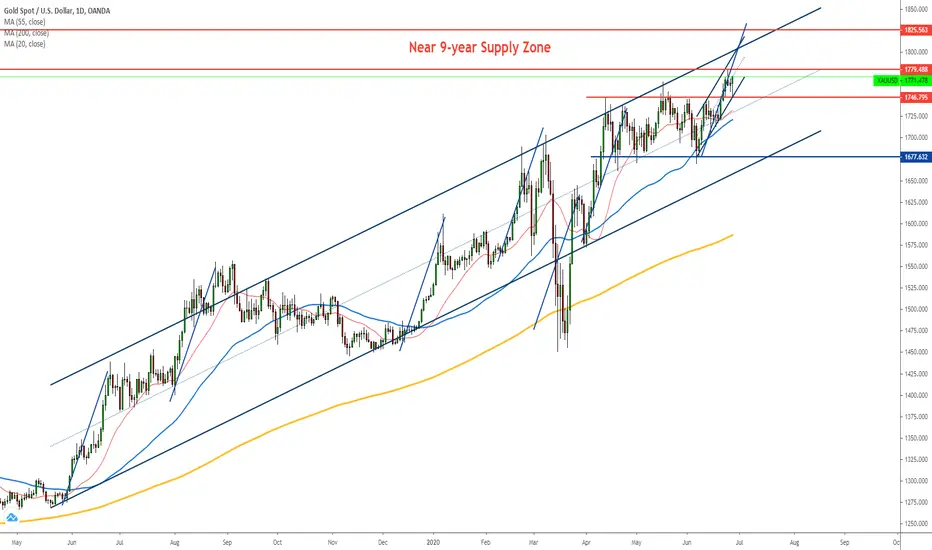
Gold has More Room on the UpsideWay to Gold! The gold has once again broken new high and reached 1779, a level not seen in more than 8 years.
As high as gold already was, the demand for safe-haven asset continued to rise through the pandemic.
There are so many reasons - the unprecedented printing of money (i.e. bond purchases), the super low-interest rates which will last for a couple of years, and of course the uncertainty of the pandemic and the recent surge in COVID cases in the US.
Historically speaking, the most recent financial epidemic in 2008 has clearly shown us just how much can gold climb while the economy is trying to recover from recessions and depressions.
So, just in case if you're thinking that the gold is over-valued, it's probably more like 'undervalued'.
The break of a new historical high could very well be the beginning of the rise of gold price.
However, it's likely inevitable that strong resistance will be faced the nearer price gets to the historical high of 1920, and before that, the near 9-month supply zone just right ahead.
As of now, gold should have a smooth journey ahead to climb further, at least not before it reaches 1810.
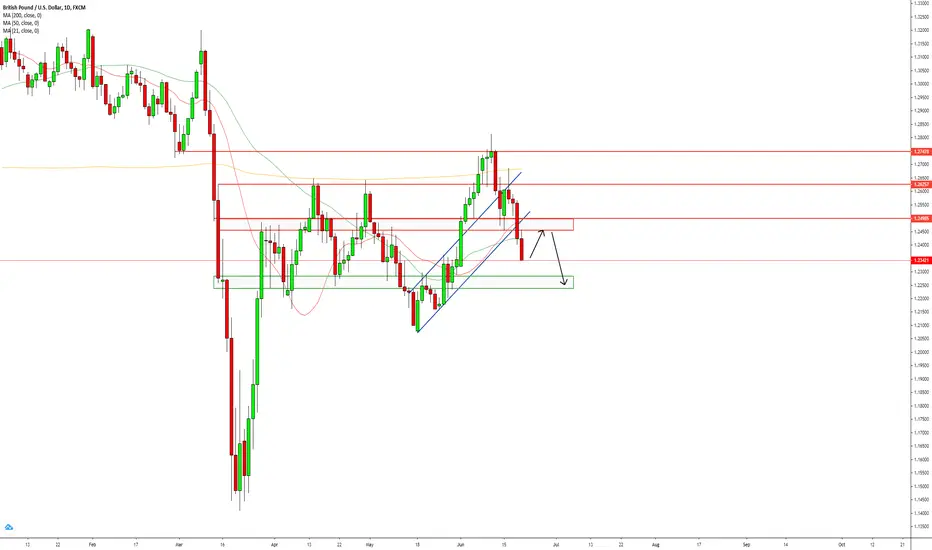
GBPUSD Rising Channel BrokenGBPUSD has failed to continue its uptrend as it has broken multiple support levels, and broken a rising channel this week.
With how bearish the closing candle was on friday, we are expecting further downside for GBPUSD this week.
Await a pullback to sell GBPUSD again at a better price, with the next immediate support being seen at 1.2210 - 1.2285.
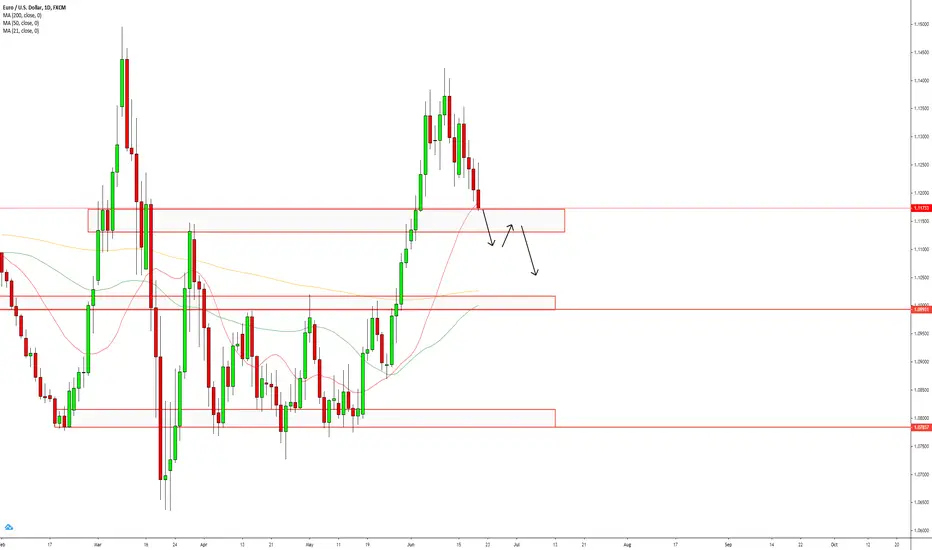
EURUSD Deeper Retracement?EURUSD has begun a downtrend after peaking out near previous high this week.
However, with such a strong uptrend, a large retracement would be expected as well.
This week, should price break below the current demand zone , it would confirm further downside.
Thus we could await a pull back before selling EURUSD again to next level of support.
Dollar May Climb Further but Not for LongThis month will be critical for the dollar as it will show whether the price will stay supported within the rising channel or confirm the break.
What's likely the outcome is the dollar will start to really weaken, both fundamentally and technically.
103 probably marked the peak for the dollar and the price has already wiped out all gains in March if we exclude the portion from below the rising channel.
The chart has shown that the dollar is losing its value and the most recent break-below of the bottom of the rising channel determined the case.
The Fed during its last FOMC conference said that interest rate will remain low throughout 2022, which means that demand for dollar will not be expected from a rate hike for a good period of time.
The Fed's balance sheet has expanded to a really horrendous figure during this pandemic which I don't even want to talk about it more.
To sum it up, the dollar may still rise a little further as demand for safe-haven currency such as dollar will rise as COVID cases rose last week.
But it won't be long and the dollar will start to lose its value and should the month closed below the channel, that shall be the beginning to the fall of the dollar.
