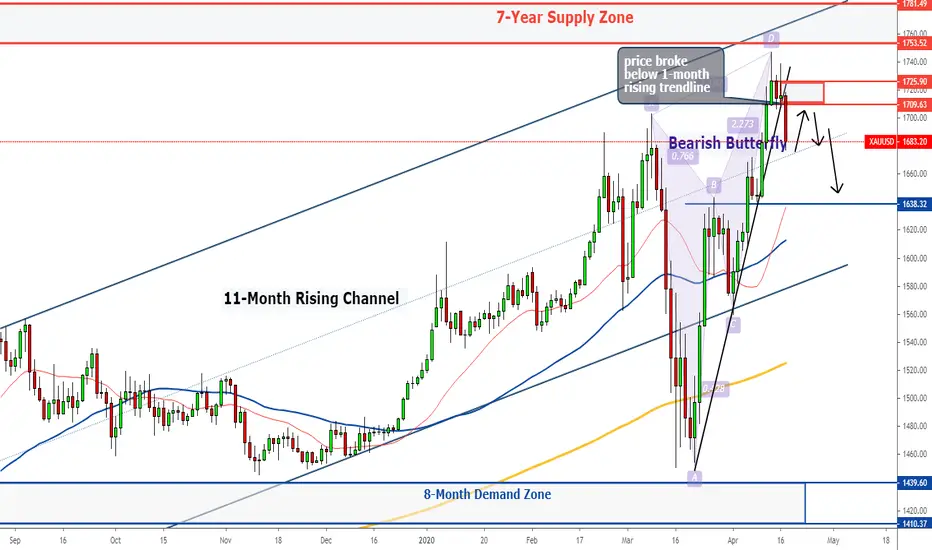
Gold Rise but Remain Resisted Amid Bearish ButterflyThe gold was little changed at first but rose steadily during the 2nd half of the week.
However, the price was resisted and reversed shortly and broke below a rising trendline once again.
Sellers started to take control on the last trading day during the US session.
As of current, the price has shown resistance and trading near the top while both highs and lows started to drop lower.
This week, the gold is expected to reverse and fall further towards a demand zone below 1688 where price could be supported by a rising trendline.
Should the price continue to break higher early in the week, it may continue to rise and reach an 8-year resistance level at 1788.
Weeklyforecast
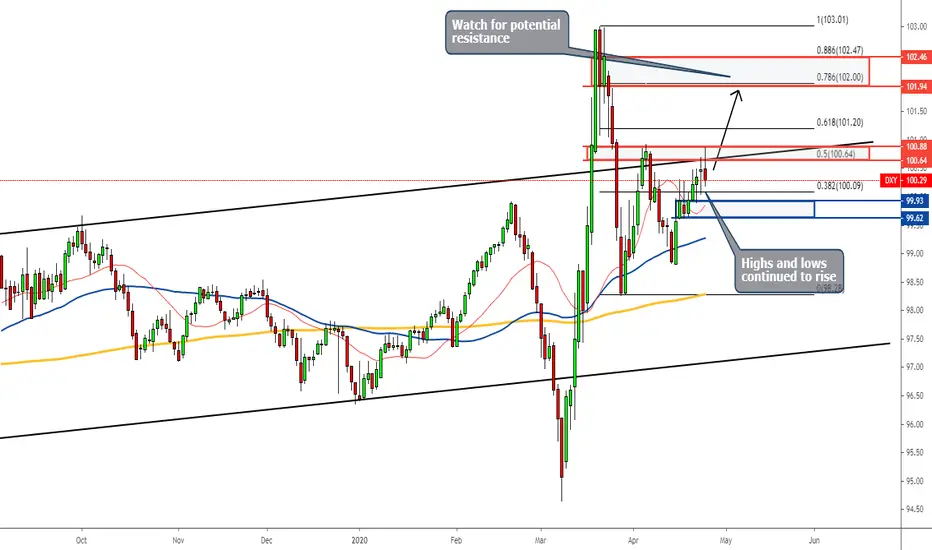
Dollar Climbs Slowly but SteadilyThe dollar climbed and created both higher highs and lows throughout the entire week.
The fast MAs are also bending upwards while staying moderately above the 200 MA, showing an increasingly bullish-bias market.
Besides, the price has recently broken above a bullish pennant which signifies for the dollar to continue its uptrend.
This week, we expect little pullbacks before the price continues to climb.
The price is expected to reach a supply zone around 102.
However, should the price falls unexpectedly, it will most likely found strong support at 99.40.

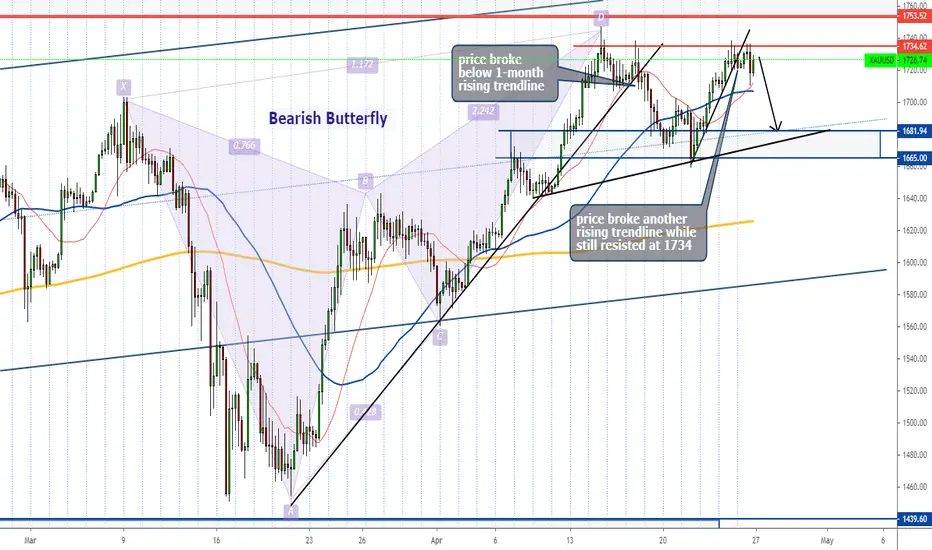
Gold Reversal Amid Bearish ButterflyThe gold peaked twice at 1739 and started to fall amid a bearish butterfly formation.
Gold continued its bullish stance from the previous week as it climbed steadily in the first 2 trading days last week.
After peaking at 1747, a strong pullback took place and price started to fall and lower highs were formed while still supported at 1710.
On Thursday, the price jumped and broke through the lower highs but was rejected and smashed down at 1739.
The bearish wave continued through and broke below a 1-month rising trendline which was formed throughout the formation of a bearish butterfly.
The multiple breakdowns have strongly suggested a bearish stance in this coming week.
The best course of action is to wait for a pullback towards the 1711 - 1720 breakout area.
An inside bar breakdown has taken place in the H4 chart as the price broke below support level 1710.
Dollar Faced Resistance From Inside Bar BreakdownThe dollar climbed but wiped out most gains after facing strong resistance at 100.30, a breakdown area of a previous inside bar formation.
At the beginning of last week, the price continued to fall and broke lower.
It started to climb quickly from the week low at 98.80 but rejection followed soon and the momentum was broken.
The price fell into a range which still somewhat allowing the price to break a little higher but mostly rejected again as it faced strong resistance from the breakdown of a previous inside bar formation.
A new inside bar formation was formed on the last trading day with a bearish inverted hammer which certainly favours the bear in the coming week.
Since there's been multiple failed attempts to make a breakthrough of the supply zone from 99.95, there's a good chance that the price will start to fall in the beginning of this week.
However, the price will meet with strong support at between 99.3 and 98.8 which could revive the bull.
Should the price successfully break lower, this could lead to the continuation of a strong bearish trend following the major bearish trend which began on 23rd March 2020.
Otherwise, we are most likely to experience a ranging week between 101 and 98.4.

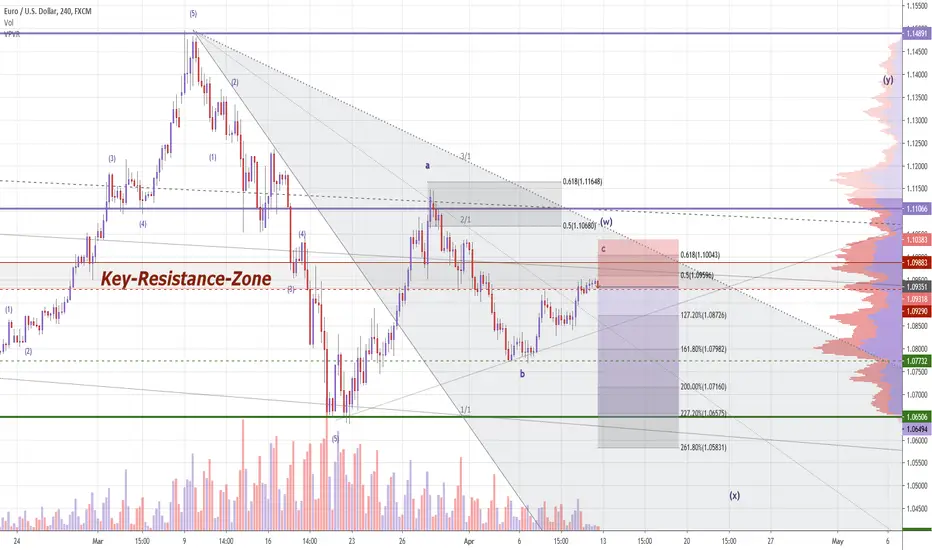
EUR/USD SELL SIGNALHey tradomaniacs,
welcome to another free trade-plan.
Important: This is meant to be a preparation for you. As always we will have to wait for a breakout and confirmation.
Type: Day-Swingtrade
Market Sell: 1,09025
Stop-Loss: 1,10385
Target 1: 1,08530
Target 2: 1,07750
Target 3: 1,06500
Stop-Loss: 136 pips
Risk: 1-2%
Risk-Reward: 2,77
LEAVE A LIKE AND A COMMENT - I appreciate every support! =)
Peace and good trades
Irasor
Wanna see more? Don`t forget to follow me.
Any questions? PM me. :-)
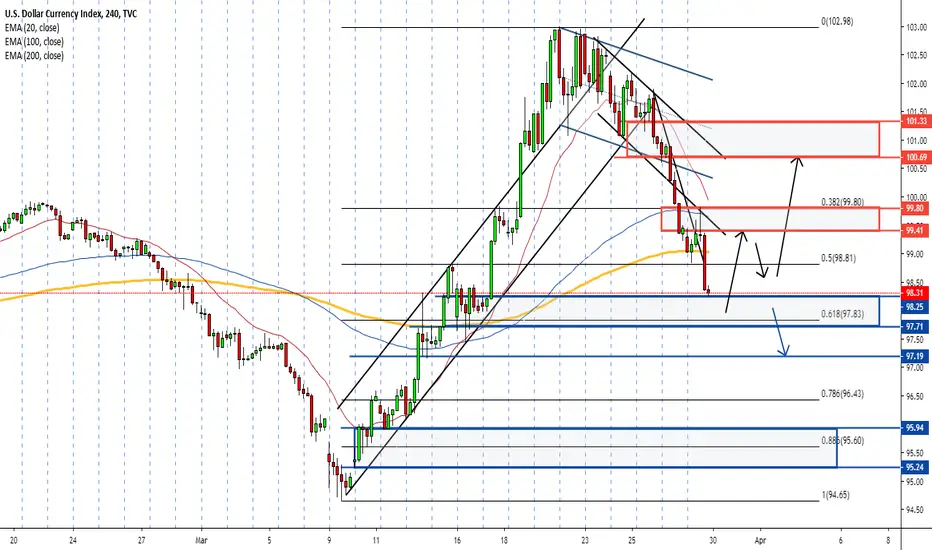
Dollar: Weekly Forecast 13th - 17th April 2020The dollar completed 2 minor bullish waves and started to fall last week.
Looking at the bigger picture, the dollar actually started to fall again from the top of the near 2-year rising channel.
The dollar is no longer strengthening as the US economy undergone a huge setback in the face of the pandemic.
The fed is currently printing an unlimited amount of money to support the economy and increased supply of the dollar will naturally weaken the dollar eventually.
Just before the market closes last week, the price fell and broke below an inside bar candlestick formation, signalling that price has more to fall.
In this week, we can wait for the price to retrace upwards and look for selling opportunities again between 99.8 - 100.

Gold: Weekly Forecast 6th - 10th April 2020The gold fell on the 2nd trading day last week as it broke below the bottom of a minor range between 1640 and 1590.
However, a strong pullback occurred at 1560 which eventually send the price back to where it started at the end of the week.
Despite the prolonged pullback, we expect the price to continue falling this week as most sellers trapped at the bottom chasing after the falling trend should be wiped out mostly.
Trades can look to sell anywhere from the current price to 1630 but watch closely for more selling pressure.
A break below of 1606 will allows a stronger trend to continue and the first target is seen at 1585 to 1575.

Dollar: Weekly Forecast 6th - 10th April 2020The dollar climbed through the week despite extremely weak employment data.
The NFP result was pretty much expected and the market could already have digested the fact way before the release.
During a pandemic where businesses stop running and people stop working across the globe, it's natural that the labour market will suffer a huge blow.
The dollar had rebounded off and climbed steadily from a critical demand zone around 98, forming a rising channel in the process.
The price is currently positioned at the top of the channel with a sign of resistance but lacking in selling pressure.
In this week, the dollar is likely to climb further and possibly breaking through the top of the channel and go deep into the supply zone around 101.
If the price continues to climb, strong resistance will definitely be seen as it reaches beyond 102.
If the price were to come off at first, there will be an opportunity to go for intraday long at 100.3 - 100.1.

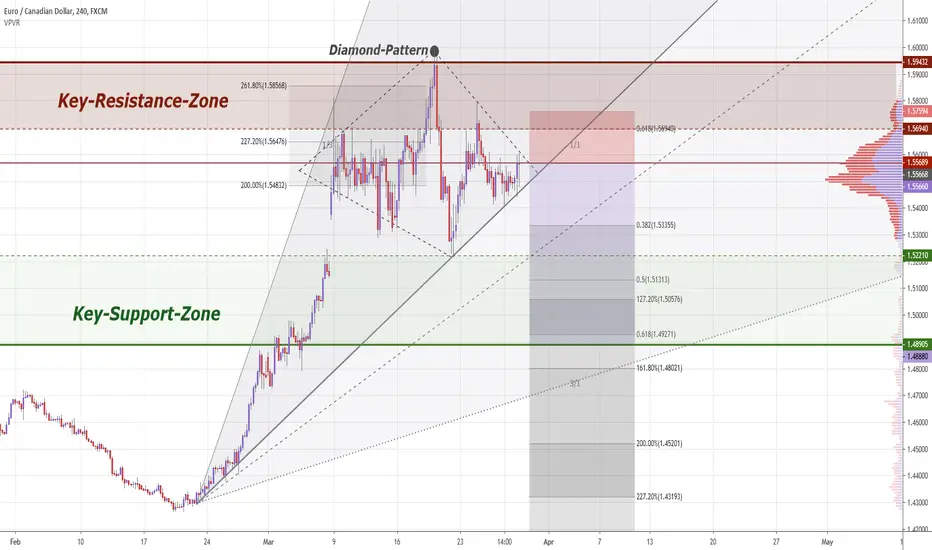
EUR/CAD SELL SIGNALHey tradomaniacs,
welcome to another free trade-plan.
Important: This is meant to be a preparation for you. As always we will have to wait for a breakout and confirmation of this Diamond-Pattern.
Market Sell: 1,55680
Stop-loss: 1,57600
Target 1: 1,52220
Target 2: 1,51000
Target 3: 1,48900
LEAVE A LIKE AND A COMMENT - I appreciate every support! =)
Peace and good trades
Irasor
Wanna see more? Don`t forget to follow me.
Any questions? PM me. :-)
Gold: Weekly Forecast 30th March - 3rd April 2020Can the gold price continue to appreciate? Or is the price too high and unattractive to investors OR perhaps it's another good opportunity to liquidate gold for cash in the face of another probable market crash?
We have seen the gold has been ranging throughout the week since it recovered and broke above the key retracement level 61.8%.
The demand to store value in gold came as the price was hit very hard, diminishing close to 15% of its highest value in just a matter of one week.
It was a pretty good bargain to invest in gold again just a couple of weeks ago.
However, will the panic remain contained? Has the stock market started to truly recover? Was the gold price really cheap to invest at all?
To the above questions, unlikely NO!
When we see that every government and central bank are coming out with so much stimulus package and fiscal policies to hold the market from crashing, we know that this is far from over.
The gold price will drop again and it's very unlikely it can break higher this time.
For all you know, the gold price could come tumbling down when the market opens this week.
Should the price continues to climb, we can look to sell again from 1650 to 1670, targeting 1540, 1495 and 1460.

Dollar: Weekly Forecast 30th March - 3rd April 2020The dollar had one of the biggest falls in more than a decade but not with surprise.
It had one of the biggest surges just the week before and therefore the magnitude of the pullback is just understandable.
The dollar was in high demand due to large liquidation of gold for cash caused by plunging stock prices.
Last week, the stock market rebounded and recovered strongly as the Fed relaunched QE in an unlimited volume, thus calming the market and improve confidence.
Gold rebounded as well and naturally demand for the dollar dropped as a result, falling from a peak of 103 to 98.
This week, the dollar is most likely to keep supported and range for awhile within the crucial demand zone around 98.
Should the price rebounded, the first target is seen at 99.6, follow by 101.
Otherwise, if the price breaks below the current demand zone, the next target will be 97.6 and finally 96.
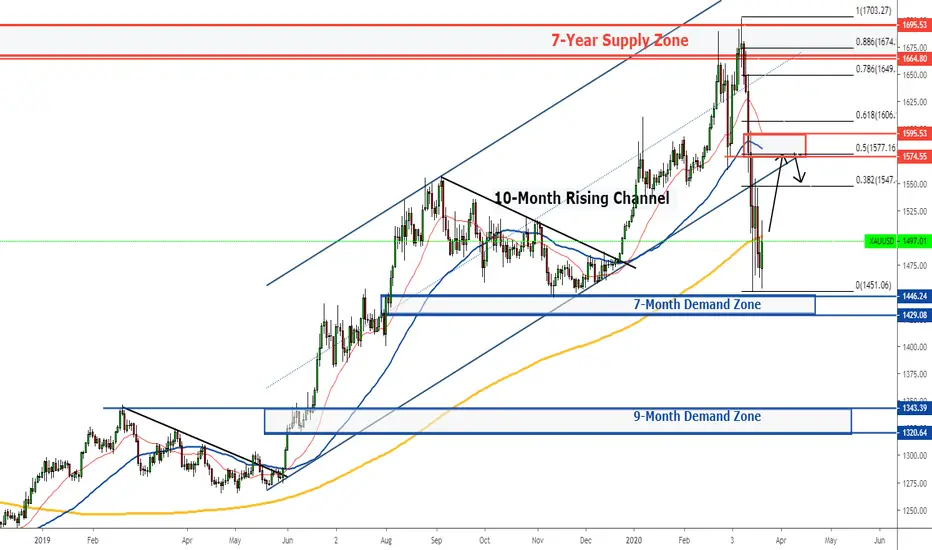
Gold: Weekly Forecast 23rd - 27th March 2020The gold continued to plunge first since it broke below the bottom of a 10-month rising channel.
It quickly found support and pulled back strongly just above 1450 and a 7-month demand zone.
The rebound also caused a falling trendline in the H1 chart to be broken which led gold into a range between 1450 and 1550.
Although the price has continued to create lower highs in the range, the lows have also started to inch higher with strong rebounds.
The gold is most probably oversold and a stronger upwards pullback could be required before the next wave of a selloff, which is most likely coupled with the next big plunge of the stock market.
Should the price pulls back, we can look to sell again at the supply zone from 1580 onward, which is also the bottom of the previously broken rising channel.
Dollar: Weekly Forecast 23rd - 27th March 2020"Not until the dollar breaks above 100, we will keep a bearish stance" was what I've mentioned in the previous forecast.
Apparently, once it broke 100 psychological level, the price surged all the way to 103.8, deep into a 3-year supply zone.
Although the Fed has cut rate to almost zero, the demand for the dollar was still high amid panic selling of the stock market due to the coronavirus.
Many central banks have also been reducing rates or easing monetary policy and one of the most prominent ones was the ECB which has relaunched and full-scale QE.
A double is currently seen forming within the 3-year supply zone and could cause the dollar to pull back further into the previous rising channel.
Look for support and rebound as the price enters into the demand zone around 101 for a buying opportunity again and aim at the previous high of 103.8, or even higher.

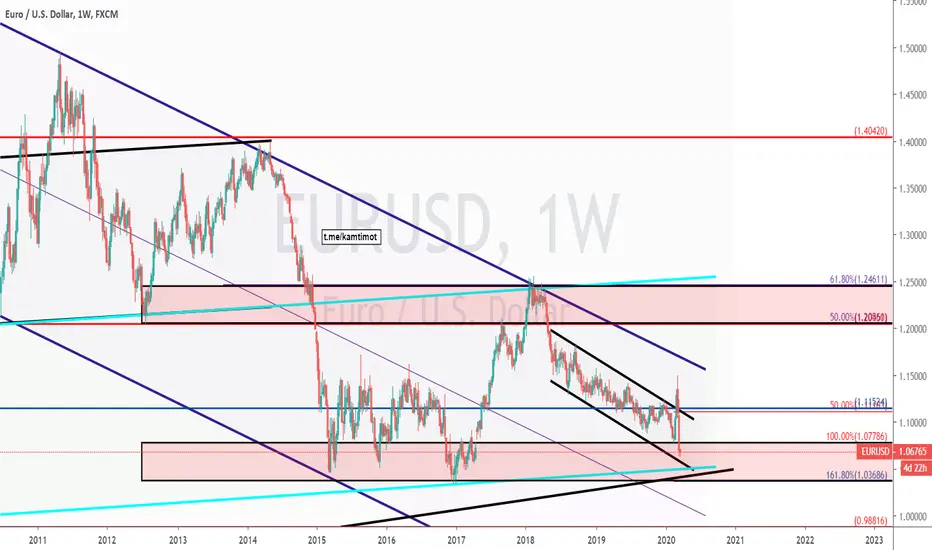
EURUSD: Weekly Forecast 16th - 20th March 2020EURUSD fell for 4 consecutive days after facing strong resistance at a 13-month supply zone just before 1.15.
The price was saw supported twice around 1.1060 which is also the Fibo retracement 61.8%.
However, the price did close more bearish by the time the market close and is most likely to dip lower.
Look for buy opportunity as the price pulls back into the demand zone around 1.10, which also coincides with the top of the previously broken 21-month falling channel.

Dollar: Weekly Forecast 16th - 20th March 20202 things happened as our forecast last week:
1) The dollar broke new low and reach the 17-month demand zone around 95
2) The dollar pulled back into the supply zone sitting above 97.
But what was unexpected was the consecutive gain up to 4 days which caused the dollar to recover more than 75% of the previous bearish trend.
It seems that the outbreak of the coronavirus has continued to cause more fear and drove demand for safe-haven assets such as the dollar again.
Nevertheless, the dollar is about to face strong resistance from 99 onwards.
The Fed is also expected to cut rate by another 0.25%-0.5% in the coming Fed Fund rate decision.
Not until the dollar breaks 100, we will keep a bearish stance and look for opportunities to sell the dollar again.

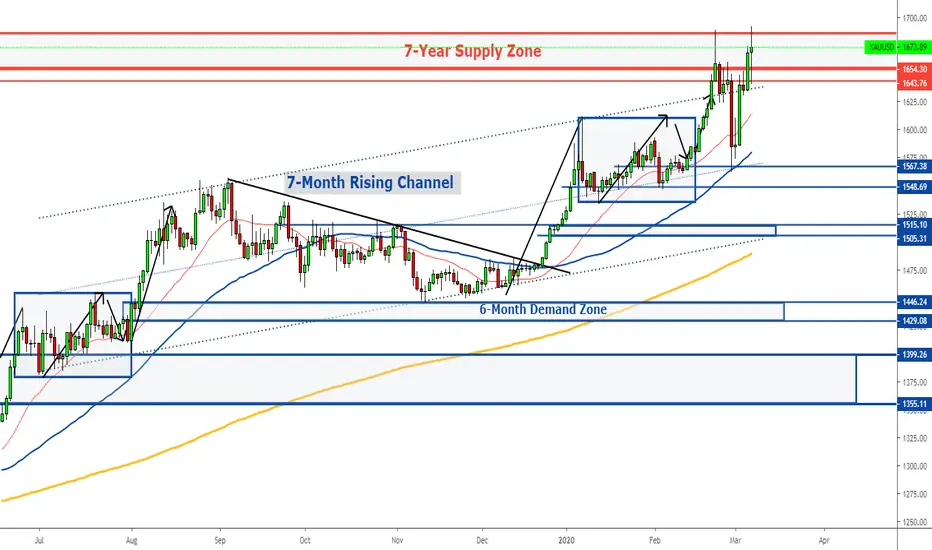
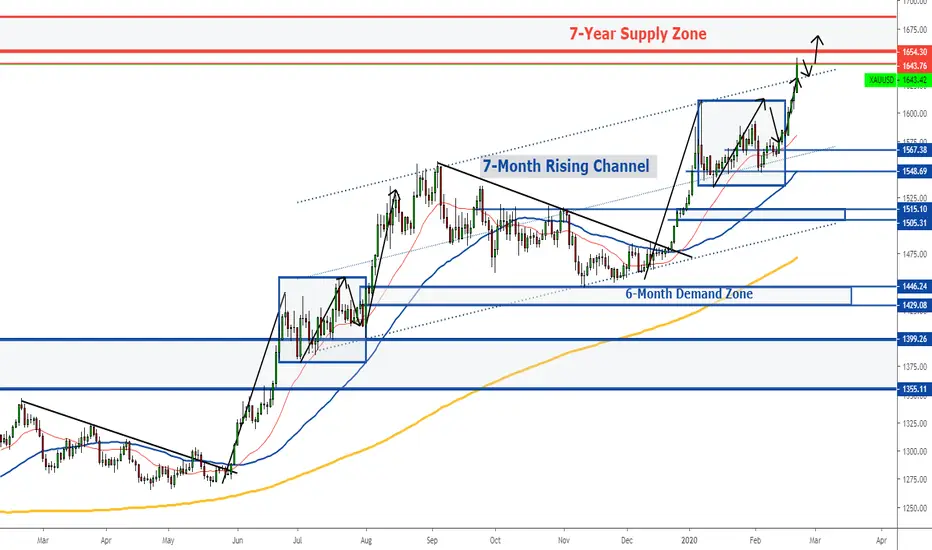
Gold: Weekly Forecast 24th - 28th February 2020The gold achieved the highest closing price in 85 months last week.
The price has climbed continuously throughout the week and regained all losses from the previous week.
It is worth to note that three major central banks announced a rate cut in the same week, with one of them been an emergency rate cut and it was none other than the Fed.
This is already a very major sign of a worsening economic downturn globally and risk sentiment will continue to increase with the spread of the coronavirus, jeopardising business activities on a global scale.
At the current rate, the gold is expected to climb much further than what was expected in late 2019.
It was first projected to peak at 1620 but was very soon surpassed, and the current projection can easily hit 1800.
In fact, the gold could break its historical high of 1920, should the current situation develops into the next financial crisis since 2008.
This week, we expect the gold to pull back at first as the dollar rebounds off from a low.
We will be watching the current demand zone around 1640 to buy the gold.
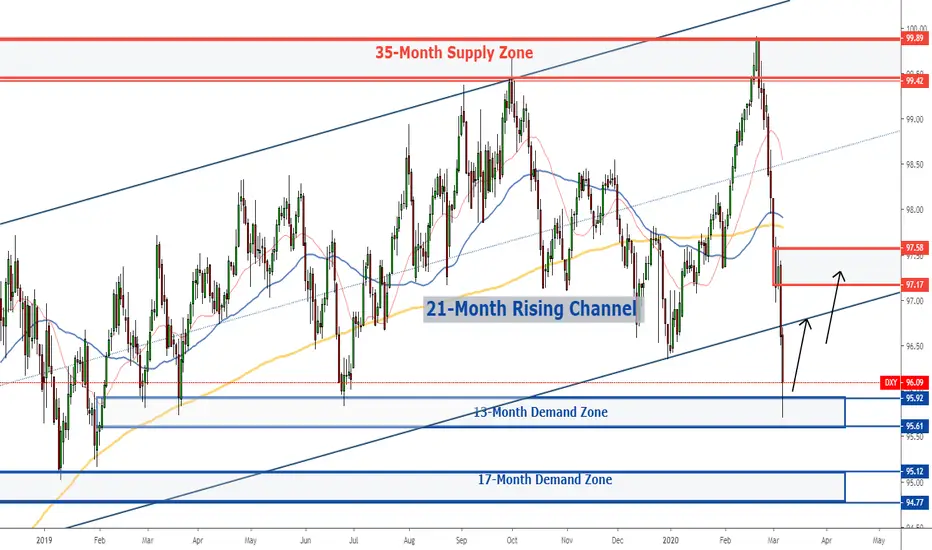
Dollar: Weekly Forecast 9th - 13th March 2020The dollar plunged for a second week and the had the biggest dropped in a week in 4 years.
The acceleration of the slide was most definitely caused by an emergency rate cut by the Fed.
However, the US market labour posted strong employment numbers and a drop in the unemployment rate back to an all-time low.
The dollar has probably gone too far into an oversold zone and a pullback should be taking place due to demand from a 13-month low.
Nevertheless, the dollar might have turned technically bearish as it broke below the bottom of a 21-month rising channel.
This week, we expect the dollar to pull back towards a short-term supply zone just above 97.
However, should the price continues to fall, the next target will be the 17-month demand zone around 95.
EUR/CAD: SELL SETUP with high probabillityHey tradomaniacs,
right now we can see a clear move into a zone if high potential of bearish confluence as we hit two trendlines and a strong resistannce-zone.
This could be a price-zone where the breakout of the previous Trendline (a) could continue.
Watch out for fakeouts to the topside before entering. ;-)
LEAVE A LIKE AND A COMMENT - I appreciate every support! =)
Peace and good trades
Irasor
Wanna see more? Don`t forget to follow me.
Any questions? PM me. :-)

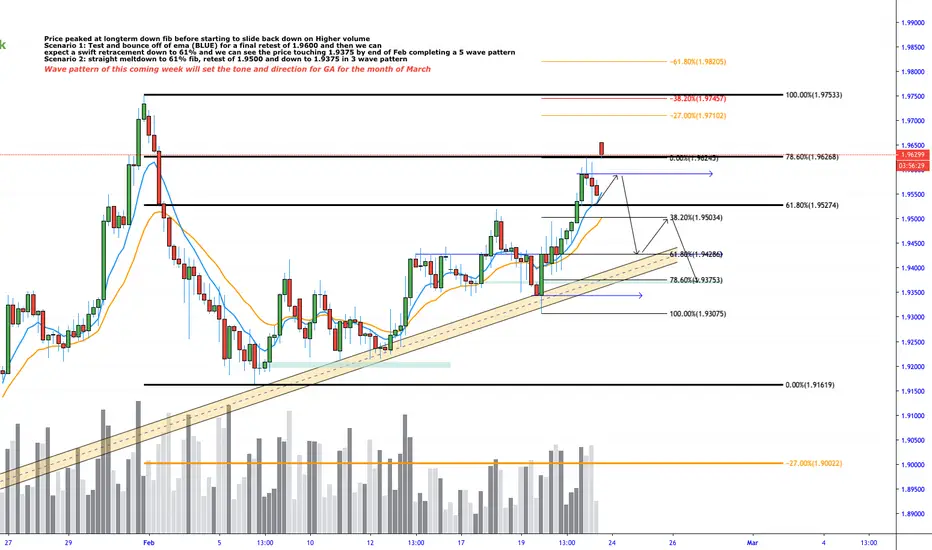
GBPAUD W8 Price peaked at longterm down fib before starting to slide back down on Higher volume
Scenario 1: Test and bounce off of ema (BLUE) for a final retest of 1.9600 and then we can
expect a swift retracement down to 61% and we can see the price touching 1.9375 by end of Feb completing a 5 wave pattern
Scenario 2: straight meltdown to 61% fib, retest of 1.9500 and down to 1.9375 in 3 wave pattern
Gold: Weekly Forecast 24th - 28th February 2020I left the gold chart almost unchanged from early February.
The price movement turned out almost like what I've forecast - a quick pullback and then a new bullish trend to send the price to a new high.
This is the power of how repeating pattern is and how you can make great trading decisions.
As of current, the gold is expected to continue climbing this week.
There will be a short and small pullback and the price will continue to break new high before you realise.
So stay alert this week and try entering small buy positions as the price pulls back.
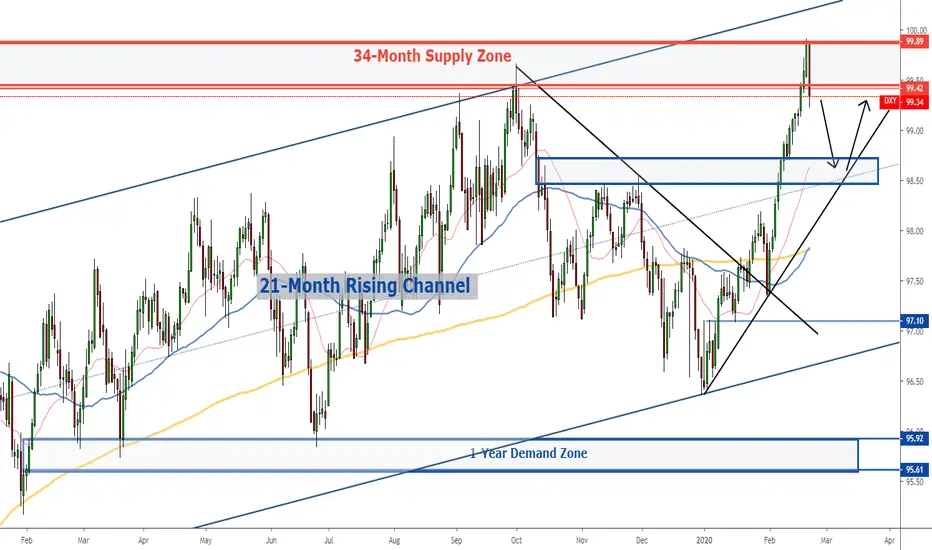
Dollar: Weekly Forecast 24th - 28th February 2020The dollar broke a 34-month high but faced strong resistance just before reaching 100.
The reversal came as soon as the U.S. reported a disappointing Markit manufacturing and services PMI.
But what really caused the dollar to fall is simply due to overbought sentiment.
The pullback is most likely temporary but the price is most likely to retrace further before it rebounds and resumes appreciation.
Watch for the demand zone at 98.7 to buy the dollar again.