XAUUSD (GOLD): Wait For The BOS! FOMC and NFP Looms!In this Weekly Market Forecast, we will analyze the Gold (XAUUSD) for the week of July 28 - June 1st.
Gold is in the middle of a consolidation. Bas time to look for new entries!
FOMC on Wednesday and NFP on Friday. Potential news drivers to move price in a decisive direction!
Wait for a break of structure (BOS) either direction before entering a new trade.
Be mindful that the Monthly is bullish, and the Weekly is neutral.
The Daily is bearish, with 3 days of data indicating so. I am leaning towards this bias, as the draws on liquidity are near and obvious.
Enjoy!
May profits be upon you.
Leave any questions or comments in the comment section.
I appreciate any feedback from my viewers!
Like and/or subscribe if you want more accurate analysis.
Thank you so much!
Disclaimer:
I do not provide personal investment advice and I am not a qualified licensed investment advisor.
All information found here, including any ideas, opinions, views, predictions, forecasts, commentaries, suggestions, expressed or implied herein, are for informational, entertainment or educational purposes only and should not be construed as personal investment advice. While the information provided is believed to be accurate, it may include errors or inaccuracies.
I will not and cannot be held liable for any actions you take as a result of anything you read here.
Conduct your own due diligence, or consult a licensed financial advisor or broker before making any and all investment decisions. Any investments, trades, speculations, or decisions made on the basis of any information found on this channel, expressed or implied herein, are committed at your own risk, financial or otherwise.
Weeklymarketsanalysis

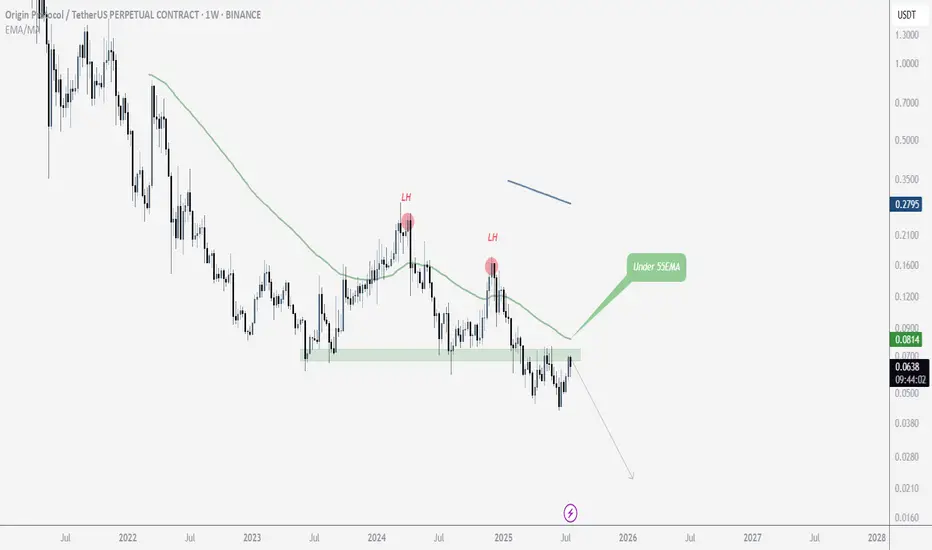
$OGN OGN is in a broader downtrend on the weekly timeframe, consistently forming lower highs (LH). This presents a good opportunity to consider entering a short position. It's worth keeping an eye on it
XAUUSD Gold closed bearish and I’ll continue looking for sells. I’d prefer gold to retrace and create a LH and continue selling towards 3310. Last time price was around 3310, it had a massive bullish run so that’ll be the only area I’d sell to unless price breaks that support.

Inflation vs. Growth : Is the Fed Behind or Ahead of the Curve?CME_MINI:NQ1! CME_MINI:ES1! CME_MINI:MNQ1! CME_MINI:MES1! CBOT:ZN1!
Fed Policy recap:
There is an interesting and unusual theme to keep an eye on this week. The Fed is in a ‘blackout period’ until the FOMC meeting- this is a customary quiet period ahead of an FOMC policy meeting. Fed Chair Powell is scheduled to give a public talk on Tuesday. Although his address will be focused on the capital framework of the large banks, this appearance will be closely watched for any subtle signals on the FOMC policy stance.
Especially given that last week, Federal Reserve Governor Chris Waller made a speech, “The Case for Cutting Now” with a purpose as he stated to explain why the FOMC should reduce rate by 25 bps at the July 30th, 2025 meeting.
His stated reasons were:
1. Tariffs create one-off price level increases with transitory inflation effects, not sustained inflation momentum.
2. He argued that much of economic data points towards interest rates should be lowered to FOMC’s participants' median neutral rate, i.e, 3%.
3. His third stated reason notes that while the state of the labor market looks resilient on the surface, accounting for expected data revisions, private-sector payroll growth has peaked, with more data suggesting increased downside risks.
His speech further explains:
• Growth has decelerated sharply: Real GDP rose only ~1% annualized in 1H25, a significant slowdown from 2.8% in 2H24, and well below long-run potential.
• Consumer spending is weakening, with real PCE growth falling to ~1%, and June retail sales showing soft underlying momentum.
• Broader labor market indicators, including the Beige Book and JOLTS data, show declining labor demand and hiring caution, suggesting increasing downside risks to employment.
• Inflation is slightly above target (PCE ~2.5%) but driven primarily by temporary, one-off tariff effects. Core inflation ex-tariffs is likely near 2%, and expectations remain anchored.
• Current fed funds range (4.25%–4.50%) is well above neutral (3%), implying excessive restraint.
• With inflation risks subdued and macro conditions deteriorating, a preemptive rate cut now provides optionality and avoids falling behind the curve if the slowdown deepens. Further cuts may be warranted if trends persist.
• The tax bill contains pro-growth provisions, but its economic impact is expected to be minimal in 2025.
Source: Federal Reserve Speech, The Case for Cutting Now Governor Waller
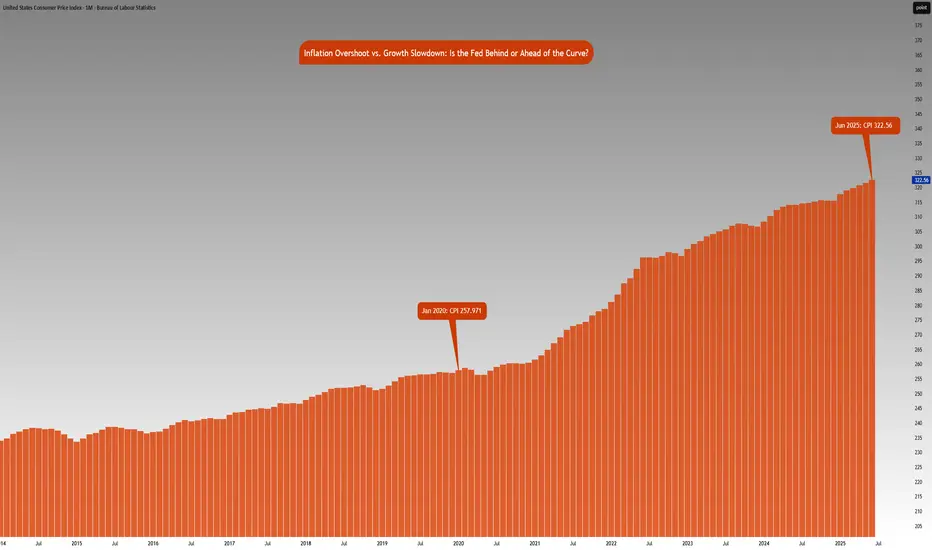
Inflation Analysis:
Let’s compare this with what we have previously mentioned regarding inflation. CPI index stood at 257.971 points in January 2020. Projecting this at a 2% Fed target, June 2025 inflation should be around 287.655 points. However, June 2025 inflation is currently at 322.56 index points, 12.2% higher above 2% the inflation trend. Effectively, this means annualized inflation since January 2020 is roughly 4.15%.
The Fed is in a real dilemma whether cutting rates given the inflation trend in the last 5 years and risks to inflation outlook justify cutting rates.
Key Questions to ask
Markets are forward looking. Investors and participants want to know:
• How will the rates impact the cost of debt service? Currently the third largest government expenditure, over $1.03 trillion.
• Will the tariff rate offset the tax revenue losses by extending tax cuts?
• Is the fiscal path sustainable?
• What happens to the long end of the yield-curve?
• Will the Fed monetize the debt issuance imbalance?
• Is this simply Governor Waller positioning himself for the next appointment of Fed Chair when Fed Chair Powell’s term expires in May 2026?
It seems there is a huge conflict between longer term implications vs quick short term fixes that align with US administration objectives.
The Week ahead:
It is a relatively light economic calendar in the US. Flash PMI readings and housing data on the docket. The primary focus as it has been for most weeks since President Trump took office, will be on the developments in trade policy and any further comments on Fed and Chair Powell. The threat of renewed tariffs starting August 1st, is also key to monitor and whether these protectionist measures will force US’s trading partners to make further concessions to negotiate trade deals.
The earnings season is off to a good start with major US banks reporting higher EPS and revenue than expectations. This week investors will be looking at Q2 earnings reports from Alphabet, Meta, Microsoft from the Mag 7 and Tesla.
Market Insights with Gary Thomson: 21 - 25 JulyMarket Insights with Gary Thomson: RBA Minutes, BoJ Speech, ECB Decision, UK Sales, Earnings Reports
In this video, we’ll explore the key economic events, market trends, and corporate news shaping the financial landscape. Get ready for expert insights into forex, commodities, and stocks to help you navigate the week ahead. Let’s dive in!
In this episode of Market Insights, Gary Thomson unpacks the strategic implications of the week’s most critical events driving global markets.
👉 Key topics covered in this episode:
— RBA Meeting Minutes
— BoJ Deputy Governor Uchida Speech
— ECB Interest Rate Decision & Press Conference
— UK Retail Sales
— Corporate Earnings Statements
Don’t miss out—gain insights to stay ahead in your trading journey.
This video represents the opinion of the Companies operating under the FXOpen brand only. It is not to be construed as an offer, solicitation, or recommendation with respect to products and services provided by the Companies operating under the FXOpen brand, nor is it to be considered financial advice.

Weekly Macro Brief: Chinese Economic Data, US Inflation, Tariff CME_MINI:ES1! CME_MINI:NQ1! COMEX:GC1! CME:BTC1! CME_MINI:RTY1! COMEX:SI1! CME_MINI:MNQ1! NYMEX:CL1! CME_MINI:M6E1! CBOT:ZN1! CME_MINI:MES1!
Highlights this week include Chinese economic data points, UK CPI, US CPI, PPI, and Retail Sales. Inflation data is key, as it comes ahead of the Fed's meeting on July 30th, 2025.
Market participants, including institutional investors and futures brokers like EdgeClear, will be scrutinizing these data points closely to monitor global growth and underlying inflation pressures.
Fed speakers are scheduled throughout the week. With increasing calls for Fed Chair Powell voluntary resignation and impeachment, the US administration desiring lower rates, the Fed’s independence and credibility to carry out its dual mandate is at risk. It will be interesting to monitor who folds first. Last week’s FOMC minutes revealed a divided Fed on the interest rate outlook, affirming its June dot plot.
On the fiscal policy front, we are already witnessing a shift in global trade policies, with many nations making concessions to negotiate trade deals with the world’s largest economy. In our analysis, the inflation impact of tariffs may not show up until Q4 2025 or early 2026, as tariff threats are mostly used as a lever to negotiate deals. While effective tariff rates have increased, as Trump reshapes how tariffs are viewed, cost pass-through to consumers will be limited in Q3 2025, as companies’ front-loaded inventory helps mitigate the risks of increased tariff exposure.
So, what we have is an interesting development shaping up where, while inflation may rise and remain sticky, it is yet to be seen whether slowing consumer spending will weaken enough to the point where companies have to start offering discounts, which would nullify the tariff risk to the end consumer and result in companies absorbing all tariffs. This scenario will see reduced earnings margins leading into the last quarter and early 2026. However, it will materially reduce risks of higher inflation.
In summary, the complex interplay between tariffs, inflation, and consumer behavior presents critical considerations for traders. EdgeClear, as a dedicated futures broker, remains focused on equipping clients with the insights needed to help navigate this evolving macroeconomic environment.
Overnight Data Recap:
• Chinese Trade Balance (CNY)(Jun) 826.0B (Prev. 743.6B)
• Chinese Trade Balance USD* (Jun) 114.77B vs. Exp. 109.0B (Prev. 103.22B)
• Chinese Imports YY* (Jun) 1.1% vs. Exp. 1.3% (Prev. -3.4%)
• Chinese Exports YY* (Jun) 5.8% vs. Exp. 5.0% (Prev. 4.8%)
Key Economic Releases:
• MON: EU 90-Day Retaliatory Pause Ends
• TUE: OPEC MOMR, Chinese House Prices (Jun), Retail Sales (Jun), GDP (Q2), EZ Industrial Production (May), German ZEW (Jun), US CPI (Jun), NY Fed Manufacturing (Jul), Canadian CPI (Jun)
• WED: UK CPI (Jun), EZ Trade (May), US PPI (Jun), Industrial Production (Jun)
• THU: Japanese Trade Balance (Jun), EZ Final HICP (Jun), US Export/Import Prices (Jun), Weekly Claims, Philadelphia Fed (Jul), Retail Sales (Jun)
• FRI: Japanese CPI (Jun), German Producer Prices (Jun), US Building Permits/Housing Starts (Jun), Uni. of Michigan Prelim. (Jul)
China GDP / Retail Sales/ Housing (TUE):
• Q2 GDP is expected to slow to 5.1% Y/Y (vs 5.4% in Q1) and 0.9% Q/Q.
• Retail sales have been resilient, but industrial production and investment show signs of weakness; deflation and labor market concerns persist.
• Property prices continue to decline, fueling stimulus speculation; policymakers remain cautious, with only modest easing expected (LPR and RRR cuts in Q4).
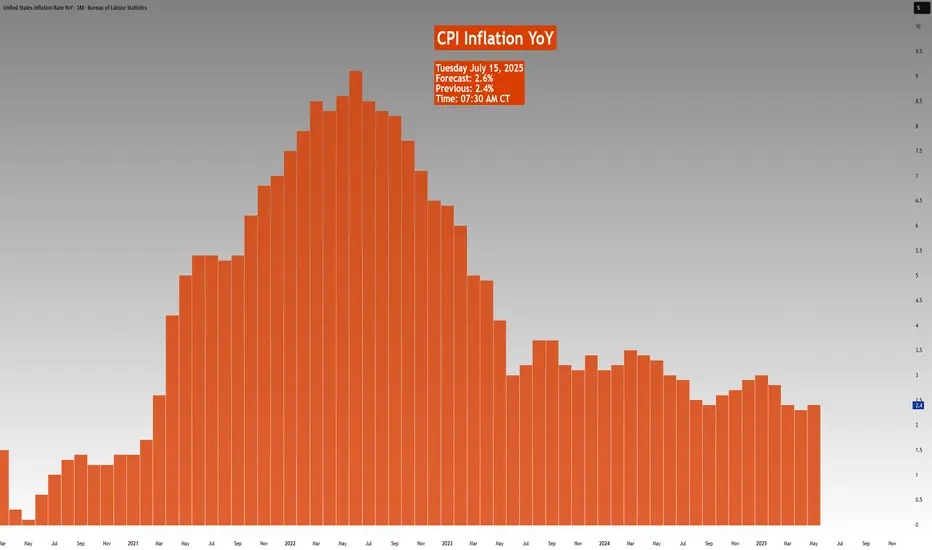
US CPI (TUE)
• June CPI expected at +0.3% M/M headline and core, suggesting a modest rebound from May’s subdued figures.
• Inflation impact from tariffs seen as temporary; Fed officials maintain a cautious stance with possible rate cuts only if price pressures stay benign.
• Markets are pricing near-zero odds for a July rate cut, but still expect two 25bps cuts by year-end in line with Fed guidance.
US Retail Sales (THU):
• Headline June retail sales expected flat M/M; ex-autos expected to rise +0.3%, showing signs of consumer stabilization.
• BofA data shows mild spending rebound, though discretionary service spending continues to weaken, especially among lower-income households.
• Spending strength remains concentrated in higher-income cohorts; weakness in wage growth limits broader consumption momentum.
US Trade Tensions – Tariffs & Negotiations:
• Trump announced 30% tariffs on EU and Mexican goods effective August 1st, separate from sector-specific tariffs.
• Trump stated the EU is engaging in talks and South Korea is also pursuing a trade deal.
Mexico Response:
• President Sheinbaum expects a deal before August 1st but reaffirmed Mexican sovereignty is non-negotiable.
• Mexico’s Economy Ministry is negotiating to protect domestic firms and workers, aiming for an alternative resolution.
EU Response:
• European Commission President von der Leyen warned that 30% tariffs would disrupt key transatlantic supply chains.
• The EU will extend suspension of countermeasures until early August but is prepared to respond proportionally if needed.
• The EU prefers a negotiated solution and dropped plans for a digital tax, seen as a concession to US tech interests.
• Separately, the EU is drafting a broad corporate tax on firms with turnover above EUR 50 million to support its budget.
Market Insights with Gary Thomson: 14 - 18 JulyMarket Insights with Gary Thomson: Inflation Rate in Canada, US, and UK, US PPI, Earnings Reports
In this video, we’ll explore the key economic events, market trends, and corporate news shaping the financial landscape. Get ready for expert insights into forex, commodities, and stocks to help you navigate the week ahead. Let’s dive in!
In this episode of Market Insights, Gary Thomson unpacks the strategic implications of the week’s most critical events driving global markets.
👉 Key topics covered in this episode:
— Inflation Rate in Canada
— US Inflation Rate
— UK Inflation Rate
— US Producer Price Index
— Corporate Earnings Statements
Don’t miss out—gain insights to stay ahead in your trading journey.
This video represents the opinion of the Companies operating under the FXOpen brand only. It is not to be construed as an offer, solicitation, or recommendation with respect to products and services provided by the Companies operating under the FXOpen brand, nor is it to be considered financial advice.

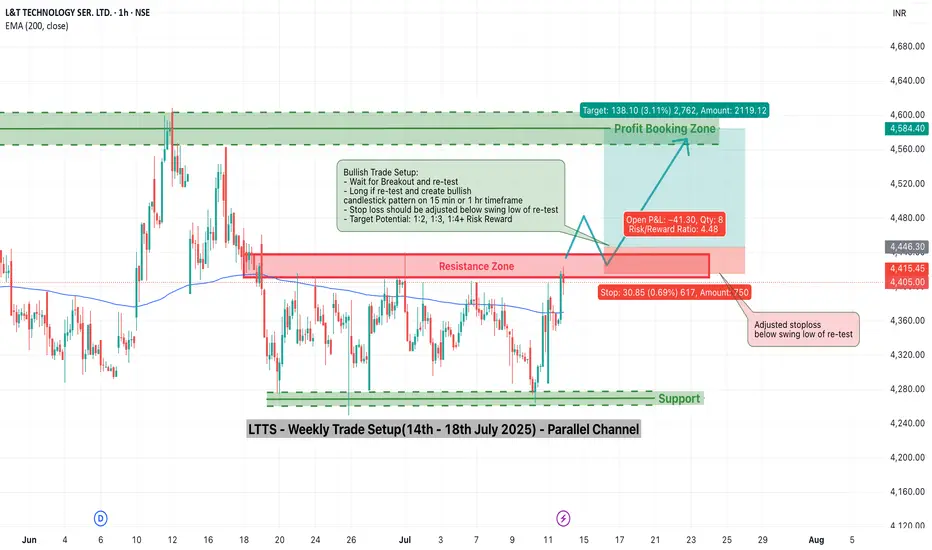
LTTS Weekly Trade Setup(14th-18th July 2025) – Parallel ChannelThis week, L&T Technology Services (LTTS) is showing a potential breakout opportunity that requires patience and precision. As the stock approaches a key resistance zone near ₹4445, traders should resist the urge to jump in early and instead wait for a breakout and confirmed re-test before entering any long positions.
Let’s break this down.
1. Why the Breakout is Important
- LTTS has been consolidating within a parallel channel between ₹4280 (support) and ₹4445 (resistance). Breakouts from such structures often trigger significant moves — but only when confirmed.
- A false breakout can trap early traders. Hence, waiting for the price to break above ₹4445 and then re-test this level is critical.
2. The Strategy – Wait and React
📌 Step 1: Watch for Breakout
Monitor price action as it approaches and breaches the ₹4445 resistance.
Look for strong bullish candles with volume to validate the breakout.
📌 Step 2: Wait for Re-test
After breakout, price may pull back to test the previous resistance.
This re-test acts as a confirmation that bulls are defending the breakout.
📌 Step 3: Look for Confirmation
Enter only when you see a bullish candlestick pattern (like a bullish engulfing or hammer) near the re-test level on 15-min or 1-hour charts.
🛡️ Stop Loss:
Place your stop below the swing low of the re-test.
This protects you if the breakout fails.
🎯 Target:
Profit booking zone is near ₹4580–₹4600.
Risk/reward ratio: 1:2, 1:3, 1:4+
3. Why Re-test Entries are Powerful
They allow low-risk entries with a tight stop loss.
You avoid chasing price and reduce emotional trading.
Confirmation helps you filter out false breakouts.
4. Final Words
In trading, discipline often beats speed. This LTTS setup is all about timing and structure.
🔔 Watch for the breakout.
🧘♂️ Wait for the re-test.
🎯 Enter only with confirmation.
If executed properly, this trade offers a clean, high R:R opportunity with a clearly defined setup.
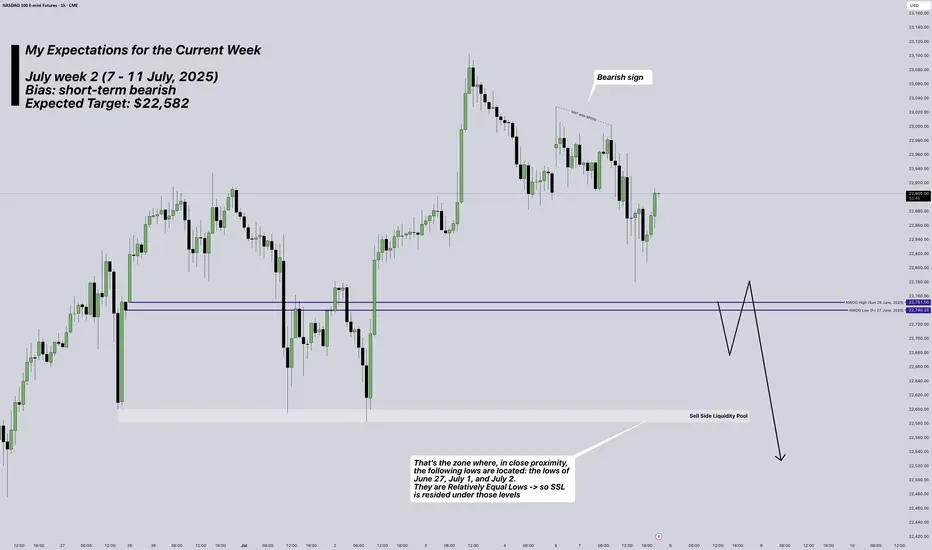
NASDAQ Futures: My Plan for current Week (7-11 July, 2025)Week: July 7–11, 2025
Instrument: NASDAQ Futures (NQ)
Trend: Overall, the market remains bullish, but for this week I anticipate a retracement targeting the $22,582 level.
Bias for the week: Bearish
Overview:
This week, I’m watching NQ for a potential move toward the $22,582 level. This expectation is based on how Thursday (July 3, 2025) played out—specifically the buy-side liquidity that was taken, and the clean sell-side liquidity pool left near $22,582.
I also find it notable how the NWOG (New Week Opening Gap) was opened and how price moved below it, which reinforces the short bias.
I would consider opening a short position once I see a confirmed 4H candle close below $22,760, otherwise no trades will be taken.
* Trade execution details will be published separately if my bias confirms.
* for more information -> review my notes on the chart
Market Insights with Gary Thomson: 7 - 11 JulyMarket Insights: RBA Cut in Focus, UK GDP Weakens, Canada Jobs, FOMC Clues, Tariff Deadline
From rate decisions to rising unemployment and tariff deadlines, this week’s macro landscape is shaped by evolving dynamics and shifting momentum. If you’re trading FX, commodities, or indices — this is a moment to pay close attention.
In this episode of Market Insights, Gary Thomson unpacks the strategic implications of the week’s biggest events:
— RBA Interest Rate Decision
— UK GDP Growth Rate
— Unemployment Rate in Canada
— FOMC Minutes
— Tariff Deadline
Don’t miss out—gain insights to stay ahead in your trading journey.
This video represents the opinion of the Companies operating under the FXOpen brand only. It is not to be construed as an offer, solicitation, or recommendation with respect to products and services provided by the Companies operating under the FXOpen brand, nor is it to be considered financial advice.

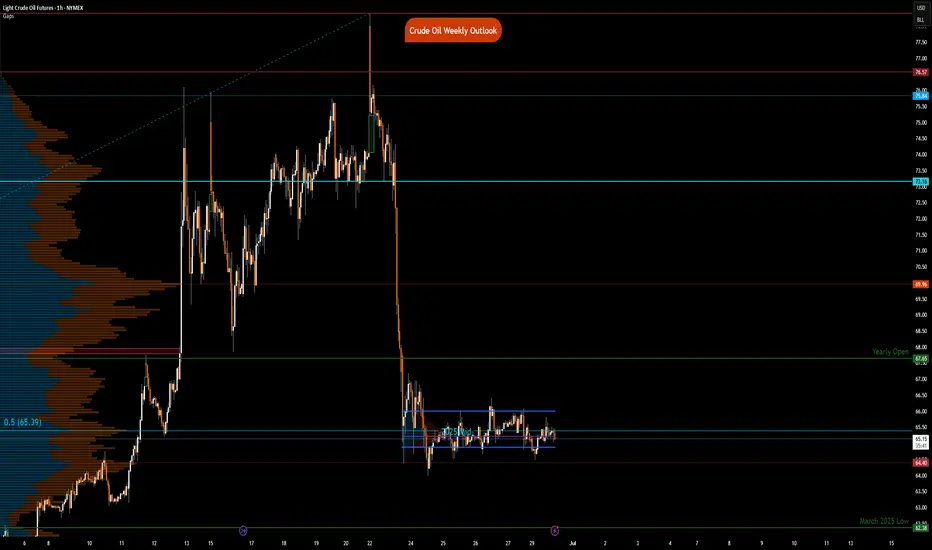
Crude Oil Weekly OutlookNYMEX:CL1! NYMEX:MCL1!
With Nasdaq futures hitting all-time highs, our attention now turns to Crude Oil, which has seen a sharp pullback over the past week.
All-time highs in equity indices present a unique challenge:
There are no historical reference points—no prior price or volume data to lean against. Traders typically turn to tools like Fibonacci extensions, measured moves, or rely on market-generated information and emerging intraday levels before making decisions.
What Has the Market Done?
Crude Oil Futures (CL) posted a record drop last week, falling sharply from a Sunday open high of $78.40 to a Monday close low of $64.38—a $14.02 decline.
This sharp sell-off followed developments suggesting a potential Iran–Israel ceasefire and the end of a two-week conflict, prompting markets to rapidly unwind the geopolitical risk premium.
What is it trying to do?
CL Futures have since consolidated around the 2025 mid-range. The market appears to be in a balancing phase, digesting the removal of war-related premiums and recalibrating based on fundamentals.
How Good of a Job Is It Doing?
Having effectively priced out war risk, the market is now refocusing on fundamentals.
The global demand outlook is improving, driven in part by progress in trade deals.
OPEC’s June Monthly Oil Market Report (MOMR) forecasts global oil demand growth of 1.3 mb/d for 2025.
This transition from headline risk to fundamental drivers indicates market maturity and resilience, albeit within a still-volatile regime.
What Is More Likely to Happen From Here?
Today marks the final trading day of the month, and seasonal demand will become increasingly relevant.
Summer weather and travel activity are expected to drive demand for jet fuel and gasoline.
These seasonal tailwinds, if sustained, could help stabilize price action around key technical zones.
Key Levels:
yOpen: 67.65
pHi: 66.09
pIB Hi: 66
2025 mid-range: 65.39
pLow: 64.80
Overnight Low: 64.55
Naked VPOC: 64.50
Scenario 1: Continued Consolidation (Balance Holds)
Crude oil maintains range-bound behavior.
Strategy: “Outside-in” trading—fade moves at range extremes until new directional information emerges.
Scenario 2: Break from Balance
If directional conviction builds, price could break the current consolidation.
Upside target: Yearly open near $67.65.
Downside risk: March 2025 low if $64.40 fails.
All intraday levels noted above should be monitored for structure and participation.
Market Insights with Gary Thomson: 30 June - 4 JulyMarket Insights with Gary Thomson: Eurozone Inflation, US Jobs, ISM PMIs, ECB Forum Updates
In this video, we’ll explore the key economic events, market trends, and corporate news shaping the financial landscape. Get ready for expert insights into forex, commodities, and stocks to help you navigate the week ahead. Let’s dive in!
In this episode, we discuss:
— Euro Area Inflation Rate YoY Flash
— US Nonfarm Payrolls and Unemployment Rate
— US ISM Manufacturing and Services PMI
— ECB Forum on Central Banking
Note: U.S. markets may see thin trading ahead of the 4 July holiday, raising volatility risks.
Don’t miss out—gain insights to stay ahead in your trading journey.
This video represents the opinion of the Companies operating under the FXOpen brand only. It is not to be construed as an offer, solicitation, or recommendation with respect to products and services provided by the Companies operating under the FXOpen brand, nor is it to be considered financial advice.

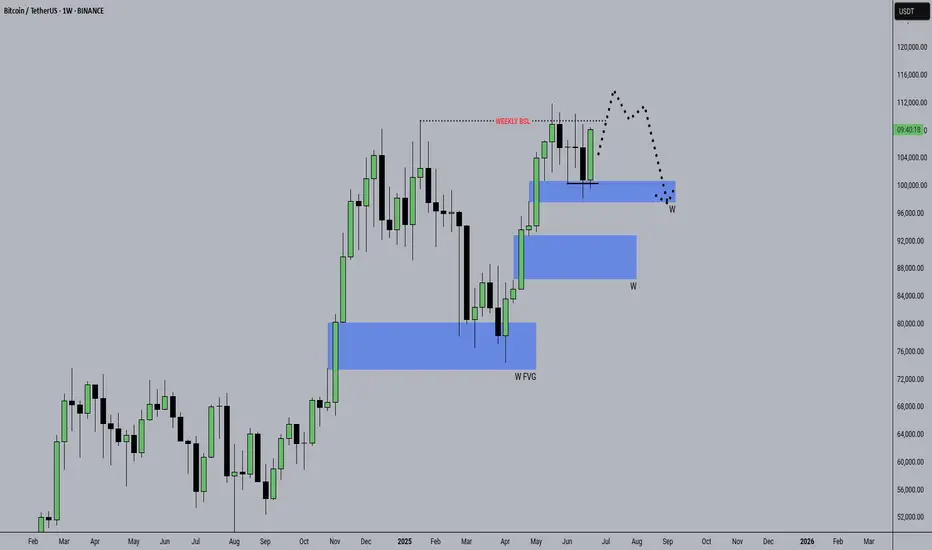
BTC may going low after ATH?Weekly Analysis:
- Market to go higher , as last week's weekly candle was very bullish
- May sweep Weekly Buyside Liquidity
- May move bearish towards the Weekly FVG
Market Insights with Gary Thomson: 23 - 27 JuneMarket Insights with Gary Thomson: Canada Inflation, US Core Consumer Metrics, and Earnings Reports
In this video, we’ll explore the key economic events, market trends, and corporate news shaping the financial landscape. Get ready for expert insights into forex, commodities, and stocks to help you navigate the week ahead. Let’s dive in!
In this episode, we discuss:
— Inflation Rate in Canada
— US Durable Goods Orders
— US PCE Price Index, Personal Income & Personal Spending
— Corporate Earnings Statements
Don’t miss out—gain insights to stay ahead in your trading journey.
This video represents the opinion of the Companies operating under the FXOpen brand only. It is not to be construed as an offer, solicitation, or recommendation with respect to products and services provided by the Companies operating under the FXOpen brand, nor is it to be considered financial advice.

WTI - ANALYSIS BUY AREA This week the ongoing conflict seems to bring more uptrend to this commodity
I believe that the last broken resistance now turning support at 67.300 will be tested prior to the OIL raising again
If the conflict doesn’t end and we don’t have a ceasefire we could see this commodity running to the 78.000 and 82.000 levels

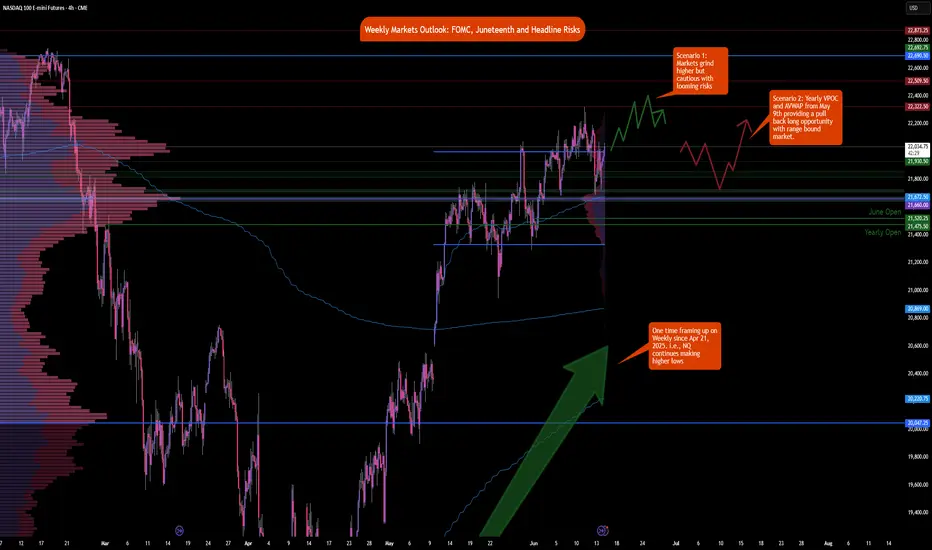
Weekly Market Outlook: FOMC, Trade Deals and GeopoliticsIt is a holiday-shortened week, with the majority of markets halting early on Thursday, June 19, 2025, in observance of Juneteenth. See here for holiday trading schedule
Key Themes to Monitor This Week
Geopolitical Risks
Any outside intervention in the ongoing Israel-Iran conflict will likely be seen as a risk-off event by market participants. Despite Friday’s sell-off, markets shrugged off during the Sunday open and overnight sessions.
There are potential risks to trade routes and energy infrastructure, although disruptions seem unlikely at the moment. Amena Bakr at Kpler noted that, so far, there are no signs of disruptions in oil loadings from Iran. Without a supply outage, there is no pressing need for additional barrels to be brought onto the market.
Trade War and Trade Deals
There have been recent developments with the U.S. reaching key trade deal milestones with several countries. The baseline scenario remains optimistic, with expectations for an extension in negotiations and potential reciprocal tariffs for countries failing to reach agreements.
FED Week
This is a key week for U.S. monetary policy, with the FOMC decision, Summary of Economic Projections (SEP), and Chair Powell’s press conference scheduled.
Traders will be closely watching how the Fed’s inflation and growth expectations have evolved, as reflected in the SEP. All eyes will be on the dot plot to note how interest rate expectations have evolved since last quarter. Of note: Will President Trump’s continued calls for rate cuts influence Chair Powell’s tone or guidance?
Expectations for the Week Ahead
NQ futures have continued one-time framing higher, consistently creating higher lows since the week of April 21, 2025. A strong support zone exists below, anchored at the yearly Volume Point of Control (VPOC) and the Anchored VWAP from May 11, 2025, when markets gapped higher.
Key Levels to Watch
• yVAH: 22,690.50
• R2: 22,510
• R1 / Previous Week High: 22,322.50
• May 11 AVWAP: 21,672.25
• yVPOC: 21,660
Scenario 1: Market Grinds Higher but Stays Cautious
Despite several looming risk factors, the market could continue to grind higher. In this scenario, we anticipate a test above the prior week's high, followed by a potential pullback into last week’s range.
Example Trade Idea 1
• Entry: 22,000
• Stop: 21,930
• Target: 22,322
• Risk: 70 pts
• Reward: 322 pts
• Risk-Reward Ratio: 4.6R
Scenario 2: Pullback to Support, Range-Bound Consolidation
If the market pulls back, we expect the yearly VPOC and AVWAP from May 11 to act as key support levels. In this case, price action may remain range-bound within the previous week’s range, forming an inside week.
Example Trade Idea 2
• Entry: 21,672
• Stop: 21,600
• Target: 22,000
• Risk: 72 pts
• Reward: 328 pts
• Risk-Reward Ratio: 4.6R
________________________________________
Glossary
• VPOC: Volume Point of Control
• VA: Value Area
• VAL: Value Area Low
• VAH: Value Area High
• VP: Volume Profile
• AVP: Anchored Volume Profile
• Y: Yearly
• pWk: Previous Week
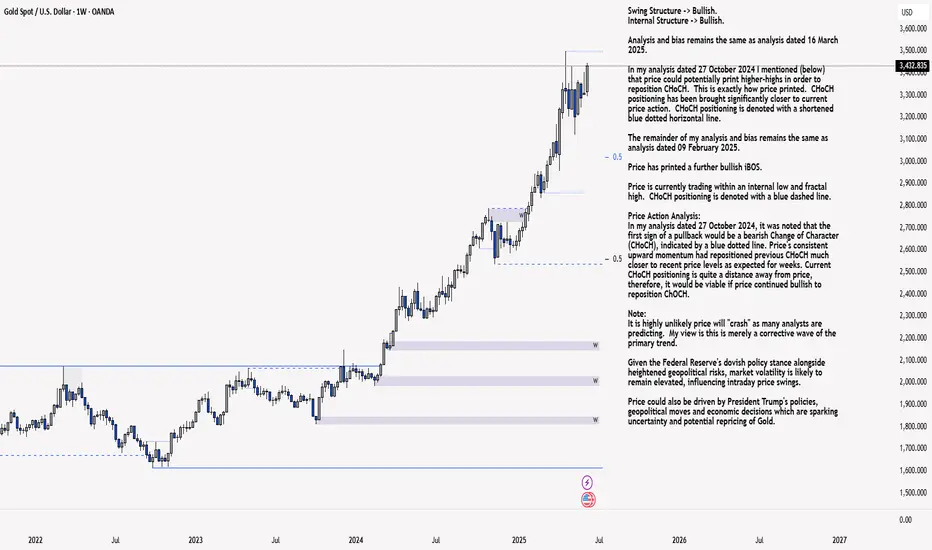
XAU/USD 16-20 June 2025 Weekly AnalysisWeekly Analysis:
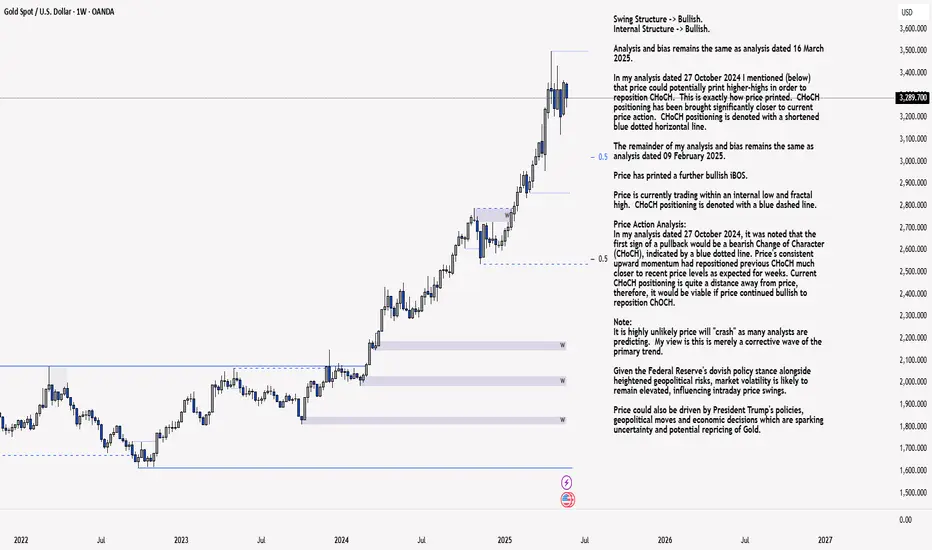
Swing Structure -> Bullish.
Internal Structure -> Bullish.
Analysis and bias remains the same as analysis dated 16 March 2025.
In my analysis dated 27 October 2024 I mentioned (below) that price could potentially print higher-highs in order to reposition CHoCH. This is exactly how price printed. CHoCH positioning has been brought significantly closer to current price action. CHoCH positioning is denoted with a shortened blue dotted horizontal line.
The remainder of my analysis and bias remains the same as analysis dated 09 February 2025.
Price has printed a further bullish iBOS.
Price is currently trading within an internal low and fractal high. CHoCH positioning is denoted with a blue dashed line.
Price Action Analysis:
In my analysis dated 27 October 2024, it was noted that the first sign of a pullback would be a bearish Change of Character (CHoCH), indicated by a blue dotted line. Price's consistent upward momentum had repositioned previous CHoCH much closer to recent price levels as expected for weeks. Current CHoCH positioning is quite a distance away from price, therefore, it would be viable if price continued bullish to reposition ChOCH.
Note:
It is highly unlikely price will "crash" as many analysts are predicting. My view is this is merely a corrective wave of the primary trend.
Given the Federal Reserve's dovish policy stance alongside heightened geopolitical risks, market volatility is likely to remain elevated, influencing intraday price swings.
Price could also be driven by President Trump's policies, geopolitical moves and economic decisions which are sparking uncertainty and potential repricing of Gold.
Weekly Chart:
Daily Analysis:
Swing -> Bullish.
Internal -> Bullish.
Analysis and Bias remains the same as Analysis dated 11 May 2025.
Since my last weekly analysis price has finally printed a bearish CHoCH.
This is the first indication, but not confirmation of bearish pullback phase initiation.
Price is now trading within an established internal range.
Price should now technically trade down to either discount of 50% internal EQ, or Daily demand zone before targeting weak internal high, priced at 3,500.200.
Note:
The Federal Reserve’s continued dovish stance, coupled with escalating geopolitical uncertainties, is expected to sustain elevated market volatility, influencing both intraday and broader trend developments.
Additionally, price action may be further shaped by U.S. policy decisions, including measures enacted under President Trump. Shifts in geopolitical strategy and economic policymaking could introduce further uncertainty, contributing to the ongoing repricing dynamics within the gold market.
Daily Chart:
H4 Analysis:
-> Swing: Bullish.
-> Internal: Bullish.
Analysis and bias remains the same as analysis dated 23 April 2025
Price has now printed a bearish CHoCH according to my analysis yesterday.
Price is now trading within an established internal range.
Intraday Expectation:
Price to trade down to either discount of internal 50% EQ, or H4 demand zone before targeting weak internal high priced at 3,500.200.
Note:
The Federal Reserve’s sustained dovish stance, coupled with ongoing geopolitical uncertainties, is likely to prolong heightened volatility in the gold market. Given this elevated risk environment, traders should exercise caution and recalibrate risk management strategies to navigate potential price fluctuations effectively.
Additionally, gold pricing remains sensitive to broader macroeconomic developments, including policy decisions under President Trump. Shifts in geopolitical strategy and economic directives could further amplify uncertainty, contributing to market repricing dynamics.
H4 Chart:
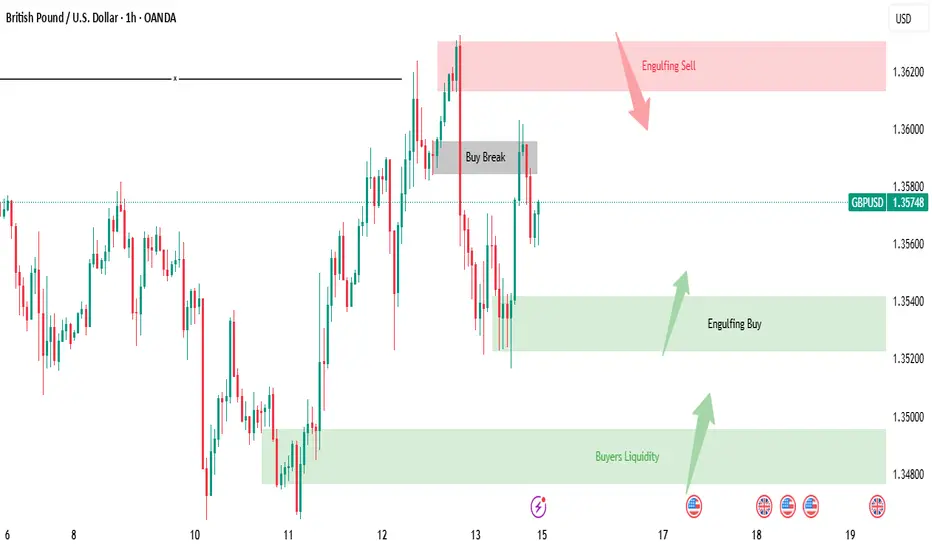
Let’s break down what's currently happening in the GBP/USD.GBP/USD Analysis in a Simple and Beginner
Let’s break down what's currently happening in the GBP/USD market, in a way that even someone without any trading experience can grasp easily.
At the moment, the market attempted to break out on the buy (upside), but it faced rejection, meaning it tried to go higher but couldn’t sustain that move and started falling down.
As the price dropped, it reached a point where a bullish engulfing pattern had previously formed this is a special pattern in trading which often signals a potential strong buying opportunity.
Now, here’s the key point:
📍 If the market comes back down to this engulfing buy zone, there's a high probability that it will bounce back up strongly from there think of it like a spring that’s been compressed and is ready to launch upward.
On the other hand:
📍 If the market doesn’t come down and instead continues moving upward, then we already have a bearish engulfing pattern waiting at a higher level. This is a zone where the market could face resistance and fall sharply again.
So what should you do?
✅ Be patient — let the market come to these important engulfing levels.
✅ Don’t rush into trades. Let the price touch these zones and then observe the reaction.
These engulfing zones are like magic they often predict powerful movements. Wait for the price to reach the level, and then watch the magic unfold.
Even if you're new to trading, this kind of analysis helps you understand when and where the market might turn without needing complicated indicators.
DYOR! Not Financial Advice.
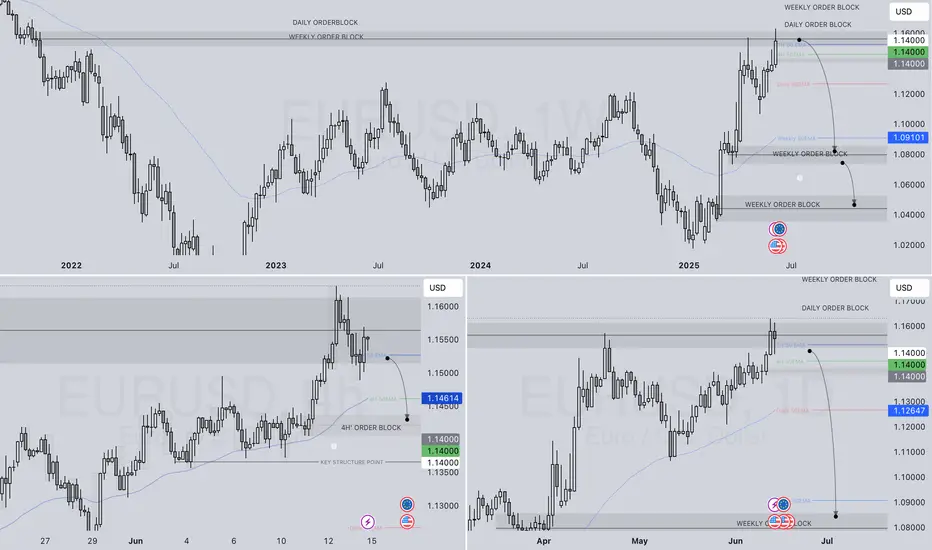
EURUSD WEEKLY HTF FORECAST Q2 W25 Y25EURUSD WEEKLY HTF FORECAST Q2 W25 Y25
Professional Risk Managers👋
Welcome back to another FRGNT chart update📈
Diving into some Forex setups using predominantly higher time frame order blocks alongside confirmation breaks of structure.
💭NOTE- If price closes above the key weekly/ daily order block with daily close- re evaluation will be required.
🔑 Remember, to participate in trading comes always with a degree of risk, therefore as professional risk managers it remains vital that we stick to our risk management plan as well as our trading strategies.
📈The rest, we leave to the balance of probabilities.
💡Fail to plan. Plan to fail.
🏆It has always been that simple.
❤️Good luck with your trading journey, I shall see you at the very top.
🎯Trade consistent, FRGNT X
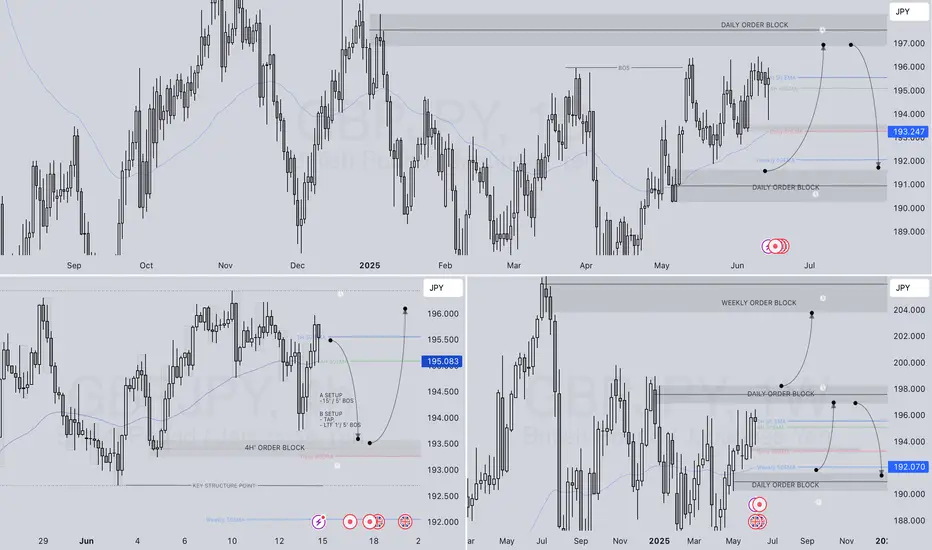
GBPJPY WEEKLY HTF FORECAST Q2 W25 Y25GBPJPY WEEKLY HTF FORECAST Q2 W25 Y25
Professional Risk Managers👋
Welcome back to another FRGNT chart update📈
Diving into some Forex setups using predominantly higher time frame order blocks alongside confirmation breaks of structure.
🔑 Remember, to participate in trading comes always with a degree of risk, therefore as professional risk managers it remains vital that we stick to our risk management plan as well as our trading strategies.
📈The rest, we leave to the balance of probabilities.
💡Fail to plan. Plan to fail.
🏆It has always been that simple.
❤️Good luck with your trading journey, I shall see you at the very top.
🎯Trade consistent, FRGNT X
Market Insights with Gary Thomson: 9 - 13 JuneMarket Insights with Gary Thomson: UK Unemployment & GDP, US Inflation & PPI, Earnings Reports
In this video, we’ll explore the key economic events, market trends, and corporate news shaping the financial landscape. Get ready for expert insights into forex, commodities, and stocks to help you navigate the week ahead. Let’s dive in!
In this episode, we discuss:
— UK Unemployment Rate
— US Inflation Rate
— UK GDP Growth Rate
— US Producer Price Index
— Corporate Earnings Statements
Don’t miss out—gain insights to stay ahead in your trading journey.
This video represents the opinion of the Companies operating under the FXOpen brand only. It is not to be construed as an offer, solicitation, or recommendation with respect to products and services provided by the Companies operating under the FXOpen brand, nor is it to be considered financial advice.

Market Insights with Gary Thomson: 2 - 6 JuneMarket Insights with Gary Thomson: BoC & ECB Rates, Canada and US Job Data & Earnings Reports
In this video, we’ll explore the key economic events, market trends, and corporate news shaping the financial landscape. Get ready for expert insights into forex, commodities, and stocks to help you navigate the week ahead. Let’s dive in!
In this episode, we discuss:
— BoC’s Interest Rate Decision
— ECB’s Interest Rate Decision
— Unemployment Rate in Canada
— NFP and Unemployment Rate in the US
— Corporate Earnings Statements
Don’t miss out—gain insights to stay ahead in your trading journey.
This video represents the opinion of the Companies operating under the FXOpen brand only. It is not to be construed as an offer, solicitation, or recommendation with respect to products and services provided by the Companies operating under the FXOpen brand, nor is it to be considered financial advice.

XAU/USD 02-06 June 2025 Intraday AnalysisWeekly Analysis:
Swing Structure -> Bullish.
Internal Structure -> Bullish.
Analysis and bias remains the same as analysis dated 16 March 2025.
In my analysis dated 27 October 2024 I mentioned (below) that price could potentially print higher-highs in order to reposition CHoCH. This is exactly how price printed. CHoCH positioning has been brought significantly closer to current price action. CHoCH positioning is denoted with a shortened blue dotted horizontal line.
The remainder of my analysis and bias remains the same as analysis dated 09 February 2025.
Price has printed a further bullish iBOS.
Price is currently trading within an internal low and fractal high. CHoCH positioning is denoted with a blue dashed line.
Price Action Analysis:
In my analysis dated 27 October 2024, it was noted that the first sign of a pullback would be a bearish Change of Character (CHoCH), indicated by a blue dotted line. Price's consistent upward momentum had repositioned previous CHoCH much closer to recent price levels as expected for weeks. Current CHoCH positioning is quite a distance away from price, therefore, it would be viable if price continued bullish to reposition ChOCH.
Note:
It is highly unlikely price will "crash" as many analysts are predicting. My view is this is merely a corrective wave of the primary trend.
Given the Federal Reserve's dovish policy stance alongside heightened geopolitical risks, market volatility is likely to remain elevated, influencing intraday price swings.
Price could also be driven by President Trump's policies, geopolitical moves and economic decisions which are sparking uncertainty and potential repricing of Gold.
Weekly Chart:
Daily Analysis:
Swing -> Bullish.
Internal -> Bullish.
Analysis and Bias remains the same as Analysis dated 11 May 2025.
Since my last weekly analysis price has finally printed a bearish CHoCH.
This is the first indication, but not confirmation of bearish pullback phase initiation.
Price is now trading within an established internal range.
Price should now technically trade down to either discount of 50% internal EQ, or Daily demand zone before targeting weak internal high, priced at 3,500.200.
Note:
The Federal Reserve’s continued dovish stance, coupled with escalating geopolitical uncertainties, is expected to sustain elevated market volatility, influencing both intraday and broader trend developments.
Additionally, price action may be further shaped by U.S. policy decisions, including measures enacted under President Trump. Shifts in geopolitical strategy and economic policymaking could introduce further uncertainty, contributing to the ongoing repricing dynamics within the gold market.
Daily Chart:
H4 Analysis:
-> Swing: Bullish.
-> Internal: Bullish.
Analysis and bias remains the same as analysis dated 23 April 2025
Price has now printed a bearish CHoCH according to my analysis yesterday.
Price is now trading within an established internal range.
Intraday Expectation:
Price to trade down to either discount of internal 50% EQ, or H4 demand zone before targeting weak internal high priced at 3,500.200.
Note:
The Federal Reserve’s sustained dovish stance, coupled with ongoing geopolitical uncertainties, is likely to prolong heightened volatility in the gold market. Given this elevated risk environment, traders should exercise caution and recalibrate risk management strategies to navigate potential price fluctuations effectively.
Additionally, gold pricing remains sensitive to broader macroeconomic developments, including policy decisions under President Trump. Shifts in geopolitical strategy and economic directives could further amplify uncertainty, contributing to market repricing dynamics.
H4 Chart: