Market Insights with Gary Thomson: April 7 - 11Market Insights with Gary Thomson: FOMC Minutes, US Inflation Rate, US PPI, Earnings Reports
In this video, we’ll explore the key economic events, market trends, and corporate news shaping the financial landscape. Get ready for expert insights into forex, commodities, and stocks to help you navigate the week ahead. Let’s dive in!
In this episode, we discuss:
- FOMC Meeting Minutes
- US Inflation Rate
- US Producer Price Index
- Corporate Earnings Statements
Don’t miss out—gain insights to stay ahead in your trading journey.
This video represents the opinion of the Companies operating under the FXOpen brand only. It is not to be construed as an offer, solicitation, or recommendation with respect to products and services provided by the Companies operating under the FXOpen brand, nor is it to be considered financial advice.
Weeklymarketsanalysis

XAU-USD 07-11 April 2025 Weekly AnalysisWeekly Analysis:
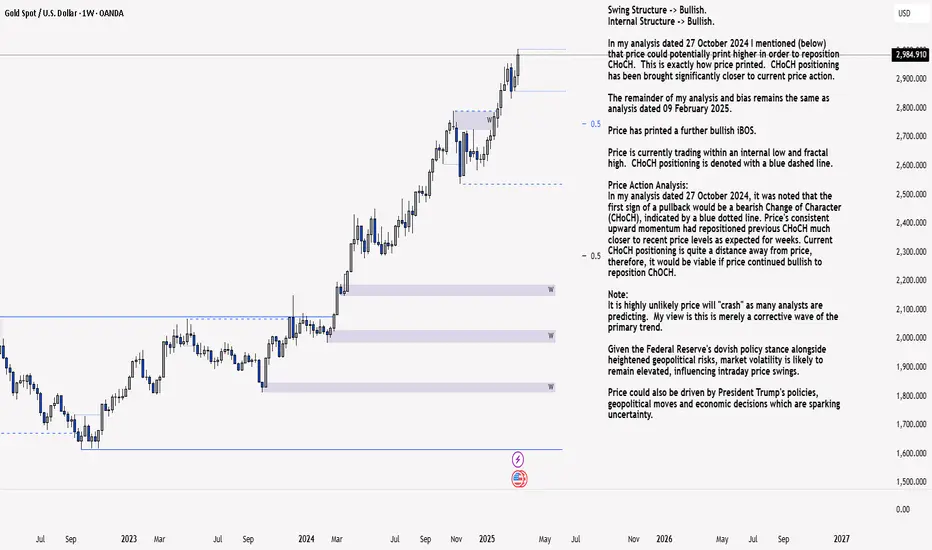
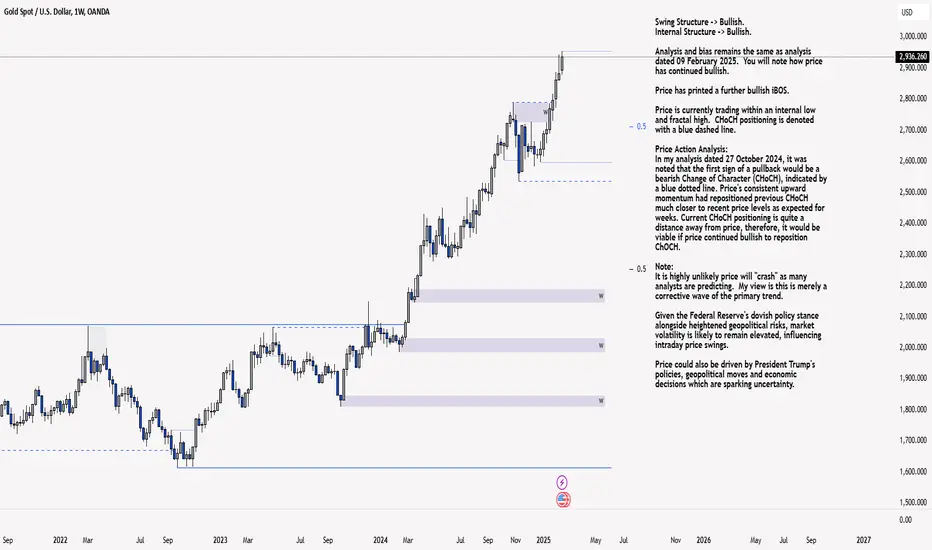
Swing Structure -> Bullish.
Internal Structure -> Bullish.
Analysis and bias remains the same as analysis dated 16 March 2025.
In my analysis dated 27 October 2024 I mentioned (below) that price could potentially print higher in order to reposition CHoCH. This is exactly how price printed. CHoCH positioning has been brought significantly closer to current price action.
The remainder of my analysis and bias remains the same as analysis dated 09 February 2025.
Price has printed a further bullish iBOS.
Price is currently trading within an internal low and fractal high. CHoCH positioning is denoted with a blue dashed line.
Price Action Analysis:
In my analysis dated 27 October 2024, it was noted that the first sign of a pullback would be a bearish Change of Character (CHoCH), indicated by a blue dotted line. Price's consistent upward momentum had repositioned previous CHoCH much closer to recent price levels as expected for weeks. Current CHoCH positioning is quite a distance away from price, therefore, it would be viable if price continued bullish to reposition ChOCH.
Note:
It is highly unlikely price will "crash" as many analysts are predicting. My view is this is merely a corrective wave of the primary trend.
Given the Federal Reserve's dovish policy stance alongside heightened geopolitical risks, market volatility is likely to remain elevated, influencing intraday price swings.
Price could also be driven by President Trump's policies, geopolitical moves and economic decisions which are sparking uncertainty.
Weekly Chart:
Daily Analysis:
Swing -> Bullish.
Internal -> Bullish.
Price continued bullish repositioning bearish CHoCH positioning closer to current price action.
Price is now trading within an internal low and fractal high.
Price has very nearly printed a bearish which is the first indication, but not confirmation, of bearish pullback phase initiation.
Expectation is for price to print bearish CHoCH to indicate, bearish pullback phase initiation. CHoCH positioning is denoted with a blue dotted line.
Note:
With the Fed maintaining a dovish policy stance and the continued rise in geopolitical tensions, we should anticipate elevated market volatility, which may impact both intraday and longer-term price action.
Price could also be driven by President Trump's policies, geopolitical moves and economic decisions which are sparking uncertainty and the repricing of Gold.
Daily Chart:
H4 Analysis:
-> Swing: Bullish.
-> Internal: Bullish.
Analysis and bias remains the same as analysis dated 04 April 2025.
Since last analysis price has printed a bearish CHoCH which is the first indication, but not confirmation of bearish pullback phase initiation.
Price is now trading within an established internal range.
Intraday Expectation:
Price to trade down to either discount of internal 50% EQ, or H4 demand zone before targeting weak internal high priced at 3,187,835
Note:
With the Federal Reserve's dovish stance and persisting geopolitical uncertainties, heightened volatility in Gold is expected to continue. Traders should proceed with caution and adjust risk management strategies in this high-volatility environment.
Price could also be driven by President Trump's policies, geopolitical moves and economic decisions which are sparking uncertainty.
H4 Chart:

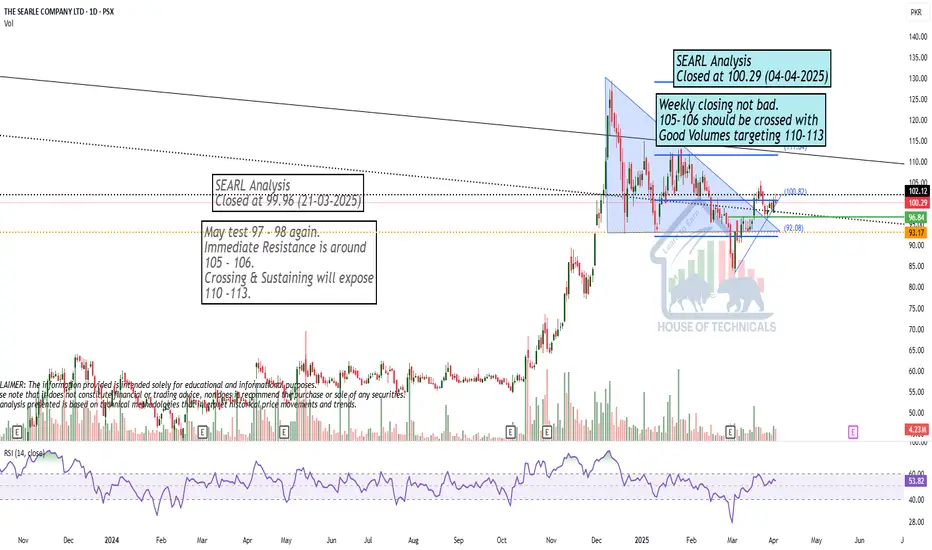
Weekly Closing not bad!Weekly closing not bad.
105-106 should be crossed with
Good Volumes targeting 110-113
Market Insights with Gary Thomson: 31 March - 4 AprilMarket Insights with Gary Thomson: RBA Rates, US and Canada’s Employment Data & Earnings Reports
In this video, we’ll explore the key economic events, market trends, and corporate news shaping the financial landscape. Get ready for expert insights into forex, commodities, and stocks to help you navigate the week ahead. Let’s dive in!
In this episode, we discuss:
- RBA Interest Rate Decision
- US Nonfarm Payrolls and Unemployment Rate
- Unemployment Rate in Canada
- Corporate Earnings Statements
Don’t miss out—gain insights to stay ahead in your trading journey.
This video represents the opinion of the Companies operating under the FXOpen brand only. It is not to be construed as an offer, solicitation, or recommendation with respect to products and services provided by the Companies operating under the FXOpen brand, nor is it to be considered financial advice.

ES Futures Weekly Trade Plan & Navigating Turbulent Waters CME_MINI:ES1!
Macro Analogy
The current market landscape and macroeconomic environment can be compared to the dynamics of "sticks and carrots." The market is largely headline-driven, responding to the shifting expectations surrounding the Federal Reserve's stance, political events (such as the ongoing influence of the Trump administration), and sidelined investors who are waiting for a clearer signal on where to allocate capital.
Looking at the market action, the low on March 13th, 2025, could mark a point of sector reallocation. Specifically, the Russell 2000 index is currently leading, with the S&P 500 and Nasdaq trailing behind. This suggests a shift in investor sentiment from large-cap stocks to smaller, potentially more dynamic sectors.
In the backdrop, Federal Reserve speakers scheduled throughout the week may help clarify their position on the evolving macroeconomic situation, notably the persistent risk of stagflation. The challenge for central banks is becoming increasingly apparent: balancing rising inflation, increasing unemployment, and slowing growth while striving to meet their dual mandate of price stability and maximum employment. These pressures are intensifying the difficulty of effective policymaking.
If we liken the US administration to a ship navigating through turbulent waters, the Federal Reserve could be seen as a submarine working behind the scenes to stabilize and support the administration. Chair Jerome Powell, at the controls, is leveraging all available tools to ensure financial stability. Meanwhile, at the helm of the ship is the US President, whose decisions and actions impact the broader economic environment, either calming or exacerbating the turbulence. The new adventures of the Gulf of America have entered uncharted territory.
In this context, last week's actions, slowing the pace of Quantitative Tightening (QT)served as the "carrot," aimed at cushioning the economic pain despite worsening economic forecasts. However, the message that FED sounded was that, due to uncertainty, our forecasts are subject to change. Take them with a pinch of salt.
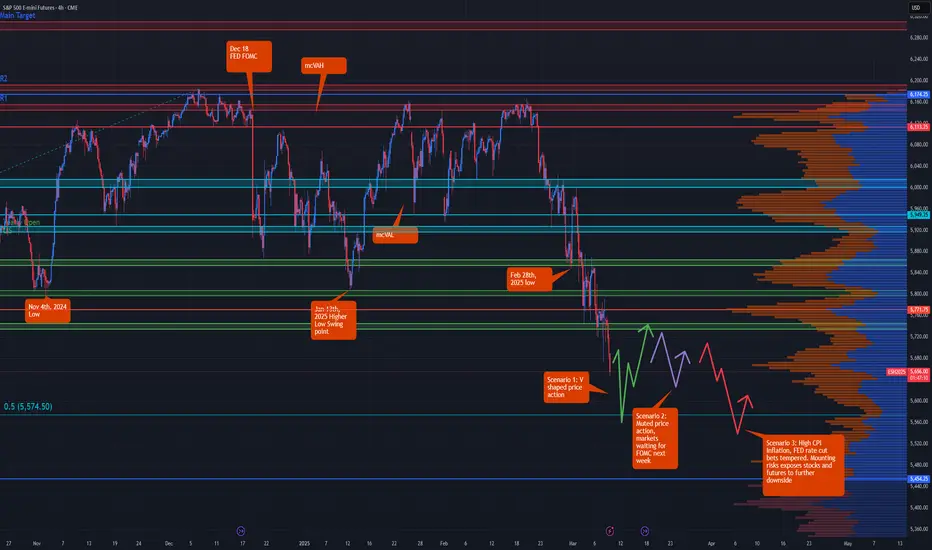
ES Futures Big Picture:
The ES futures market is currently testing key resistance levels, and this zone will serve as a critical inflection point for both bulls and bears. The next steps will likely hinge on the clarity emerging from both macro events and Fed commentary.
Key Levels to Watch:
• Yearly Open 2025: 6001.25
• Key LIS (Last Important Support/Resistance): 5850–5860
• Low Volume Node (LVN): 5770–5760
• Neutral Zone: 5705–5720
• Key Support Mid-Range 2024: 5626.50
• 2024-YTD mCVAL (Market Composite Value): 5505.25
• 2022 CVAH (Composite Value at High): 5341
Scenario 1: Rejection at Key Resistance
In this scenario, we expect rejection at the key LIS levels, with further consolidation below the 5850–5860 range before the April 2nd reciprocal tariff deadline. This could lead to a retracement back toward the LVN area (5770–5760) and a potential drop to the neutral zone around 5705–5720.
Scenario 2: Market Participants Expecting Less Severe Tariffs
Should market participants anticipate less severe reciprocal tariffs than initially planned, but remain uncertain about the broader macroeconomic picture, we could see the price push above the key LIS levels. This would likely result in a consolidation phase until more clarity emerges, with the market continuing to trade in a volatile range above key LIS.

Market Insights with Gary Thomson: 24 - 28 MarchMarket Insights with Gary Thomson: UK & US Inflation, US Durable Goods Orders, and Earnings Reports
In this video, we’ll explore the key economic events, market trends, and corporate news shaping the financial landscape. Get ready for expert insights into forex, commodities, and stocks to help you navigate the week ahead. Let’s dive in!
In this episode, we discuss:
- UK Inflation Rate
- US Durable Goods Orders
- US PCE Price Index
- Corporate Earnings Statements
Don’t miss out—gain insights to stay ahead in your trading journey.
This video represents the opinion of the Companies operating under the FXOpen brand only. It is not to be construed as an offer, solicitation, or recommendation with respect to products and services provided by the Companies operating under the FXOpen brand, nor is it to be considered financial advice.

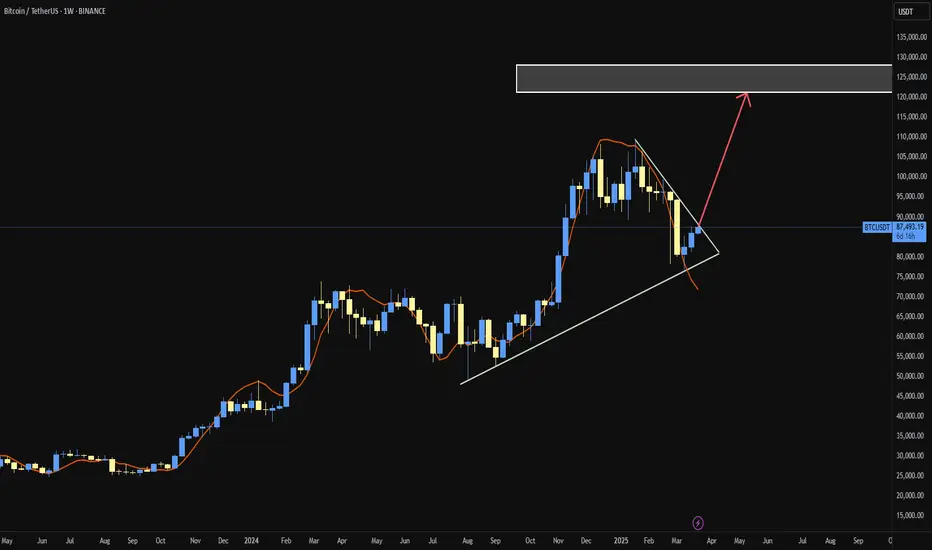
BTC/USDTas shared earlier,the market remains bullish as long as it holds above the 50 EMA and weekly Trendline.
Market Insights with Gary Thomson: 17 - 21 MarchMarket Insights with Gary Thomson: Canada’s Inflation, Fed and BoE Interest Rates, Earnings Reports
In this video, we’ll explore the key economic events, market trends, and corporate news shaping the financial landscape. Get ready for expert insights into forex, commodities, and stocks to help you navigate the week ahead. Let’s dive in!
In this episode, we discuss:
— Canada’s Inflation Rate
— Fed Interest Rate Decision
— BoE Interest Rate Decision
— Corporate Earnings Reports
Don’t miss out—gain insights to stay ahead in your trading journey.
🌐 FXOpen official website: www.fxopen.com
CFDs are complex instruments and come with a high risk of losing your money.

XAU/USD 17-21 March 2025 Weekly AnalysisWeekly Analysis:
Swing Structure -> Bullish.
Internal Structure -> Bullish.
In my analysis dated 27 October 2024 I mentioned (below) that price could potentially print higher in order to reposition CHoCH. This is exactly how price printed. CHoCH positioning has been brought significantly closer to current price action.
The remainder of my analysis and bias remains the same as analysis dated 09 February 2025.
Price has printed a further bullish iBOS.
Price is currently trading within an internal low and fractal high. CHoCH positioning is denoted with a blue dashed line.
Price Action Analysis:
In my analysis dated 27 October 2024, it was noted that the first sign of a pullback would be a bearish Change of Character (CHoCH), indicated by a blue dotted line. Price's consistent upward momentum had repositioned previous CHoCH much closer to recent price levels as expected for weeks. Current CHoCH positioning is quite a distance away from price, therefore, it would be viable if price continued bullish to reposition ChOCH.
Note:
It is highly unlikely price will "crash" as many analysts are predicting. My view is this is merely a corrective wave of the primary trend.
Given the Federal Reserve's dovish policy stance alongside heightened geopolitical risks, market volatility is likely to remain elevated, influencing intraday price swings.
Price could also be driven by President Trump's policies, geopolitical moves and economic decisions which are sparking uncertainty.
Weekly Chart:
Daily Analysis:
Swing -> Bullish.
Internal -> Bullish.
Price printed as per analysis dated 16 February 2025 by price targeting weak internal high priced at 2,956.310. However, The pullback was not substantial. Nonetheless, due to time spent I will classify this as an iBOS.
Price is now trading within an internal low and fractal high.
Expectation is for price to print bearish CHoCH to indicate, but not confirm bearish pullback phase initiation. CHoCH positioning is denoted with a blue dotted line.
Note:
With the Fed maintaining a dovish policy stance and the continued rise in geopolitical tensions, we should anticipate elevated market volatility, which may impact both intraday and longer-term price action.
Price could also be driven by President Trump's policies, geopolitical moves and economic decisions which are sparking uncertainty and the repricing of Gold.
Daily Chart:
H4 Analysis:
-> Swing: Bullish.
-> Internal: Bullish.
Previous analysis and bias was not met as price did not target weak internal low.
Price has printed a bullish iBOS followed by a bearish CHoCH.
Price is currently trading within an established internal range.
Intraday Expectation:
Price to either trade down to discount of 50% internal EQ, or Daily/H4 demand zone before targeting weak internal high priced at
Note:
With the Federal Reserve's dovish stance and persisting geopolitical uncertainties, heightened volatility in Gold is expected to continue. Traders should proceed with caution and adjust risk management strategies in this high-volatility environment.
Price could also be driven by President Trump's policies, geopolitical moves and economic decisions which are sparking uncertainty.
H4 Chart:
Putting the current pullback from ATHs into context ES FuturesCME_MINI:ES1!
Big Picture:
ATH on December 6th, 2024: 6,184.50
There has been no significant correction or pullback since the ATH.
Currently, the market has pulled back ~8.20% from the ATH.
The previous correction (over a 10% pullback, but less than a 20% downturn) occurred after ES futures hit an all-time high of 5,856 on July 15th, 2024. The market bottomed out on August 5th, 2024.
Currently, ES futures are trading below the 50% retracement level from the ATH on December 6th, 2024, and the swing low on August 5th, 2024, at 5,719.25.
Given the current "risk-off" sentiment, let's review the updated price map for ES Futures.
Key Levels:
Important level to reclaim if no correction: 5,795.25 - 5,800
Key LVN (Low Volume Node): 5,738 - 5,696
Mid 2024 range: 5,574.50
Key Support: 5,567.25 - 5,528.75
2024 YTD mCVAL (Market Composite Value Area Low): 5,449.25
2022 CVAH (Composite Value Area High): 5,280
Key Support: 5,567.25 - 5,528.75
This zone is important in the event of a 10% pullback, which could lead to a bounce thereafter.
On our regular 4-hour time frame, which we use for weekly analysis and preparation, higher lows have been breached, and ES futures are now trading below the lows from November 4th, 2024, January 13th, 2025, and February 28th, 2025.
The probable next downside target is the 50% retracement of the 2024 range, which stands at 5,574.50.
Unless we see a sustained bounce that reclaims the 5,795.25 - 5,800 zone, the key support level at 5,567.25 - 5,528.75 is likely to be tested, aligning with our expected 10% pullback.
Note that a bear market (i.e., a pullback greater than 20%) wouldn't begin until prices drop to around 4,900, which is still about 750 points away from the current price level of 5,650.
Considering all the above, what can we expect this week?
CPI and PPI data are due this week, and the market is currently in "risk-off" mode. This sentiment is exacerbated by Federal Reserve Chairman Powell's comments on needing more data before altering rate path, combined with tariffs complicating the US economy.
What price level might prompt policymakers to adjust their stance?
The Fed’s dual mandate considers both 2% inflation and low unemployment. With the unemployment rate edging above 4% and inflation remaining high, this upcoming inflation reading is critical. We believe this report may trigger volatility not seen in recent months with CPI releases. We have the SEP and FOMC rate decision coming up on March 19th, 2024.
Scenario 1: Soft CPI than expectations
Expecting volatile price action, however, a V-shaped recovery given softer CPI reading. Markets go in wait and see
Scenario 2: Range bound week
In this scenario, we expect a range bound week, with inflation print in line and markets in wait and see mode for FED FOMC announcement.
Scenario 3: High CPI print
With a higher CPI print, FED will be in a difficult position to cut rates. Will this bad news be bad for the market or good? Mounting risks point to further downside if we do not get any pivot on macro level to support the economy.
Market Insights with Gary Thomson: 10 - 14 MarchMarket Insights with Gary Thomson: US Inflation Rate and Producer Price Index, BoC Interest Rate
In this video, we’ll explore the key economic events, market trends, and corporate news shaping the financial landscape. Get ready for expert insights into forex, commodities, and stocks to help you navigate the week ahead. Let’s dive in!
In this episode, we discuss:
— US Inflation Rate
— BoC Interest Rate Decision
— US Producer Price Index
Don’t miss out—gain insights to stay ahead in your trading journey.
🌐 FXOpen official website: fxopen.com/
CFDs are complex instruments and come with a high risk of losing your money.

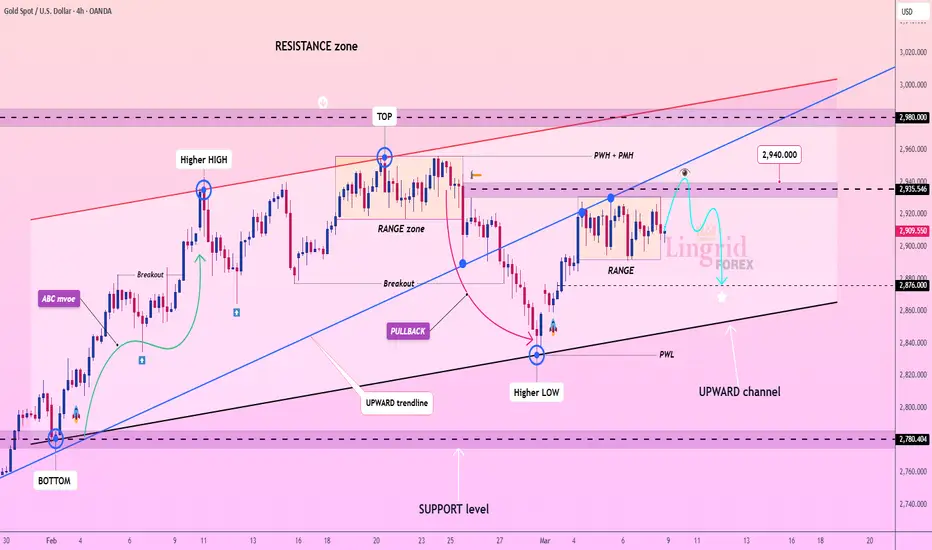
Lingrid | GOLD Weekly Market OUTLOOK: Sideways MOVE After 2900 This trading week the OANDA:XAUUSD market went through a three-day sideways movement following two trending days. After breaking through the 2900 level, the price is now stuck in the range zone. Notably, the price failed to reach last week's high or low, forming an inside bar pattern on the weekly timeframe. This suggests that a false breakout of last week's highs or lows could determine the next move in the market in the near term.
Interestingly, gold struggled to rally further upward despite the sharp drop in TVC:DXY amid escalating trade tensions. This may indicate that prices may continue to move sideways between 2940 and 2870. Zooming out, we can expect that price action appears to be forming a triangle pattern, which is a typical consolidation pattern. I think there is a possibility that the market could form a second corrective leg down or retest the weekly opening levels. Some oscillators are showing a hidden bearish divergence, which supports the idea of another corrective leg down. Overall, I expect the market to continue to fluctuate until price breaks above or below last week's high or low.
Traders, if you liked this idea or if you have your own opinion about it, write in the comments. I will be glad 👩💻
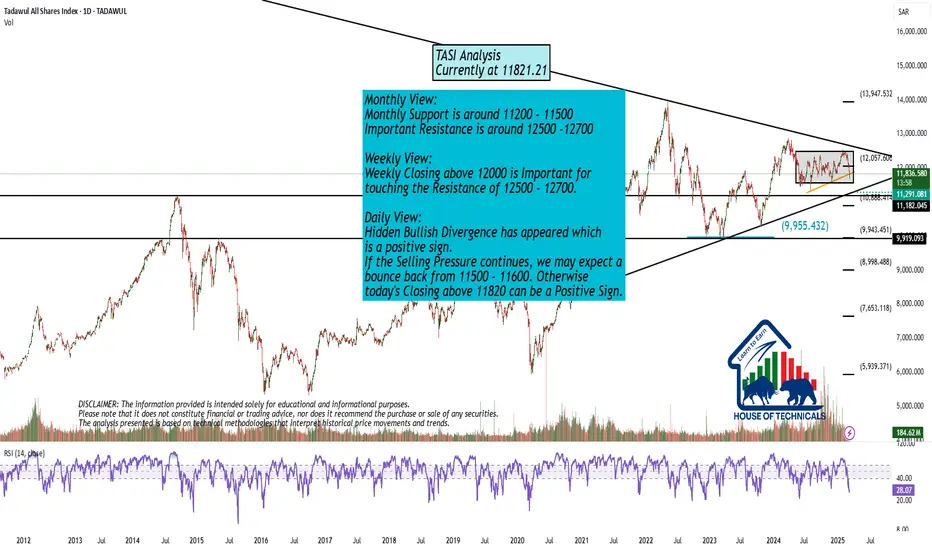
Different Time FramesMonthly View:
Monthly Support is around 11200 - 11500
Important Resistance is around 12500 -12700
Weekly View:
Weekly Closing above 12000 is Important for
touching the Resistance of 12500 - 12700.
Daily View:
Hidden Bullish Divergence has appeared which
is a positive sign.
If the Selling Pressure continues, we may expect a
bounce back from 11500 - 11600. Otherwise
today's Closing above 11820 can be a Positive Sign.
GBPUSD Weekly FOREX Forecast: March 10 - 14th In this video, we will analyze EURUSD and EUR Futures. We'll determine the bias for the upcoming week, and look for the best potential setups.
The GBP has been a bit stronger than its counterparts, and has shown bullish intent in recent days. Friday's candle was very strong, and price is likely to see higher prices over the next week.
A correction to Friday's candle is likely, followed by longer term bullishness.
Enjoy!
May profits be upon you.
Leave any questions or comments in the comment section.
I appreciate any feedback from my viewers!
Like and/or subscribe if you want more accurate analysis.
Thank you so much!
Disclaimer:
I do not provide personal investment advice and I am not a qualified licensed investment advisor.
All information found here, including any ideas, opinions, views, predictions, forecasts, commentaries, suggestions, expressed or implied herein, are for informational, entertainment or educational purposes only and should not be construed as personal investment advice. While the information provided is believed to be accurate, it may include errors or inaccuracies.
I will not and cannot be held liable for any actions you take as a result of anything you read here.
Conduct your own due diligence, or consult a licensed financial advisor or broker before making any and all investment decisions. Any investments, trades, speculations, or decisions made on the basis of any information found on this channel, expressed or implied herein, are committed at your own risk, financial or otherwise.

EURUSD Weekly FOREX Forecast: March 10 - 14thIn this video, we will analyze EURUSD and EUR Futures. We'll determine the bias for the upcoming week, and look for the best potential setups.
While the USD is bearish, the EUR is finding strength to the upside. This is noted in the very strong Friday candle. Meh NFP numbers, tariffs and trade wars are pulling the USD down, allowing the EUR and the other majors to move higher.
Look for a retracement to the +FVG in the beginning of the week. This could potentially set up the higher probability buy setup that potentially forms there.
Enjoy!
May profits be upon you.
Leave any questions or comments in the comment section.
I appreciate any feedback from my viewers!
Like and/or subscribe if you want more accurate analysis.
Thank you so much!
Disclaimer:
I do not provide personal investment advice and I am not a qualified licensed investment advisor.
All information found here, including any ideas, opinions, views, predictions, forecasts, commentaries, suggestions, expressed or implied herein, are for informational, entertainment or educational purposes only and should not be construed as personal investment advice. While the information provided is believed to be accurate, it may include errors or inaccuracies.
I will not and cannot be held liable for any actions you take as a result of anything you read here.
Conduct your own due diligence, or consult a licensed financial advisor or broker before making any and all investment decisions. Any investments, trades, speculations, or decisions made on the basis of any information found on this channel, expressed or implied herein, are committed at your own risk, financial or otherwise.

USD | USD INDEX Weekly FOREX Forecast: March 10 - 14thIn this video, we will analyze the USD through the USD INDEX (DXY). We'll determine the bias for the upcoming week, and look for the best setups to take.
The USD is bearish, and there is plenty of economic news coming up this week. Should be plenty of opportunities from Tues through Friday.
Short term bullishness, in the form of a pullback, is potentially there. But longer term bearishness is likely to continue.
Enjoy!
May profits be upon you.
Leave any questions or comments in the comment section.
I appreciate any feedback from my viewers!
Like and/or subscribe if you want more accurate analysis.
Thank you so much!
Disclaimer:
I do not provide personal investment advice and I am not a qualified licensed investment advisor.
All information found here, including any ideas, opinions, views, predictions, forecasts, commentaries, suggestions, expressed or implied herein, are for informational, entertainment or educational purposes only and should not be construed as personal investment advice. While the information provided is believed to be accurate, it may include errors or inaccuracies.
I will not and cannot be held liable for any actions you take as a result of anything you read here.
Conduct your own due diligence, or consult a licensed financial advisor or broker before making any and all investment decisions. Any investments, trades, speculations, or decisions made on the basis of any information found on this channel, expressed or implied herein, are committed at your own risk, financial or otherwise.

Recap: Short below LIS/Yearly Open Crude OilNYMEX:CL1!
Another day and EdgeClear brings you another recap where one of the highlighted scenarios in our weekly plan for WTI crude oil, published on February 24, 2025 , played out as expected.
Our Scenario 3 looked at price discovery extending the 2025 range into Q4 2024 lower distribution. Our analysis indicated an initial move lower bouncing from CVPOC 2022 support. The key was price moving below key LIS/yearly open. We did not see a bearish head and shoulders pattern develop, however, the rest of the plan played out as expected.
Note the price action till Friday, 28th Feb 2025.
We have been consistently providing traders with a roadmap for WTI crude oil with our thoughts and opinions on the market. WTI crude oil is a fundamental product that is affected by several factors, such as: macro, geopolitical, economic, supply, demand, and oil production dynamics.
Our analysis considers these developments along with auction market theory and key indicators that may be important to watch at times. As an example, for our January 13, 2025, blog , we noted increased volume with increased open interest that drove bullish sentiment in crude oil prices. We also highlighted potential short opportunities that played out per our plan.
For last week’s blog, we noted the overall trend in volume and open interest falling, indicating a potential move lower. This combined with multiple tests of our key LIS/ yearly open, strengthened our thesis for further price discovery lower.
In our blog, we have highlighted two key ranges:
$70 - $75 - Q1 2025 Value Area
$65 - $70 - Q4 2024 Lower Distribution
Focus is shifting towards oil market fundamentals i.e., supply, demand, and production outlook.
While headline news may drive short-term and intraday volatility, investors and market participant’s focus will shift towards oil market fundamentals. On March 3rd, 2025, OPEC+ reaffirmed its decision from December 5, 2024, to proceed with gradual and flexible return of 2.2 mbpd voluntary cuts, starting April 1, 2025. It provided a detailed table along with a cautious approach should this decision require any amendments. In our analysis, while trade war and tariff tantrum create uncertainty around demand outlook, any news providing clarity on tariffs will be considered net positive.

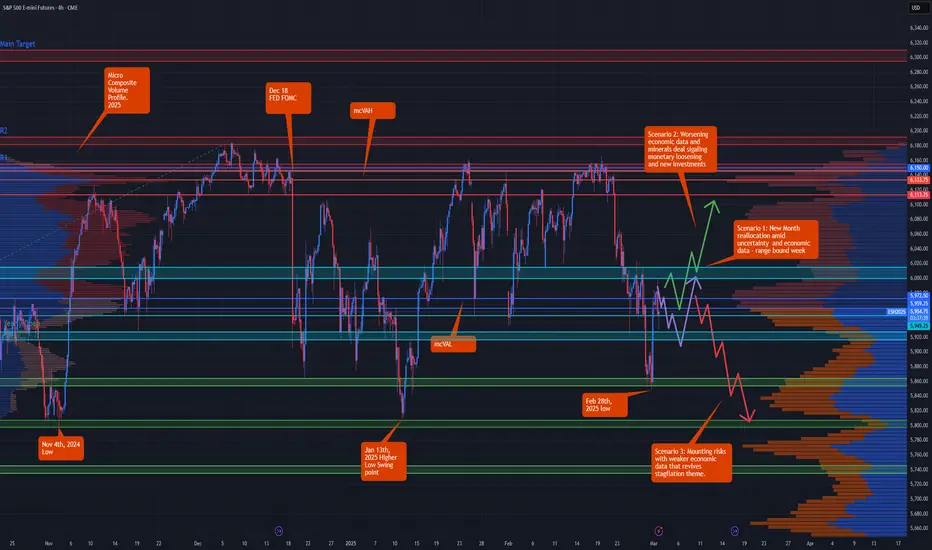
ES Futures & Macro Trends: Key Levels and Market ScenariosCME_MINI:ES1!
Macro and Geopolitics:
There was continued news flow over the weekend after derailed talks between Trump and Zelensky. Europe, UK and Saudi Arabia are still pushing for a Russia-US-Ukraine peace deal that will likely include rare earth minerals.
We also heard Trump commenting on an executive order on digital assets strategic reserves helping reverse losses in CME BTC futures. Investors see this as a positive development prior to the upcoming Crypto Summit in Washington on March 7th.
US March 4th tariff deadlines loom for Canada, Mexico, and China. Trump repeated America's first stance commenting that border security and stopping illegal drug trades should be America’s prime focus.
Economic Calendar:
Looking ahead this week, key economic events include manufacturing PMI data on Monday, employment and services data midweek, and major central bank decisions and labor market reports toward the end of the week. Here’s a breakdown of important releases:
Monday:
Manufacturing PMI data release
Wednesday:
ADP Nonfarm Employment Change
Services PMI
Crude Oil Inventories
Thursday:
European Central Bank (ECB): Interest rate decision & monetary policy statement
U.S. Data:
Weekly Initial Jobless Claims
Continuing Jobless Claims
U.S. Trade Balance
January 2025 Imports & Exports data
Friday:
U.S. Employment Data:
Nonfarm Payrolls (NFP) report
Average Hourly Earnings
Unemployment Rate
Federal Reserve Speakers:
Bowman & Powell scheduled to speak
ES Big Picture:
Despite increased volatility and risks mounting, looking at the daily chart shows that ES futures are still within range and trading above Nov 4th, 2024 and January 13th, 2025 low, however, 2025 mcVAH and R1 confluence has been acting as strong resistance and keeping the markets from reaching new all-time highs.
Despite the risks, our analysis suggests that with the U.S. economy showing resilience, a "buy the dip" approach remains favorable. However, staying selective and strategic with opportunities is key to balancing risk and reward.
Key Levels:
Key levels represent areas of interest and zones of active market participation. The more significant a key level, the closer we monitor it for potential reactions and trade setups in alignment with our trading plan.
2025 VAH: 6,150
2025 VPOC: 6,133.75
LVN: 6,113.25
Neutral Zone: 6,000 - 6,015
2025 VAL: 5,972.50
LIS/Yearly Open: 5,949.50
Neutral Zone: 5,916.50 - 5,927.25
Feb 2025 Low: 5,848
Jan 2025 Low: 5,809
Scenario 1: Range bound week
Market remains volatile, however, within the neutral zone below key LIS/yearly open and neutral zone above Key LIS/yearly open.
Scenario 2: Weak data points slowing economy
Worsening economic data points along with progress in Ukraine- US minerals deal points towards further buying. Weaker data points may provide room for further rate cuts should economic weakening further materialize.
Scenario 3: Mounting risks and weaker economic data
On the contrary, mounting risk and weaker economic data may point towards stagflation as inflation remains sticky while the economy weakens. This provides room for further decline in ES futures.
Market Insights with Gary Thomson: 3 - 7 MarchMarket Insights with Gary Thomson: ECB Rates, US NFP, Canada’s Unemployment Rate, Earnings Reports
In this video, we’ll explore the key economic events, market trends, and corporate news shaping the financial landscape. Get ready for expert insights into forex, commodities, and stocks to help you navigate the week ahead. Let’s dive in!
In this episode, we discuss:
- ECB Interest Rate Decision
- US Nonfarm Payrolls and Unemployment Rate
- Unemployment Rate in Canada
- Corporate Earnings Statements
Don’t miss out—gain insights to stay ahead in your trading journey.
🌐 FXOpen official website: www.fxopen.com
CFDs are complex instruments and come with a high risk of losing your money.

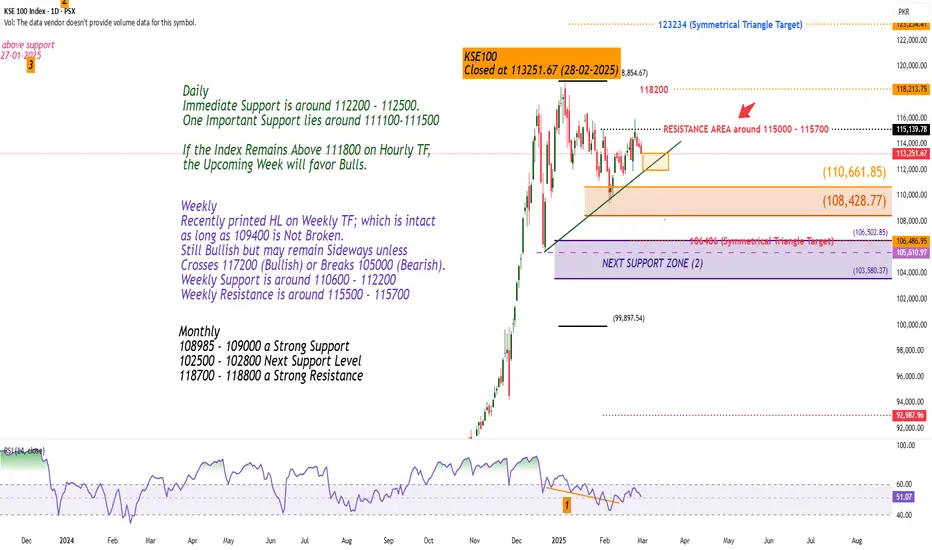
Weekly+ Monthly ViewWeekly
Recently printed HL on Weekly TF; which is intact
as long as 109400 is Not Broken.
Still Bullish but may remain Sideways unless
Crosses 117200 (Bullish) or Breaks 105000 (Bearish).
Weekly Support is around 110600 - 112200
Weekly Resistance is around 115500 - 115700
Gold weekly levels with buy and sell entriesGold has been making new all-time highs almost daily but are the bulls showing signs of exhaustion ?
The chart below has the levels I'll be watching this week.
See my other chart linked below for a swing trade idea for this week.
On the buy side ill look to enter at entering at 2944 expecting to hold until 2974 area, of course take profit on the way.
On the sell side ill look to enter at 2931 which nearly exactly Fibonacci 0.618 and look to hold to 2922 first and if broken then 2900 plus.
These trades are based on the higher time fram support and resistance , Fibonacci levels and trend lines .
As always when trading use proper risk management this is not a get rich quick scheme but is about making constant profit while protecting your capital.
Ill update these as the week progresses

XAU/USD 24-28 February 2025 Weekly AnalysisWeekly Analysis:
Swing Structure -> Bullish.
Internal Structure -> Bullish.
Analysis and bias remains the same as analysis dated 09 February 2025. You will note how price has continued bullish.
Price has printed a further bullish iBOS.
Price is currently trading within an internal low and fractal high. CHoCH positioning is denoted with a blue dashed line.
Price Action Analysis:
In my analysis dated 27 October 2024, it was noted that the first sign of a pullback would be a bearish Change of Character (CHoCH), indicated by a blue dotted line. Price's consistent upward momentum had repositioned previous CHoCH much closer to recent price levels as expected for weeks. Current CHoCH positioning is quite a distance away from price, therefore, it would be viable if price continued bullish to reposition ChOCH.
Note:
It is highly unlikely price will "crash" as many analysts are predicting. My view is this is merely a corrective wave of the primary trend.
Given the Federal Reserve's dovish policy stance alongside heightened geopolitical risks, market volatility is likely to remain elevated, influencing intraday price swings.
Price could also be driven by President Trump's policies, geopolitical moves and economic decisions which are sparking uncertainty.
Weekly Chart:
Daily Analysis:
Swing -> Bullish.
Internal -> Bullish.
Analysis and bias remains the same as last week's analysis dated 16 February 2025. You will note that CHoCH positioning has been brought closer to current price action. This allows for price to not pull back so deep to indicate bearish pullback phase initiation.
Since my last weekly analysis price has printed a bullish iBOS. Bias and analysis has been accurate over the last few months.
Price is now trading within a fractal high and internal low.
Bearish ChOCH positioning is denoted with a blue shorter dotted line and is very well positioned to print bearish CHoCH which is the very first indication, but not confirmation of bearish pullback phase initiation
Note:
With the Fed maintaining a dovish policy stance and the continued rise in geopolitical tensions, we should anticipate elevated market volatility, which may impact both intraday and longer-term price action.
Price could also be driven by President Trump's policies, geopolitical moves and economic decisions which are sparking uncertainty.
Daily Chart:
H4 Analysis:
-> Swing: Bullish.
-> Internal: Bullish.
Analysis and bias remains the same as analysis dated 21 February 2025.
Price printed as per yesterday's analysis and bias.
Price has printed a bearish CHocH indicating, but not confirming bearish pullback phase initiation.
Price is now trading within an established internal range.
Intraday Expectation:
Price to trade down to either discount of 50% internal EQ, or H4 demand zone before targeting weak internal high, priced at 2,954.955
Alternative scenario:
Given HTF (Daily and Weekly) have also printed bullish iBOS' it would not come as a surprise if price printed a bearish iBOS.
Note:
With the Federal Reserve's dovish stance and persisting geopolitical uncertainties, heightened volatility in Gold is expected to continue. Traders should proceed with caution and adjust risk management strategies in this high-volatility environment.
Price could also be driven by President Trump's policies, geopolitical moves and economic decisions which are sparking uncertainty.
H4 Chart:
Market Insights with Gary Thomson: 17 - 21 FebruaryMarket Insights with Gary Thomson: RBA Rates, UK and Canada’s Inflation, Metals, Earnings Reports
In this video, we’ll explore the key economic events, market trends, and corporate news shaping the financial landscape. Get ready for expert insights into forex, commodities, and stocks to help you navigate the week ahead. Let’s dive in!
In this episode:
- RBA Interest Rate Decision
- Canada’s Inflation Rate
- UK Inflation Rate
- Precious Metals Price Fluctuations
- Corporate Earnings Statements
Don’t miss out—gain insights to stay ahead in your trading journey.
🌐 FXOpen official website: www.fxopen.com
CFDs are complex instruments and come with a high risk of losing your money.
