How near is the END? S&P 500Look on the behavior of DMI on the previous crashes, it keeps falling while the index is falling as well and RSI builds up a bullish divergence. It does not necessarily mean that history repeats itself, just pointing this out.
Weeklymarketsanalysis

NIFTY weekly analysisNifty CMP is 8083
* If you see the weekly RSI, then it will show nearly about 15 indicates (nearly about all time low) that there is no strength is left to go further downside (Below 7500 level).
* If Nifty breaks the 7500 level then it will clearly indicates strong bear run into the market and could go around 6300 level.
* Now sudden fall in the market might not seen further as it factored previously and it may take a pause in the range of 7900-8700 levels for a long time period of 2-3 months.
* volatility in the market will reduce gradually from now and it will stabilize as clearly the chart has very small strength to go further downside and may take reversal.
* Right now nifty is standing nearly at the retracement level of 78.6% from 2016 to 2020 bull run. Already broken the so called golden ratio of 61.8%
* Nifty might go under a long sideways zone of 8500-11000 level for the next 2-3 years
* whatever the situation occurs like invention of coronavirus vaccine, then also i am not seeing the further bull run from now onward to 12500 level for the period of 1-2 years.

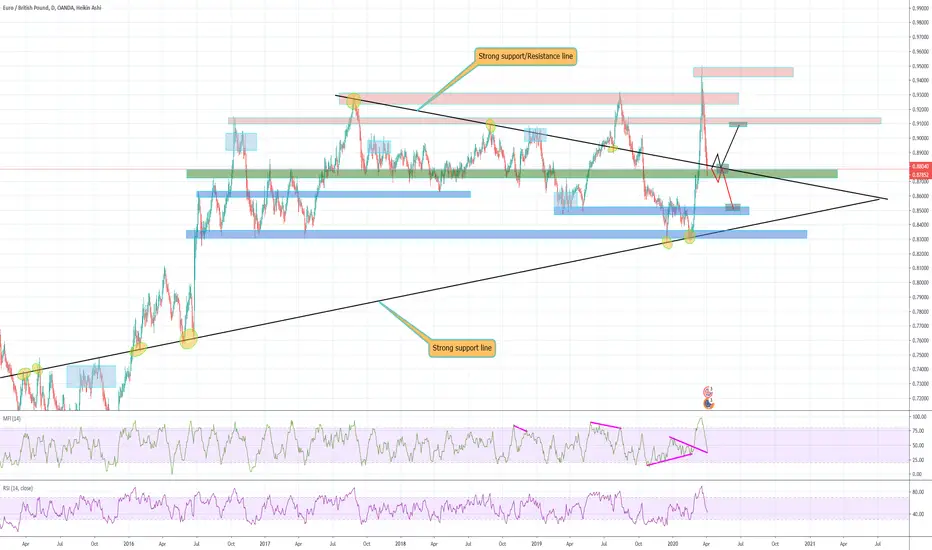
Eurgbp bullish & Bearsih scenariosPrice is currently below a strong support line. if price closes above the line I am expecting a bullish response and if it closes below im expecting a bearish move.
There is slight bearish divergence present.
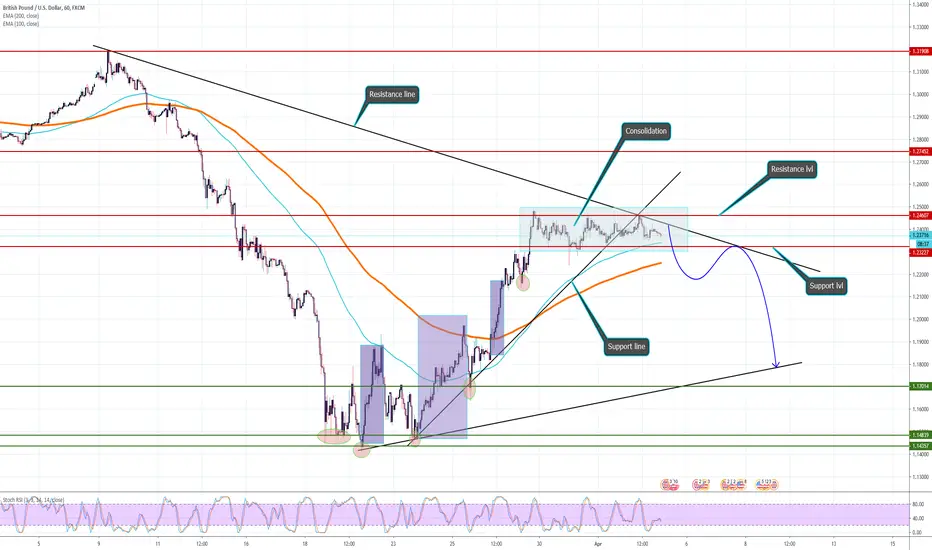
GBPUSD SHORT SET UPGbpUsd has made a strong push up and is in a phase of consolidation. I strongly fell the market will reverse from here...
and anyways I don't think the situation in Britain in regards to this Covid-19 is getting any better so it might be a good idea to hold long term gbp sells
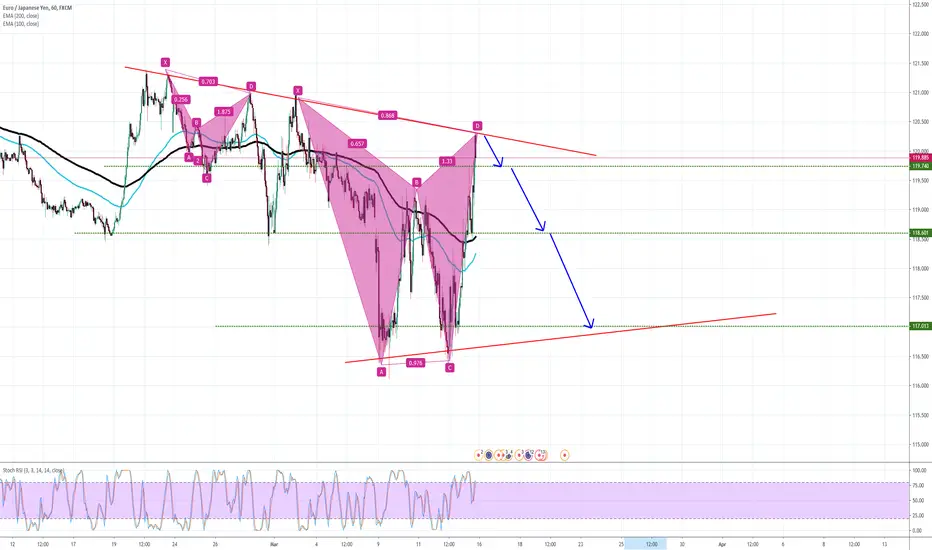
GBPJPY 1h timeframe analysis GbpJpy has made a strong push up but has lost its bullish momentum and has reached a strong resistance zone + the 50% fib retracement level.
Im expecting a push down to the recent low and possibly a down trend continuation. Trail profits.

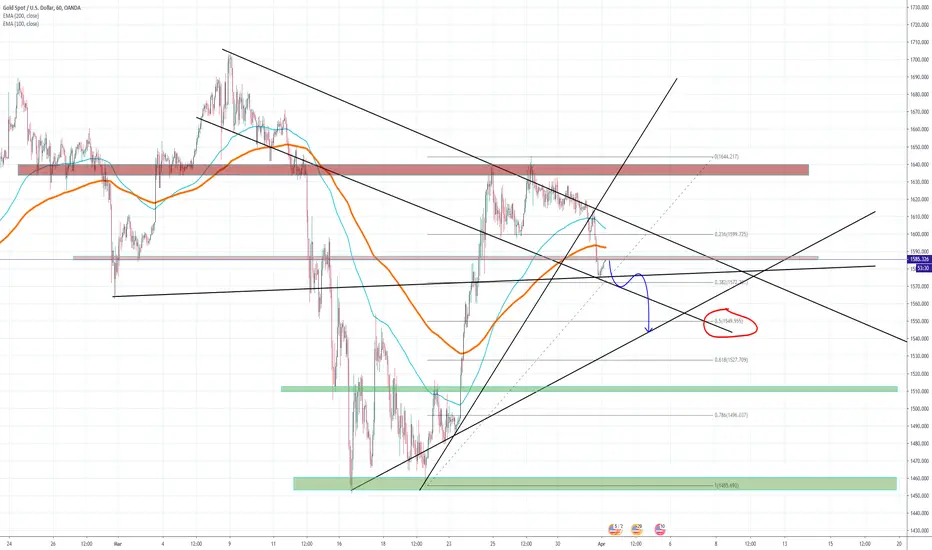
XAUUSD continued push down?Xauusd has made a sharp move down...can we see a continued down trend after a retracement? let me know what u think, share your analysis in the comments
EURGBP short set upEURGBP nice rejection on weekly/monthly resistance
eurgbp seems to have lost its bullish momentum and im looking to sell now.....it should fall to the near support levels in my opinion.

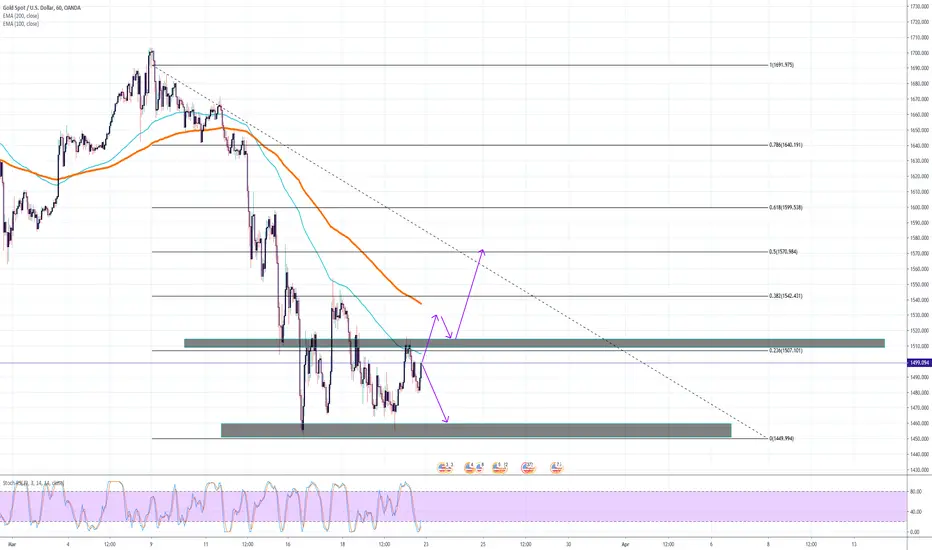
XAUUSD (GOLD) 1h timeframe analysisGold 1h timeframe analysis
The range and Important levels to look out for have been identified. watch out for gap
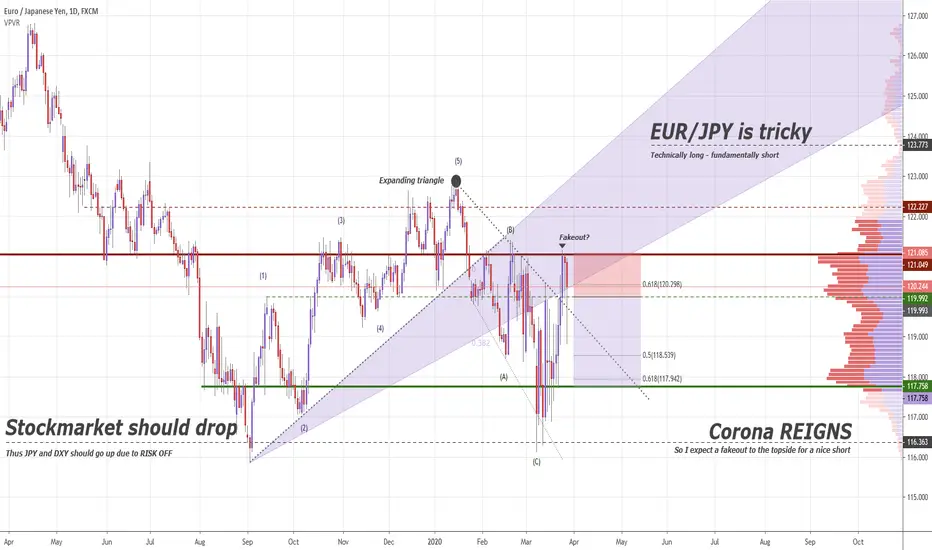
EUR/JPY SELL SIGNALHey tradomaniacs,
welcome to another free trade-plan.
Important: This is meant to be a preparation for you. As always we will have to wait for a breakout and confirmation.
Market Sell: 120,000
Stop-loss: 121,085
Target 1: 119,250
Target 2: 118,600
Target 3: 117,760
LEAVE A LIKE AND A COMMENT - I appreciate every support! =)
Peace and good trades
Irasor
Wanna see more? Don`t forget to follow me.
Any questions? PM me. :-)
GbpJpy 1h tf analysisGbpjpy has made a strong push up and im expecting a retracement/push down to the recent support....please not it might not reach the target zone so it is important to follow proper risk management and trailing profits.

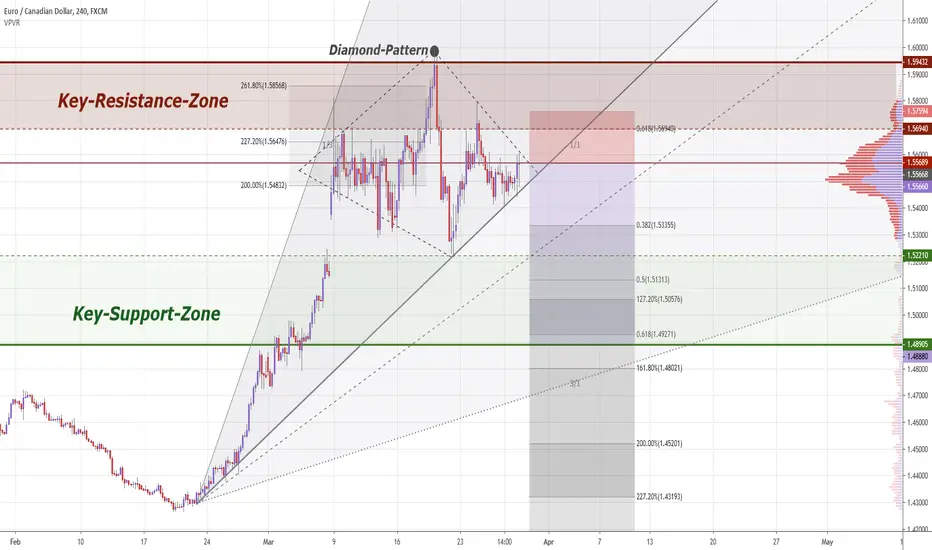
EUR/CAD SELL SIGNALHey tradomaniacs,
welcome to another free trade-plan.
Important: This is meant to be a preparation for you. As always we will have to wait for a breakout and confirmation of this Diamond-Pattern.
Market Sell: 1,55680
Stop-loss: 1,57600
Target 1: 1,52220
Target 2: 1,51000
Target 3: 1,48900
LEAVE A LIKE AND A COMMENT - I appreciate every support! =)
Peace and good trades
Irasor
Wanna see more? Don`t forget to follow me.
Any questions? PM me. :-)

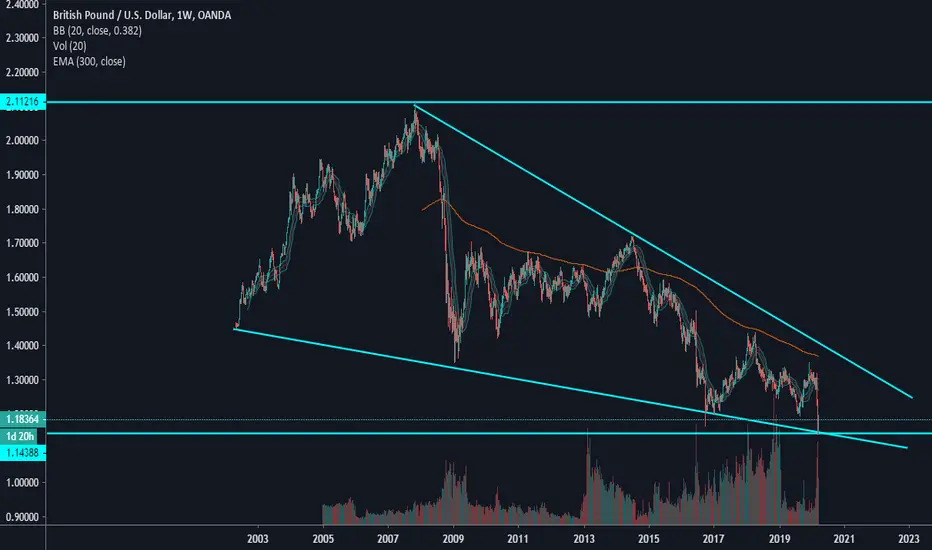
GBPUSD Buy zoneStill thinking the same about GBPUSD. Price is bouncing off WEEKLY all time lows. I wont say it's a reversal, but it's sure going to need to bounce higher for a few weeks. Even if it breaks the low, it should't go too far. With all this global drama going on, it would have fallen by now.
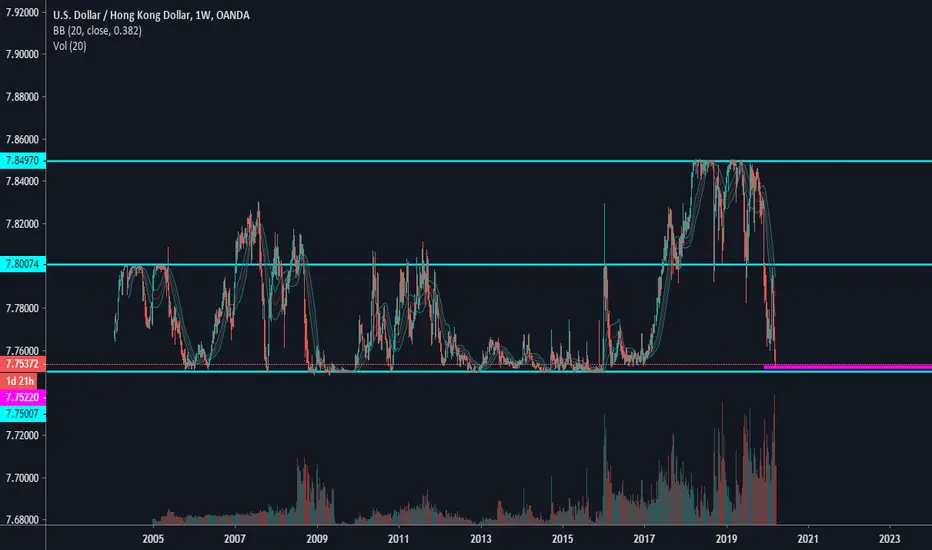
USDHKD. buy. just...buy...weekly demand level just sitting there waiting to be bought. look at the volume! take profits at the midline or top...
#AUDUSD Weekly Trading Analysis & Forecast (Educational)Traders, In this video we reset our analysis and start afresh. AUDUSD is showing us some very good moves. Also watch it till the end, I have included few important free educational tips as well. Support and motivate me by hitting the like button, subscribing to my channel and sharing this analysis with other traders.
Comment below and let me know what you think of this analysis and what is yours? I welcome all comments, feedback, ideas and sharing of knowledge.
Have a great trading week!

#BTC - Double bottom at $3000 on weekly chart#BTC - Double bottom at $3000 on weekly chart - why not? If we break through the most important support level today - I would wait bitcoin at $3000 - $3300.
But now worries, we have a gap at $8000 ;)

EURJPY SHORT SET UPEURJPY made a strong push upwards and is at a strong resistance level.
I am expecting a fall to tp 1 and tp 2 ….tp 3 is open trail profits from there.
Weekly US Market Update / 9-15 March 2020After suffering sharp coronavirus-related losses earlier in the week, U.S. stocks soared on Friday and got an extra lift late in the session from President Trump's declaration of a national emergency. On Thursday, U.S. stock indexes suffered their biggest one-day drop since 1987’s Black Monday crash, and closed deep in bear market territory. Friday's big gains couldn't reverse all the damage from previous sessions. For the week, the S&P 500 was down 8.8%, the Nasdaq Composite was 8.2% lower, and the Dow Jones Industrial Average fell 10.4%.
President Donald Trump has declared a national emergency under the Stafford Act, a move that will free up greater federal resources for states and cities battling the coronavirus.
The World Health Organization on Wednesday declared the Covid-19 coronavirus outbreak a pandemic. The virus had infected more than 120,000 people and spread to more than 100 countries at the time of the announcement.
Oil futures plunged to a four-year low Monday and recorded their biggest one-day drop since 1991 as OPEC and Russia appear headed for an all-out price war—shaking a market already reeling from the demand shock created by global spread of Covid-19.
Whats next? Maybe we will see a short uptrend move towards 0,3882 Fibonacci Level. There is also a resistance trend line there. If the indeces fall below 7255.62 (Nasdaq 100), more downside move will appear.

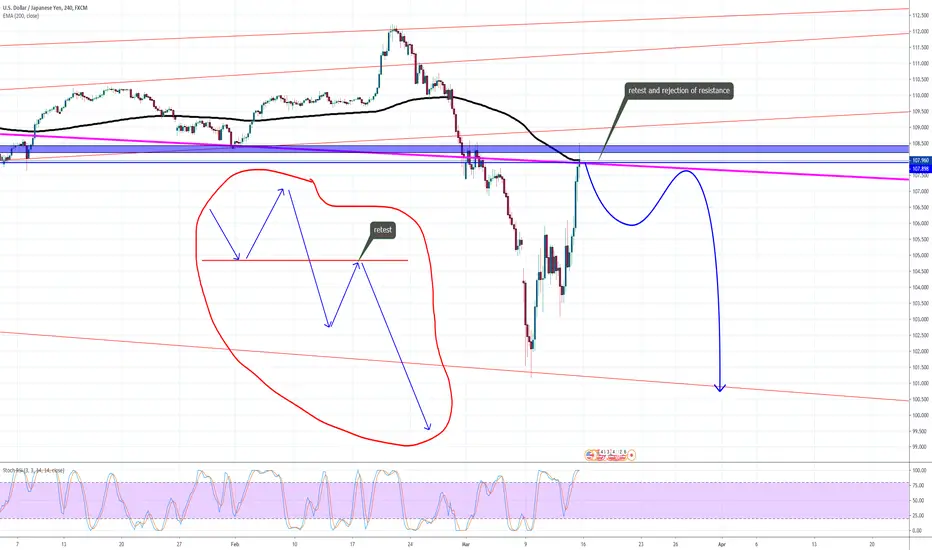
USDJPY SHORT SET UPUSDJPY has broken structural support and has come back to retest this zone as resistance. if price closes below this retest line I can be sure it will drop back down.
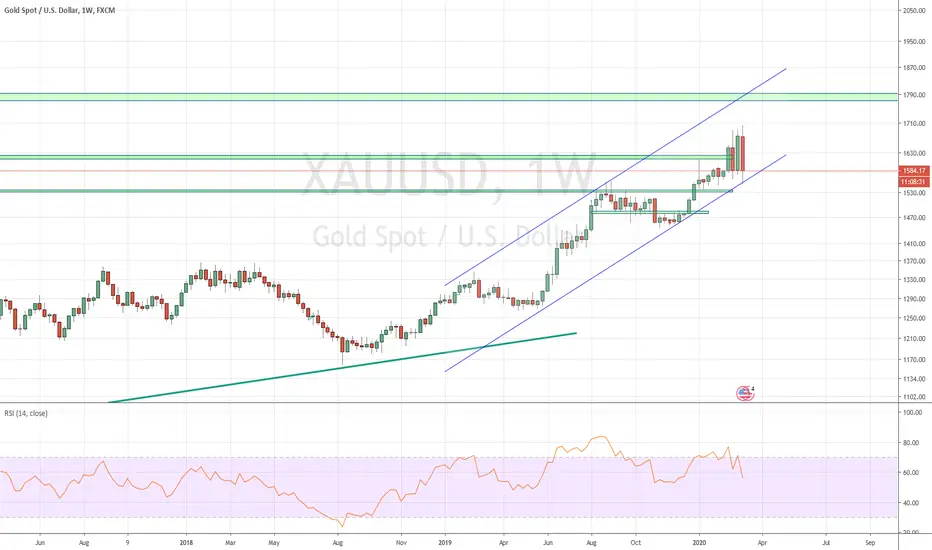
Gold finds strong weekly supportThe weekly chart her shows gold's fast uptrend channel set the parameters for its latest major correction (broader market crash).
The thick green line is the baseline for gold's multi-year bull market and more recent sideways market.
The horizontal green lines are multi-year support/resistance zones and we can see that the all-time high and various other peaks are in sight.
On the daily chart gold has bounced strongly off the channel bottom within the bottom support zone in preparation for a likely run at the high 1700s zone.

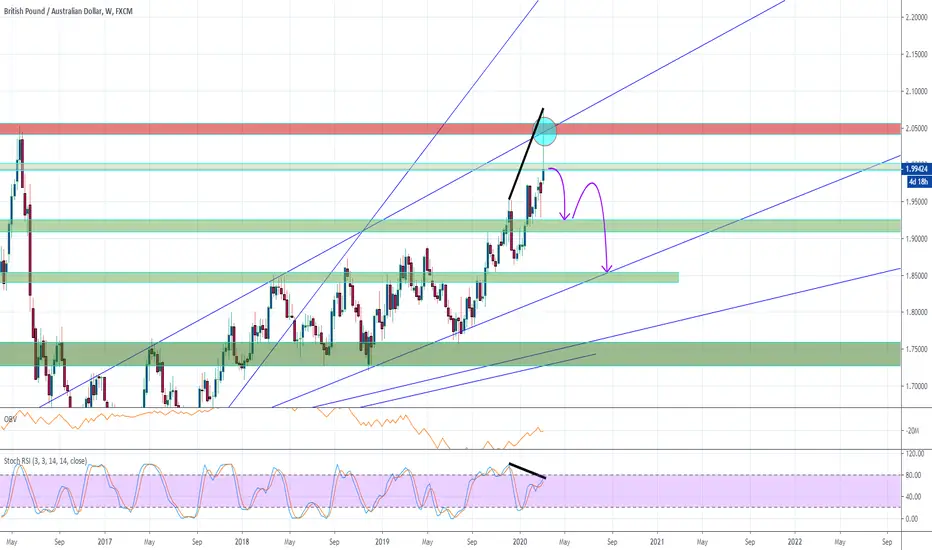
GBPAUD SHORTTERM SELL SET UPgbpaud has risen very high but clearly rejected resistance (the rise also due to news) now there should be a push down as there is also big bearish divergence.
USDCAD WEEKLY UPThe reasons:
1. STRONG WEEKLY Pinbar;
2. STRONG Support zone;
3. Price broken and closed above STRONG Trend line;
Entry point: 1.3370;
SL: 1.3320;
TP: 1.3520 or next Resistance 1.3650;
RR - 1:3;
What do you think?
