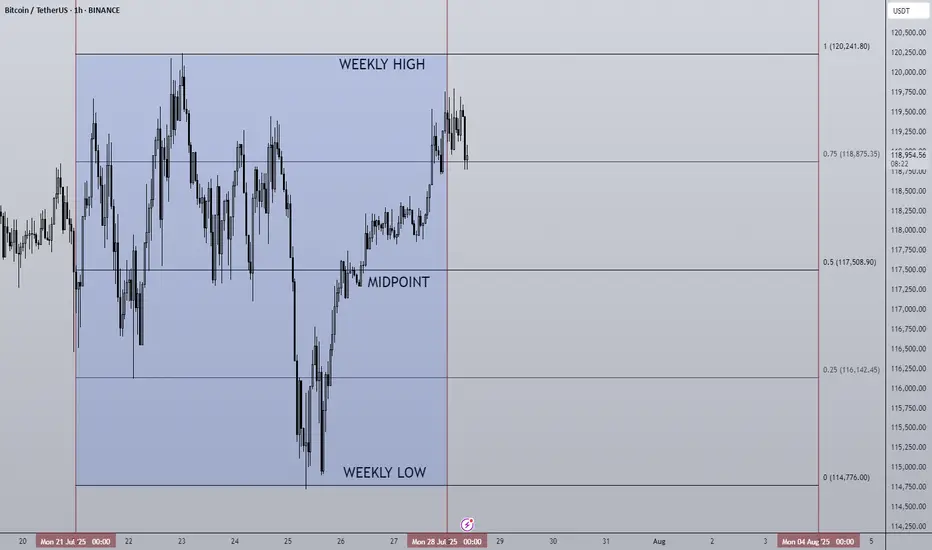
28/07/25 Weekly OutlookLast weeks high: $120,241.80
Last weeks low: $114,776.00
Midpoint: $117,508.90
As we approach the end of the month BTC continues to trade sideways during a cooling off period as altcoins finally take the stage. Last week Bitcoin saw a relatively flat net inflow via ETFs of $72m, ETH on the other hand posted the second largest net inflow week ever at $1.85B! The concentration has certainly shifted...
This IMO is still a very bullish structure for BTC, very shallow pullbacks being bought up/absorbed by still happy to purchase at these levels. As long as this continues altcoins have a strong base to continue growing on, if BTC breaks structure and price accepts below ~$110,000 then the altcoin rally will be over for now I believe.
This week some major altcoins are set to reach HTF resistance areas, ETH has already tagged $4,000 which looks to be a battleground level of major importance.
TOTAL2 which is the combined market cap of all altcoins is currently ~8% from the highs, keeping this in mind for where altcoins may run out of steam...
Good luck this week everybody!
Weeklyoutlook
Market Insights with Gary Thomson: 21 - 25 JulyMarket Insights with Gary Thomson: RBA Minutes, BoJ Speech, ECB Decision, UK Sales, Earnings Reports
In this video, we’ll explore the key economic events, market trends, and corporate news shaping the financial landscape. Get ready for expert insights into forex, commodities, and stocks to help you navigate the week ahead. Let’s dive in!
In this episode of Market Insights, Gary Thomson unpacks the strategic implications of the week’s most critical events driving global markets.
👉 Key topics covered in this episode:
— RBA Meeting Minutes
— BoJ Deputy Governor Uchida Speech
— ECB Interest Rate Decision & Press Conference
— UK Retail Sales
— Corporate Earnings Statements
Don’t miss out—gain insights to stay ahead in your trading journey.
This video represents the opinion of the Companies operating under the FXOpen brand only. It is not to be construed as an offer, solicitation, or recommendation with respect to products and services provided by the Companies operating under the FXOpen brand, nor is it to be considered financial advice.

21/07/25 Weekly OutlookLast weeks high: $123,220.24
Last weeks low: $115,718.15
Midpoint: $119,469.19
New BTC ($123,220) & SPX ($6,315) ATH last week! We're really seeing progress being made on all fronts now, bitcoin saw its sixth week of net inflows into BTC ETFs ($2.39B).
The week began strong hitting the new ATH very early and then settled into a tight range to cool off. Altcoins however surged in relation to BTC to break out of HTF downtrends and begin to make up lost ground. One of the beneficiary's of this price movement has been ETH, breaking out from a multi year downtrend against BTC and hitting $3,800 in its USD pair.
For this week I do expect much of the same for BTC as momentum is with altcoins for now. However, as those altcoins reach HTF resistance levels it becomes very important for Bitcoins chop to be accumulation for the next leg up and not distribution for the way down. With so few pullbacks the threat of a sudden correction is present but the probability drops should BTC look to press higher with strong demand.
The ECB Interest rate decision takes place on Thursday but no changes to the 2.15% rate is forecast. In terms of news there are no planned upsets that I can see.
Good luck this week everybody!

14/07/25 Weekly OutlookLast weeks high: $119,494.32
Last weeks low: $107,467.52
Midpoint: $113,480.92
NEW BTC ATH!
This is what we've all been waiting for, BTC breaks through resistance at $110,000-112,000 to set a the highest weekly close ever ($119,086). Thanks to a further $2.27B net inflows via BTC ETFs, the passing of the "big beautiful bill" flipping from a more deficit reduction stance by the US to an environment perfectly suited to risk on assets. Things are looking good for Bitcoin.
This week already in the Asia session BTC has broken above the weekly high to hit $123,100. Despite this incredible rally BTC.D has been falling since Thursday of last week. To me this signals altcoins have started to play catch up and we've seen that with ETH breaking $3000 (+14% relative to BTC).
I would like to see BTC consolidating here above the weekly high while altcoin majors break their choppy rangebound environments and shift to a trending environment just as BTC had last week.
There are also major data releases this week:
Tuesday CPI
Wednesday PPI
Thursday Euro CPI
Thursday US Initial Jobless Claims
I do not expect these data releases to have a major effect on the markets in their current state due to the risk appetite we've seen in both crypto and equities, such shallow pullbacks prove the demand is there to absorb and sell-side pressure for now.
Now is an excellent time to back strong projects with great fundamentals that are breaking out from downtrends/ranges in both their USD & BTC pairs, as BTC.D drops alts can print some great returns. Beta plays of ETH & SOL can offer higher returns than the majors themselves in these market conditions too.
Good luck this week everybody!

Market Insights with Gary Thomson: 14 - 18 JulyMarket Insights with Gary Thomson: Inflation Rate in Canada, US, and UK, US PPI, Earnings Reports
In this video, we’ll explore the key economic events, market trends, and corporate news shaping the financial landscape. Get ready for expert insights into forex, commodities, and stocks to help you navigate the week ahead. Let’s dive in!
In this episode of Market Insights, Gary Thomson unpacks the strategic implications of the week’s most critical events driving global markets.
👉 Key topics covered in this episode:
— Inflation Rate in Canada
— US Inflation Rate
— UK Inflation Rate
— US Producer Price Index
— Corporate Earnings Statements
Don’t miss out—gain insights to stay ahead in your trading journey.
This video represents the opinion of the Companies operating under the FXOpen brand only. It is not to be construed as an offer, solicitation, or recommendation with respect to products and services provided by the Companies operating under the FXOpen brand, nor is it to be considered financial advice.

Market Insights with Gary Thomson: 7 - 11 JulyMarket Insights: RBA Cut in Focus, UK GDP Weakens, Canada Jobs, FOMC Clues, Tariff Deadline
From rate decisions to rising unemployment and tariff deadlines, this week’s macro landscape is shaped by evolving dynamics and shifting momentum. If you’re trading FX, commodities, or indices — this is a moment to pay close attention.
In this episode of Market Insights, Gary Thomson unpacks the strategic implications of the week’s biggest events:
— RBA Interest Rate Decision
— UK GDP Growth Rate
— Unemployment Rate in Canada
— FOMC Minutes
— Tariff Deadline
Don’t miss out—gain insights to stay ahead in your trading journey.
This video represents the opinion of the Companies operating under the FXOpen brand only. It is not to be construed as an offer, solicitation, or recommendation with respect to products and services provided by the Companies operating under the FXOpen brand, nor is it to be considered financial advice.

Market Insights with Gary Thomson: 30 June - 4 JulyMarket Insights with Gary Thomson: Eurozone Inflation, US Jobs, ISM PMIs, ECB Forum Updates
In this video, we’ll explore the key economic events, market trends, and corporate news shaping the financial landscape. Get ready for expert insights into forex, commodities, and stocks to help you navigate the week ahead. Let’s dive in!
In this episode, we discuss:
— Euro Area Inflation Rate YoY Flash
— US Nonfarm Payrolls and Unemployment Rate
— US ISM Manufacturing and Services PMI
— ECB Forum on Central Banking
Note: U.S. markets may see thin trading ahead of the 4 July holiday, raising volatility risks.
Don’t miss out—gain insights to stay ahead in your trading journey.
This video represents the opinion of the Companies operating under the FXOpen brand only. It is not to be construed as an offer, solicitation, or recommendation with respect to products and services provided by the Companies operating under the FXOpen brand, nor is it to be considered financial advice.

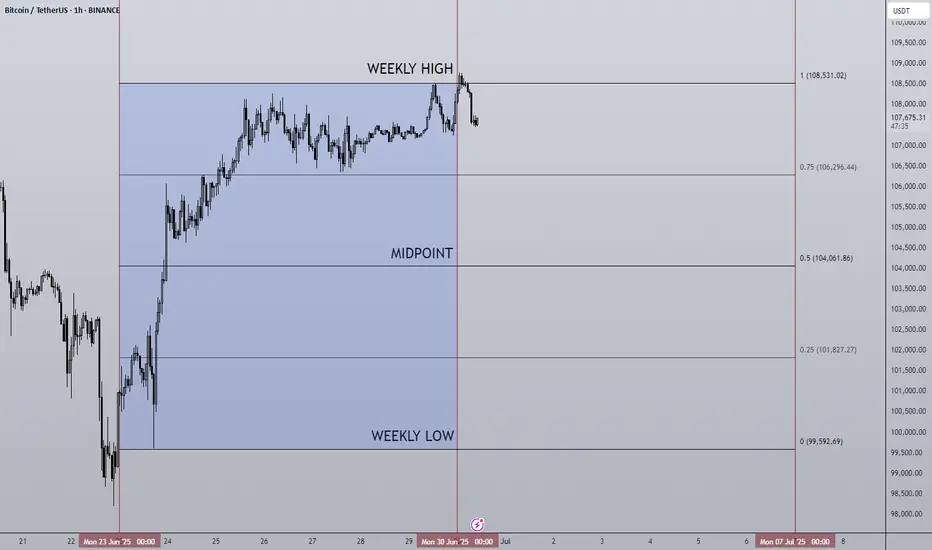
30/06/25 Weekly OutlookLast weeks high: $108,531.02
Last weeks low: $99,592.69
Midpoint: $104,061.86
Overall a positive week for BTC in isolation as price moves steadily all week reclaiming the losses made in the week from the 16th-23rd June. This comes after a $2.2B BTC ETF weekly inflow, the 3rd consecutive week of net inflows.
Having now hit the key S/R level of $108,500 it will be interesting to see where BTC goes from here. Jumping up above the level will require a lot from the bulls as ATH is within touching distance and so buying into major resistance is a tough ask. We also have Geo-political uncertainties to add to the situation, one bad tweet is all it takes sometimes to do a lot of damage.
On the other hand the SNP500 hits new ATH in the same conditions and so BTC is more than capable of doing the same.
So far in the first hours of this weeks trading we do have a SFP of the weekly high setup, not ideal for the bulls in any way and so from here the a retest of the range quarters, midpoint being the key area would make sense, invalidation would be a clean break above weekly high with acceptance and strong volume on the move to break the rangebound/choppy environment.
There is also the "window dressing" element to the months &quarter end today. History shows a de-risking going into these events and more money flowing back into risk-on assets in the days following monthly/ quarterly end. For that reason a bullish move (if there were to be one) would come later in the week IMO.
Good luck this week everybody!
Market Insights with Gary Thomson: 23 - 27 JuneMarket Insights with Gary Thomson: Canada Inflation, US Core Consumer Metrics, and Earnings Reports
In this video, we’ll explore the key economic events, market trends, and corporate news shaping the financial landscape. Get ready for expert insights into forex, commodities, and stocks to help you navigate the week ahead. Let’s dive in!
In this episode, we discuss:
— Inflation Rate in Canada
— US Durable Goods Orders
— US PCE Price Index, Personal Income & Personal Spending
— Corporate Earnings Statements
Don’t miss out—gain insights to stay ahead in your trading journey.
This video represents the opinion of the Companies operating under the FXOpen brand only. It is not to be construed as an offer, solicitation, or recommendation with respect to products and services provided by the Companies operating under the FXOpen brand, nor is it to be considered financial advice.

Market Insights with Gary Thomson: 9 - 13 JuneMarket Insights with Gary Thomson: UK Unemployment & GDP, US Inflation & PPI, Earnings Reports
In this video, we’ll explore the key economic events, market trends, and corporate news shaping the financial landscape. Get ready for expert insights into forex, commodities, and stocks to help you navigate the week ahead. Let’s dive in!
In this episode, we discuss:
— UK Unemployment Rate
— US Inflation Rate
— UK GDP Growth Rate
— US Producer Price Index
— Corporate Earnings Statements
Don’t miss out—gain insights to stay ahead in your trading journey.
This video represents the opinion of the Companies operating under the FXOpen brand only. It is not to be construed as an offer, solicitation, or recommendation with respect to products and services provided by the Companies operating under the FXOpen brand, nor is it to be considered financial advice.

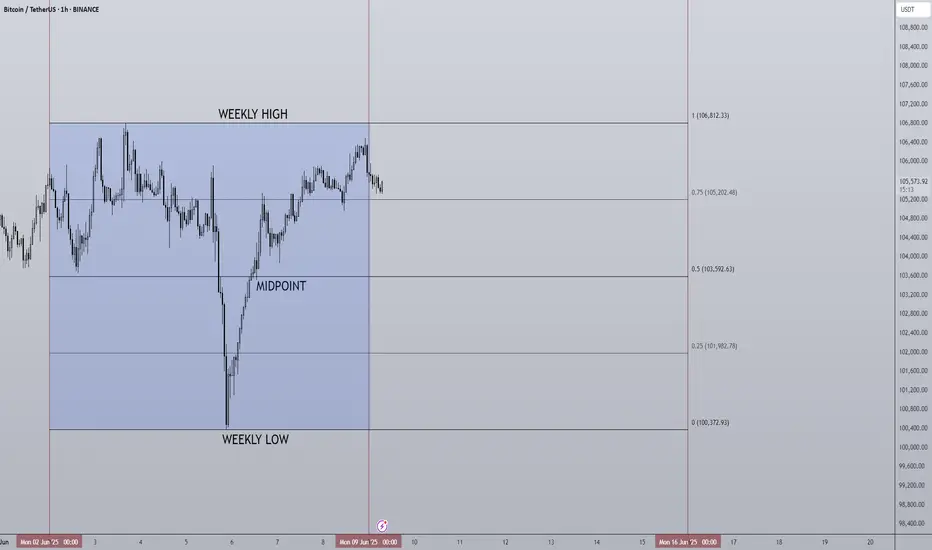
09/06/25 Weekly OutlookLast weeks high: $106,812.33
Last weeks low: $100,372.93
Midpoint: $103,592.63
Billionaire spats and V-shaped recoveries, the beginning of June starts off in an interesting way. As President Trump goes forward with "The big beautiful bill" Elon Musk lets his feelings be known publicly sending shockwaves throughout markets, but what does this mean for Bitcoin?
The bill could add $3-5T in US government spending which is great for risk-on assets as there is more money able to flow into markets. I believe this exact thought process is visible on the chart in the V-shaped recovery we can see on Thursday. A clear sell-off as Elon Musk's anti government spending views clash with the bill, the uncertainty causes a sell the news moment, just as BTC comes into $100,000 the dip is bought up on the realization this means greater inflows are on the way, dips are truly for buying at this stage in the cycle and to me, this proves it.
In a more bearish view of the chart I would say the clear resistance is now weekly high at ~$106,000. Anything above that meets huge selling pressure with price discovery on the other side the market just doesn't seem to have the fuel as of yet to make the next step. However I believe it is just a matter of time and as M2 global money supply grows we get closer and closer to seeing new significant highs.
For this week CPI & PPI take place on Wednesday and Friday respectively. With CPI set to grow from 2.3% to 2.5% according to forecasts it will be interesting to see how markets react, expect short term volatility. Key battlegrounds for me are weekly high and midpoint.
Good luck this week everybody!
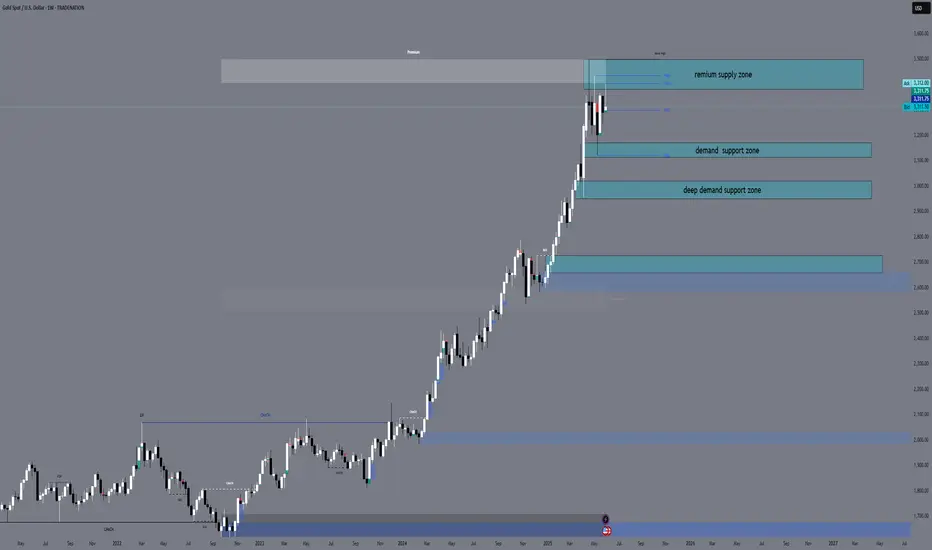
XAUUSD Weekly Outlook – Premium Territory Battle BeginsHey team!
Hope you're all feeling sharp and focused — here’s what we’re watching this week on XAUUSD 👇Week of June 9–13, 2025
📍 Bias: Bullish, but cautiously reactive at premium supply
🔹 1. 🔍 Market Structure (W1)
Strong impulsive BOS continuation from 3245 → current price near 3312.
Weekly structure shows clean Higher Highs (HH) and Higher Lows (HL) since Q4 2023.
The premium zone around 3380–3500 is now in play — it’s a weak high zone with upside liquidity targets still intact.
🔹 2. 🧱 Key Weekly Zones
Zone Type Price Range Notes
🔼 Premium Supply Zone 3380 – 3500 Final weak high zone, imbalance + OB supply above
🔽 Demand Support 1 3115 – 3170 Recent impulsive candle origin & imbalance
🔽 Demand Support 2 2950 – 3020 Prior CHoCH base & last HL support
🔽 Long-Term Demand 2660 – 2720 Weekly OB, deep discount zone
🔹 3. 📊 EMAs Context
EMA 5 / 21 / 50 / 100 / 200: Full bullish alignment.
Price is aggressively extended above all EMAs, suggesting possible retracement into the 3115–3170 zone if price fails to break above premium supply cleanly.
🔹 4. 🎯 Fibonacci Swing Analysis
Main fib: 3245 (last HL) → 3395 (current swing high).
50% retracement = ~3320, current price is hovering around this equilibrium.
A move back to 3115–3170 = golden zone, could serve as a clean long re-entry if premium gets rejected.
🔹 5. 🧠 RSI Context
Weekly RSI remains overbought, hovering near 70+.
Momentum remains strong, but any failure to break the weak high may trigger a cooling phase (pullback to EMA50 or fib 61.8%).
🔹 6. 🌍 Macro + Geopolitical Notes
NFP released Friday (June 6): Mixed impact — job creation weak but hourly earnings slightly strong.
Fed still data-dependent → CPI (next week) will be key.
Gold remains sensitive to inflation + Fed rate expectations. A dovish shift or inflation spike could send price beyond 3400.
📌 Weekly Scenarios
🔼 Bullish Continuation
Break above 3380–3395 → 3450–3500 target zone
Needs impulsive close above premium with volume and no rejection wick.
🔽 Retracement Play
Failure to break 3380 → pullback into 3115–3170
Clean demand, imbalance, and fib confluence support re-entry.
✅ GoldFxMinds Final Note
Gold is now in premium pricing — either distribution begins, or we’ll witness a parabolic extension into 3450–3500.
🧠 Watch reactions, not just zones. Trade confirmation.
💬 Let us know how you're positioning for the week — are you buying dips or fading premium?
Stay sharp,
— GoldFxMinds 💡
Market Insights with Gary Thomson: 2 - 6 JuneMarket Insights with Gary Thomson: BoC & ECB Rates, Canada and US Job Data & Earnings Reports
In this video, we’ll explore the key economic events, market trends, and corporate news shaping the financial landscape. Get ready for expert insights into forex, commodities, and stocks to help you navigate the week ahead. Let’s dive in!
In this episode, we discuss:
— BoC’s Interest Rate Decision
— ECB’s Interest Rate Decision
— Unemployment Rate in Canada
— NFP and Unemployment Rate in the US
— Corporate Earnings Statements
Don’t miss out—gain insights to stay ahead in your trading journey.
This video represents the opinion of the Companies operating under the FXOpen brand only. It is not to be construed as an offer, solicitation, or recommendation with respect to products and services provided by the Companies operating under the FXOpen brand, nor is it to be considered financial advice.

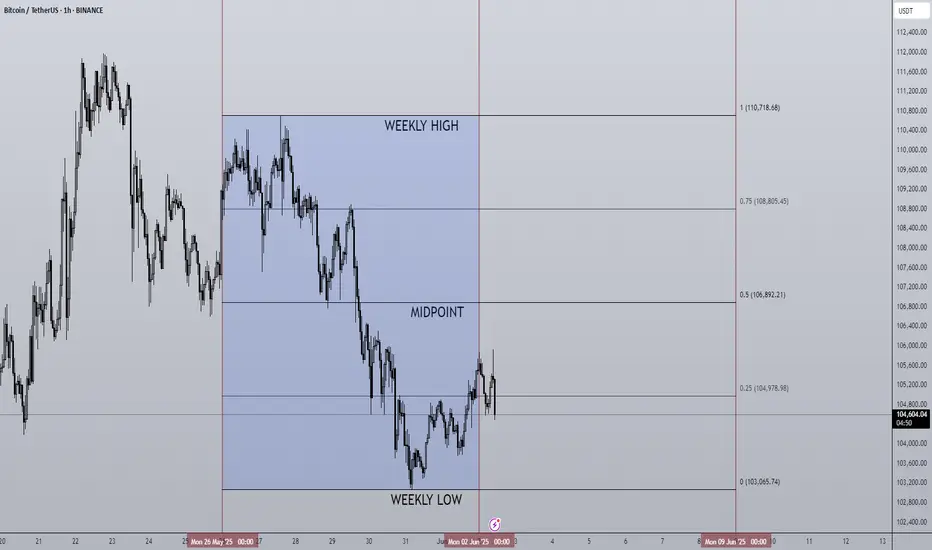
02/06/25 Weekly OutlookLast weeks high: $110,718.68
Last weeks low: $103,065.74
Midpoint: $106,892.21
As we approach the middle of the year, Bitcoin is back above $100,000 despite pulling back from a new ATH of $112,000. In the month of MAY BlackRocks ETF had record inflows of over $6B propelling prices 11% higher.
Last week we saw as the month closed and with that it's natural to have a window dressing period that usually leads to de-risking slightly. BTC stayed within the previous weeks range and maintains the pattern of:
Chop/consolidation --> expansion to the upside --> chop/consolidation...
However in this case the consolidation week had a much larger range than in the past which is a sign to me that the rally is exhausted for now. It's because of this I feel we may see a weekly low break for the first time in a month and get a more meaningful pullback than we've seen since early April. My target would be around the $97,000 area.
The case for the bulls is still a convincing one despite some red flags. Record ETF inflows continue to pour, M2 money supply continues to grow and a general shift to risk-on assets is clear. However these are longer term factors and just for this weeks outlook the momentum is with the bears briefly.
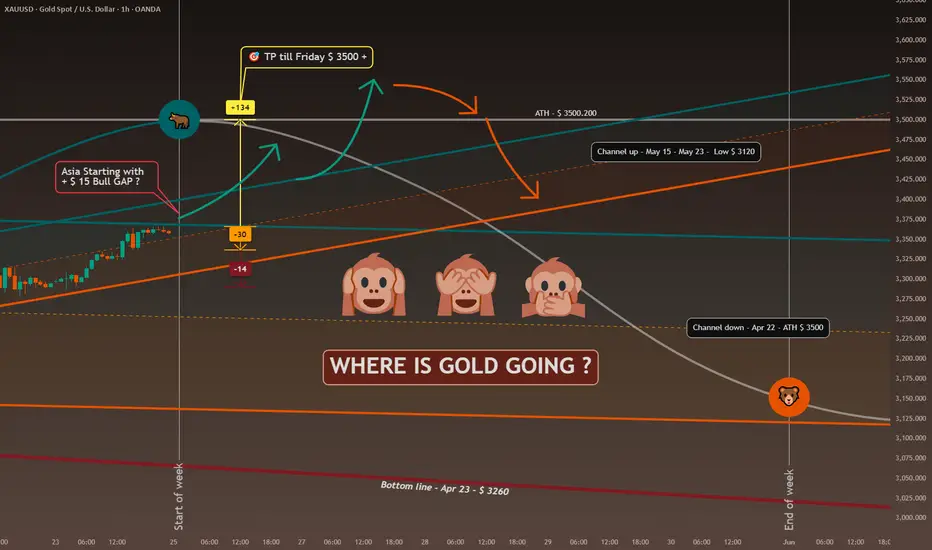
With Bullish bias into new Week - 2025/05/26Last week, I published my idea for a whole week with daily updates for the first time. You can read about it here:
🎯 The target of $3348 was reached on Friday due to the announcement of new tariffs against the European Union.
💡 Here is my idea for the week from May 26-30, 2025.
First things first, the Friday session last week ended with bullish momentum. Even though the gold price consolidated more at the $3366 mark, it was obviously to allow time to pass and calm down stressed values like EMA or MACD. This is a very good sign for the start of the week because if the Asia timezone takes the invite, the gold price has a good chance to rise. My expectation is a bullish GAP right at the beginning; if so, it's a clear sign for the rest of the day, in my opinion. These thoughts would support my goal from above $3500 during the week.
📰 Geopolitical News Landscape
India / Pakistan
The ceasefire from May 10 remains tense but intact. Both sides claim victory, while Pakistan strengthens ties with China. Cross-border attacks have ceased, but mutual distrust persists.
➡️ Situation remains fragile; renewed escalation is possible.
Gaza Conflict
Israel intensifies "Gideon’s Chariot" with ground forces in Khan Younis. Mass evacuations and high civilian casualties worsen the humanitarian crisis. Peace talks have stalled as the offensive continues.
➡️ No relief in sight; humanitarian conditions are deteriorating further.
Russia / Ukraine
On May 24, Russia launched its largest air assault yet with 367 missiles and drones—13 civilians were killed. Just before, both sides exchanged 1,000 prisoners. Peace talks remain suspended.
➡️ Violence is escalating; a ceasefire remains out of reach.
U.S.–China Trade War
The 90-day tariff pause triggered a rush to import from China. Shipping bottlenecks and high freight rates are straining businesses. Structural issues remain unresolved.
➡️ Short-term easing; long-term tensions persist.
Trade War on global view
The global trade war has escalated in May 2025, with the U.S. imposing a 50% tariff on EU imports and a 25% levy on foreign-made smartphones, citing trade imbalances. The EU has condemned these moves, warning of potential retaliation. In response to U.S. tariffs, China has restricted rare earth exports, impacting global supply chains. ASEAN nations, heavily affected by U.S. tariffs ranging from 10% to 49%, are urging deeper regional integration to mitigate economic disruptions. The IMF has downgraded global growth forecasts to 2.8% for 2025, citing trade tensions and policy uncertainty. Supply chains are being restructured, with companies shifting production to countries like Vietnam and Mexico. Financial markets are volatile, with increased inflationary pressures and investor anxiety.
➡️ Emerging markets face currency volatility and economic instability due to the ongoing trade conflicts.
⚖️Trump vs. Powell
President Trump increases pressure on Fed Chair Powell to cut rates. The Fed holds interest rates at 4.25–4.5% and warns of inflation. A 10% staff reduction is planned to boost efficiency.
➡️Political interference is increasingly destabilizing markets.
U.S. Inflation – April 2025
Inflation dropped to 2.3%, the lowest since February 2021. However, consumer inflation expectations remain high at 7.3%. The University of Michigan Consumer Sentiment Index fell to 50.8—a historic low.
➡️A clear gap is emerging between official data and public perception.
🔋 Technical Analysis – Short-Term
📊 Analysis: May 19–24, 2025
Weekly Low: $3,204 (May 20)
Weekly High: $3,366 (May 23)
Weekly Close (May 23): approx. $3,358
Total Gain: +5%
🟢 Trend: A clear uptrend is evident. After hitting a low of $3,204 on May 20, gold experienced a strong rally, forming consistently higher highs and higher lows. A brief pullback on May 22 was quickly bought up.
📈 Structure: A series of bullish flag patterns developed, each resolving to the upside. The high at $3,366 currently marks the most significant resistance level.
🔮 Outlook from May 26, 2025
Resistance: $3,366 (recent high)
Support: $3,310 (last local low), below that $3,280 (breakout zone)
Bias: Bullish as long as price holds above $3,310
📌 Scenario 1 – Bullish Breakout: A sustained breakout above $3,366 could unlock further upside potential toward the $3,390–$3,410 area. When Asia session starting with bull GAP the Scenario is the one i preffer.
📌 Scenario 2 – Pullback: A retracement to the $3,310–$3,280 zone would be a healthy correction within the trend, provided this zone holds.
🧭 Conclusion:
Gold remains in a steady uptrend. As long as support levels hold, a continuation toward $3,500 is likely. RSI may be overbought on higher timeframes, so short-term consolidations are possible, but structurally the setup remains bullish.
Anything to ad? Feel free to tell your thoughts.
-------------------------------------------------------------------------
This is just my personal market idea and not financial advice! 📢 Trading gold and other financial instruments carries risks – only invest what you can afford to lose. Always do your own analysis, use solid risk management, and trade responsibly.
Good luck and safe trading! 🚀📊
26/05/25 Weekly OutlookLast weeks high: $111,965.73
Last weeks low: $101,994.78
Midpoint: $106,980.26
New BTC ATHs! Well done to those who capitalized on the move and continue to believe in this Bitcoin.
For the last two weekly outlooks I have talked about the pattern of consolidation for 1 week --> expansion the next. Last week We got our expansion week right on queue and this time around BTC made a new ATH hitting just shy of $112,000.
Should the pattern continue this week will be a week of consolidation/chop, however this week is different now that we're at ATH levels. My gut says a pullback is coming after such an aggressive move up with almost no pullbacks at all.
Should BTCs price drop below the Midpoint I think there will be a big struggle to continue this rally in the short term. Initially target would be weekly low and main HTF target would be $97,000 IMO. That would be a healthy pullback to continue the rally.
For the bulls you don't want momentum to stop in the short term, flipping $110,450 and weekly high would put BTC back into price discovery, once any asset is in price discovery it's very difficult to tell where the sell pressure will come from and so shorting becomes very risky.

Market Insights with Gary Thomson: 19 - 23 MayMarket Insights with Gary Thomson: RBA Rate Decision, Canada & UK Inflation Rate, Earnings Reports
In this video, we’ll explore the key economic events, market trends, and corporate news shaping the financial landscape. Get ready for expert insights into forex, commodities, and stocks to help you navigate the week ahead. Let’s dive in!
In this episode, we discuss:
— RBA’s Interest Rate Decision
— Inflation Rate in Canada
— Inflation Rate in the UK
— Corporate Earnings Statements
Don’t miss out—gain insights to stay ahead in your trading journey.
This video represents the opinion of the Companies operating under the FXOpen brand only. It is not to be construed as an offer, solicitation, or recommendation with respect to products and services provided by the Companies operating under the FXOpen brand, nor is it to be considered financial advice.

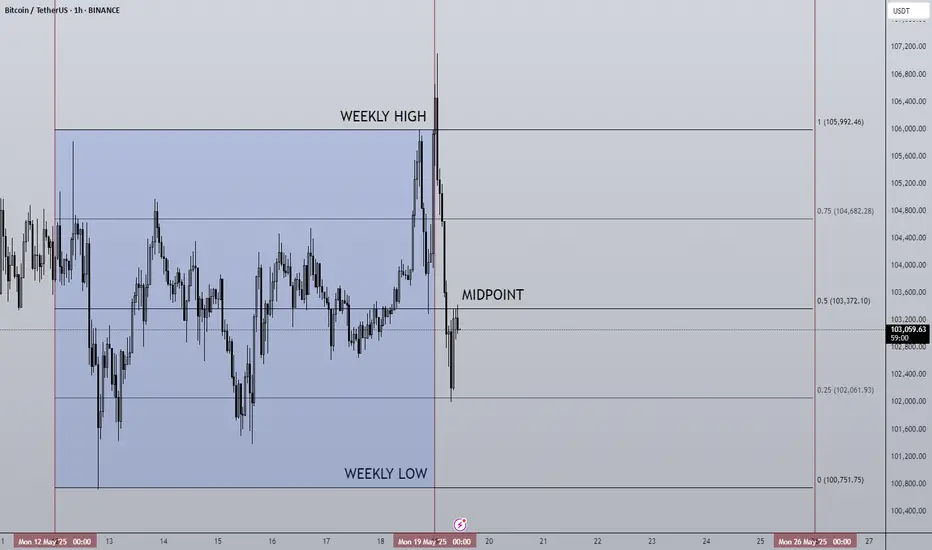
19/05/25 Weekly OutlookLast weeks high: $105,46
Last weeks low: $100,751.75
Midpoint: $103,372.10
In my weekly outlook post from last week I mentioned how there was a clear pattern of consolidation with a tight range for a week with a week of expansion that followed, and that if the pattern were to continue we would see BTC consolidate around the weekly high. The theory was proven correct on this occasion with a tight range between weekly high and the 0.75 line, as theorized with only momentary dips below the 0.75 line. Now if the pattern were to continue this week would be expansion week, but for me this time it's slightly different as BTC approaches ATH there is a massive level of resistance just above this weeks weekly high. We've seen an initial early attempt to breakout above weekly high and that attempt has so far failed quite aggressively, which leads me to believe there will be volatility this week as both bulls and bears contest this very important area of the chart.
For the bulls maintaining momentum and breaking into price discovery with acceptance above $109,000 would be incredibly, the headlines will read new ATH, FOMO kicks in and retail follows etc, we know the drill. For the bears the objective is to hold the line and reject weekly high ($106,000) at all costs and print a strong SFP and unfortunately this does seem viable with $97,000 being the target area IMO. RSI on the daily is around the overbought level, combined with key resistance level a pullback would make sense.
For me this week I want to see how ETH and other major alts react to any pullback, do they get bought up with purpose? Is the structure strong to maintain this move or is this a HTF lower high? An interesting week coming up I'm sure.
Good luck this week!
Market Insights with Gary Thomson: 12 - 16 MayMarket Insights with Gary Thomson: US Inflation Rate, UK GDP Growth Rate, US PPI, Earnings Reports
In this video, we’ll explore the key economic events, market trends, and corporate news shaping the financial landscape. Get ready for expert insights into forex, commodities, and stocks to help you navigate the week ahead. Let’s dive in!
In this episode:
— US Inflation Rate
— UK GDP Growth Rate
— US Producer Price Index
— Corporate Earnings Statements
Don’t miss out—gain insights to stay ahead in your trading journey.
This video represents the opinion of the Companies operating under the FXOpen brand only. It is not to be construed as an offer, solicitation, or recommendation with respect to products and services provided by the Companies operating under the FXOpen brand, nor is it to be considered financial advice.

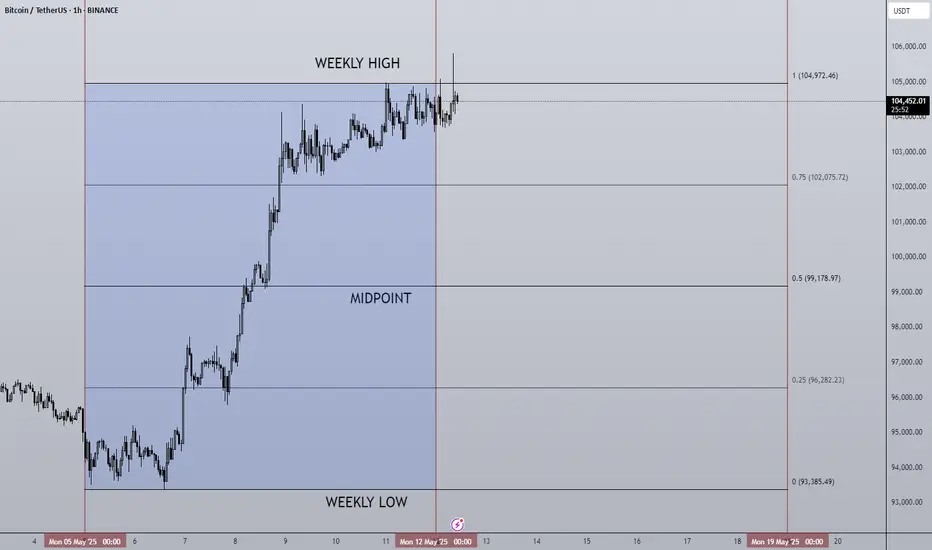
12/05/25 Weekly OutlookLast weeks high: $104,972.46
Last weeks low: $93,385.49
Midpoint: $99,178.97
Bitcoin climbs over 12% from weekly low to weekly high, an incredible achievement despite a mixed performance in Tradfi. A pattern we've seen since the $74,500 double bottom following Liberation day goes; A strong rally for a week, consolidation in a tight trading range for a week, then repeat. Should this pattern continue we should see consolidation between weekly high and $102,075 (0.75 line).
CPI & PPI take place this week on Tuesday and Thursday respectively, inflation is still a big talking point but baring a crazy print I would be surprised if these events move BTC. In the last few hours at time of writing The US has reduced tariffs on China to 30% for 90 days, China has reduced tariffs on the US down to 10%. To me this signifies the worst of the trade war narrative is behind us.
This week I will be tracking altcoins with strong fundamentals as BTC.D rolls over from its highest point since January '21, ETH has already had a strong breakout from the downtrend and with BTC at ATH levels with strong resistance this should be the time to see altcoin strength and play catch-up.
Good luck this week!
Market Insights with Gary Thomson: 5 - 9 MayMarket Insights with Gary Thomson: Fed and BoE Rate Decisions, Canada Jobs, Earnings Reports
In this video, we’ll explore the key economic events, market trends, and corporate news shaping the financial landscape. Get ready for expert insights into forex, commodities, and stocks to help you navigate the week ahead. Let’s dive in!
In this episode, we discuss:
— Fed’s Interest Rate Decision
— BoE’s Interest Rate Decision
— Unemployment Rate in Canada
— Corporate Earnings Statements
Don’t miss out—gain insights to stay ahead in your trading journey.
This video represents the opinion of the Companies operating under the FXOpen brand only. It is not to be construed as an offer, solicitation, or recommendation with respect to products and services provided by the Companies operating under the FXOpen brand, nor is it to be considered financial advice.

05/05/25 Weekly OutlookLast weeks high: $97,941.18
Last weeks low: $92,845.16
Midpoint: $95,393.17
FOMC week returns once again on Wednesday, the forecast suggests no change to the interest rate is expected with 4.5% staying as is. The tariff acceleration we saw last month brought into question the timing of rate cuts and if they would be brought forward, it looks like this FOMC is too early to see a cut but it is coming in the future if president Trump gets his way.
The chart is an interesting one but one that isn't too surprising. The orderblock that sent Bitcoins price to $74,500 was at ~$97,000, naturally that area would be major resistance and so a huge amount of Stop Losses were placed there, price swept that supply zone wiping out SL and SFP back under the resistance zone, a textbook move.
An accumulation under the resistance area would be a sign that the bulls are building to flip the zone, however a gradual sell-off from here would then look like a HTF lower high, a very bearish pattern.
Going into the FED interest rate decision there is usually a lot of de-risking/ sidelining from traders until the decision is made, therefor the second half of the week would give us more directional information.

WEEKLY ANALYSIS TO HELP YOUR TRADING: Nasdaq, NQ, NAS100A pretty accurate week from my last video analysis if I do say so myself.
This week, I'm anticipating more bullish price action, however, there's also a strong chance for an inside bar which could have price working within last week's trading range. Based on the levels discussed in this video, price has reason to try and close bullish yet again, so I'll be watching price action for entries into longs and managing my risk accordingly.
Happy Trading,
The Meditrader
