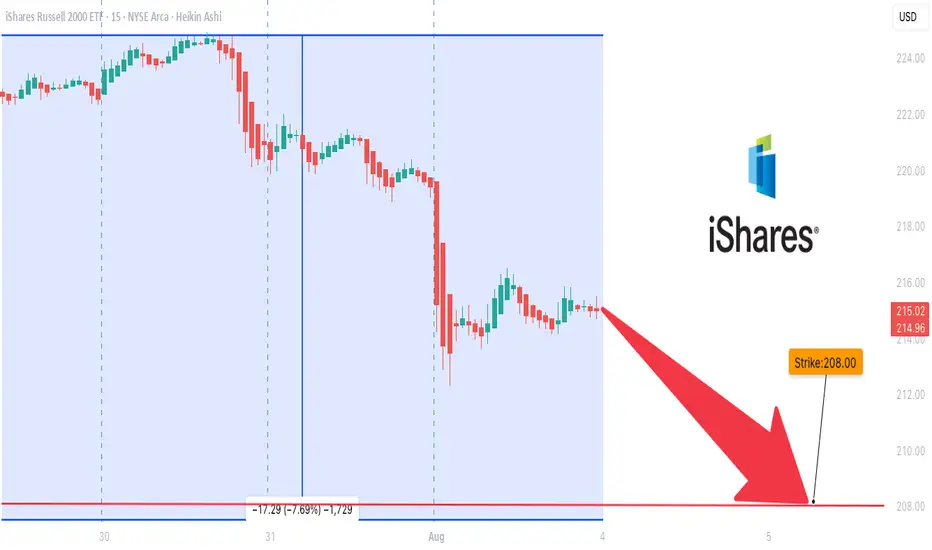
IWM is Overbought### ⚠️ \ AMEX:IWM Bearish Setup Alert — Weekly PUT Trade (Aug 3, 2025)
> **Momentum breakdown + institutional volume = high-probability short play**
📉 **Market Breakdown:**
* **📉 Daily RSI:** 34.9 → Bearish momentum under key 45 level
* **📊 Weekly RSI:** 53.0 → Neutral but slipping = trend weakening
* **📈 Volume Spike:** 1.4x → Institutional moves hint at potential sell-off
* **⚖️ Options Flow:** 1.00 C/P ratio → No bias = wait for price action
* **💀 Max Pain:** \$222.50 → Downward price magnet
* **🌪️ VIX:** 20.38 → Normal vol zone, good for option plays
---
### 💥 Trade Setup – 5D Weekly PUT
| Entry | 🎯 Target | 🛑 Stop Loss | ⚖️ R/R Ratio | 📅 Expiry |
| ------ | ------------- | ------------- | ------------ | ---------- |
| \$0.92 | \$1.35 (+50%) | \$0.45 (-50%) | 1:1.5 | 2025-08-08 |
🔻 **Strike:** \$208.00
💼 **Type:** Naked PUT
⏰ **Timing:** Enter at market open
📈 **Confidence:** 70%
🧠 **Logic:** Bearish RSI + volume surge + neutral flow = downside edge
---
### 🔍 Summary
> “IWM is losing grip. Momentum says down. Big players are already positioning.”
> 🔸 Short-term PUTs offer attractive R/R
> 🔸 Low volatility improves pricing
> 🔸 Weekly RSI still neutral → stay nimble
---
📊 **TRADE DETAILS**
🎯 Instrument: **IWM**
🔀 Direction: **PUT (SHORT)**
🎯 Strike: **\$208.00**
💵 Entry: **\$0.92**
🎯 Target: **\$1.35**
🛑 Stop Loss: **\$0.45**
📅 Expiry: **2025-08-08**
📈 Confidence: **70%**
🕒 Entry Timing: **Open**
---
### 💡 Tag It:
\#IWM #PutOptions #WeeklyTrade #BearishMomentum #RSIAlert #OptionsFlow #MaxPainTheory #VolatilityTrading #MarketOutlook #TradingView #OptionsAlert
Weeklytrade
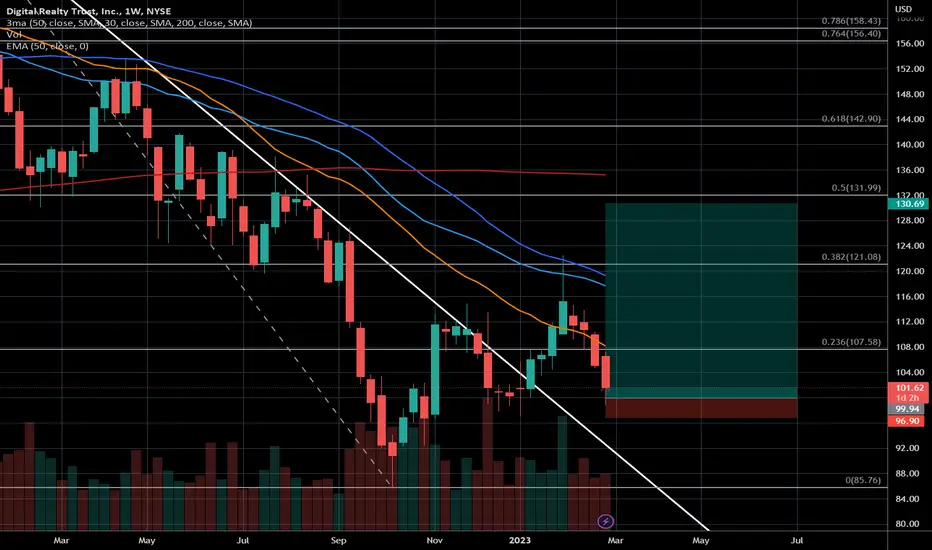
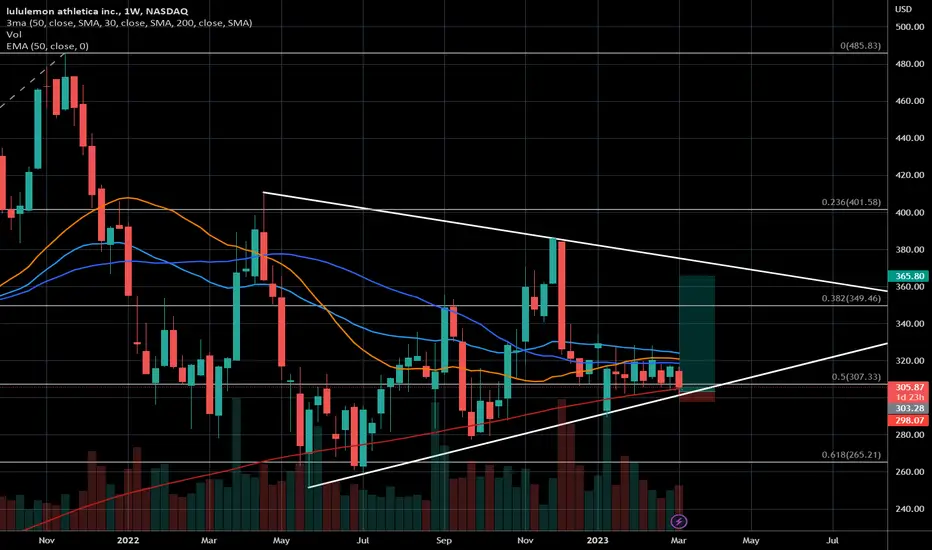
Enter Long DLRSee chart. This might have been the end of the downwards correction. Overall I'm bullish on DLR.
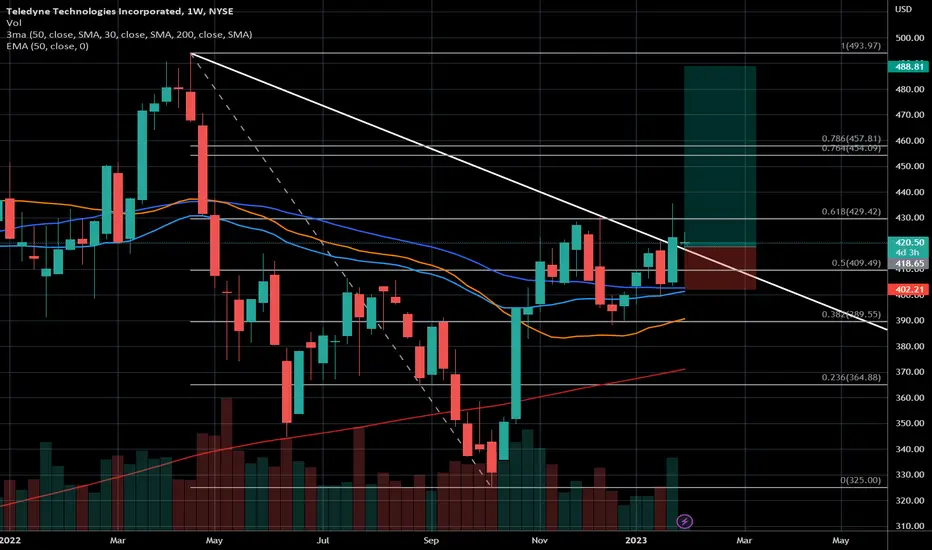
$TDY long - let the magic happen↗See chart. Should be self-explaining. If you have any questions don't hesitate to use the comments down here ...
Bought the reboundTrading the price movement inside the big triangle. As long as there is no prolonged close below the SMA 200 (red) I'm leaning bullish here.

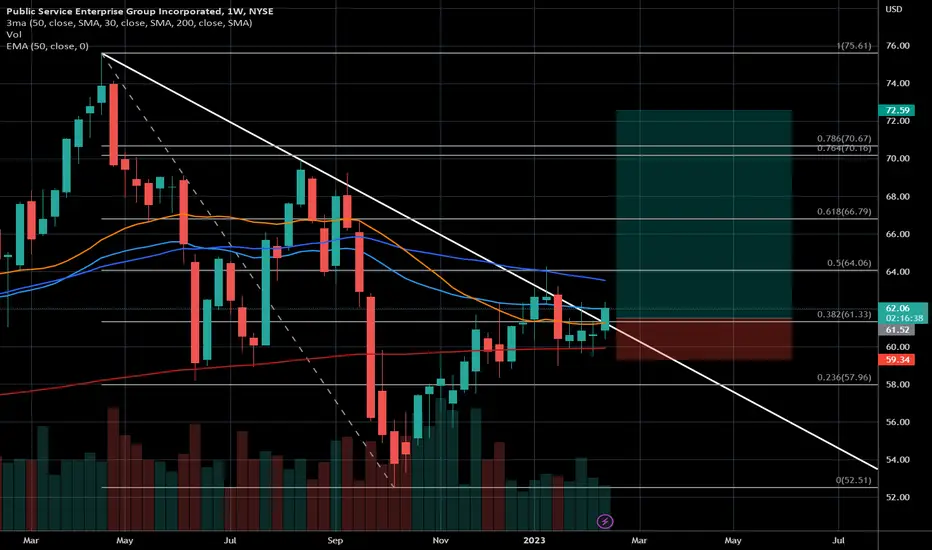
$PEG longAs drawn in the chart - seems to be a nice long setup.
If you've got any questions feel free to use the comment section down here ... good trades, folks!
Waiting for the pull-back ... ⚡See chart. Horizontal consolidation was broken to the upside. Waiting for a pullback to the breakout level now. If you have any questions - feel free to use the comment section below ...

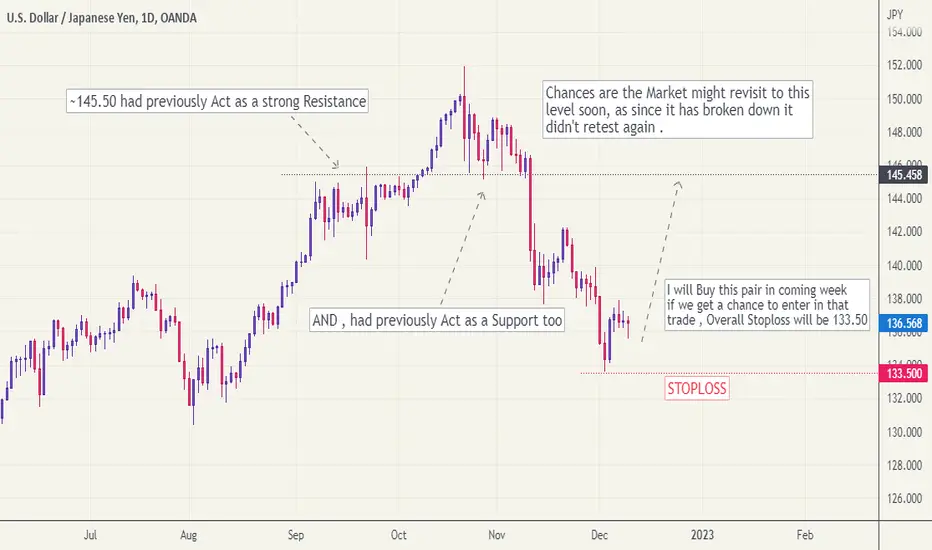
USDJPY - Trade Setup that Matters !Hello dear fellows, thanks for your Love and Appreciation that i am receiving since i actively publish trade ideas again.
It has been long time since i posted the Weekly Trade setup. SO , here is my coming week's Trade Setup which i will be actively watching and might
share with you when i will be in this trade .
( PS : i am not an artist so you guys never see my charts full of colors or lines or indicators or Artwork. i always like to publish simple charts
so everyone can understand easily ! )
Trade with Strict Risk Management and this will be not your Last Trade so do not attach to it emotionally!
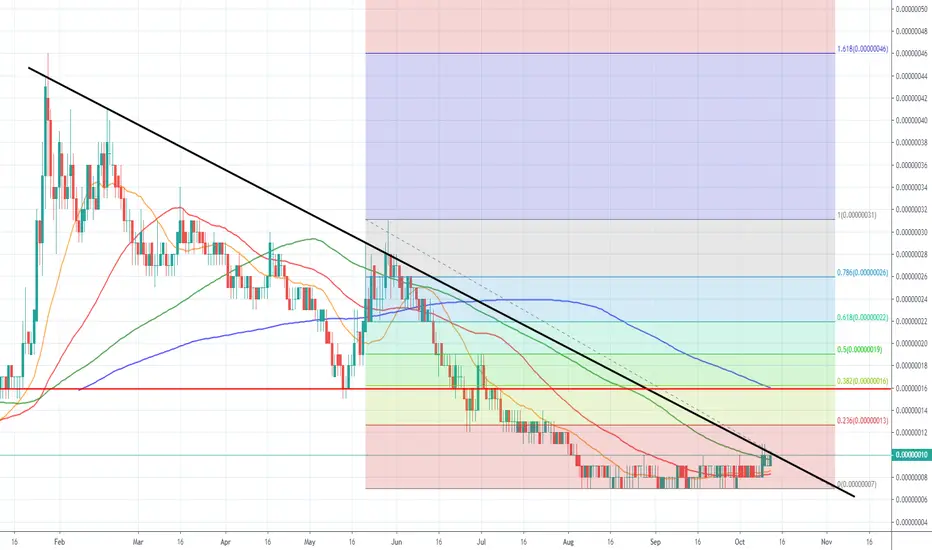
HOT Pump IncomingBig move on HOT (Holochain) coming!
Both the 20MA and 50MA looking to cross the 100MA next week, and I'd expect it to hit at least 16 satoshis (200MA on the daily) and potentially much higher!
On the weekly chart, we have the first bullish crossover on the MACD forming since March earlier this year.
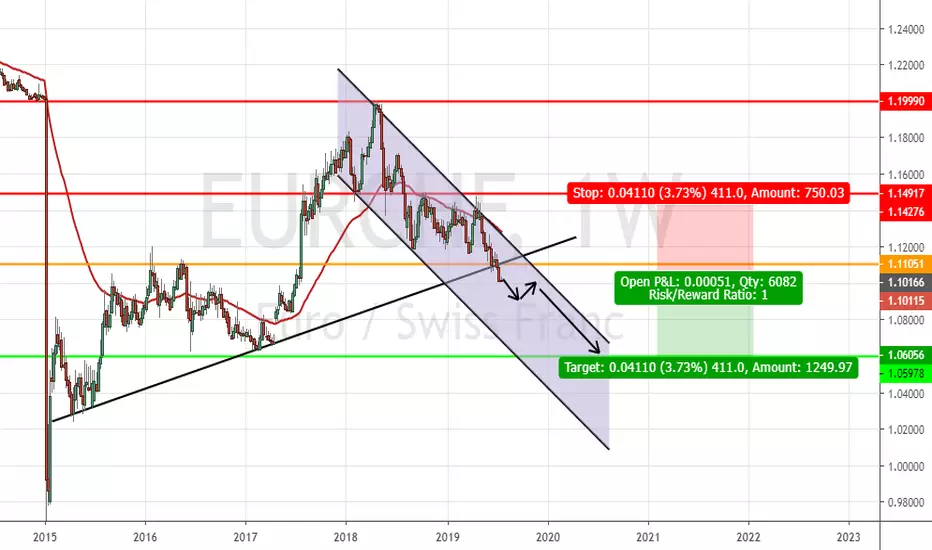
EURCHF SHORT Swing Trade Executed! Price Aiming For 1.0600Please have a look at the link below for the full analysis behind this SWING TRADE setup.
INSTANT ENTRY AT AROUND: 1.10100 level
STOP LOSS: 1.14200
TAKE PROFIT: 1.0600
RR: 1:1
TYPE: SHORT TRADE
Shall there be any updates to the details i will notify in this tread.
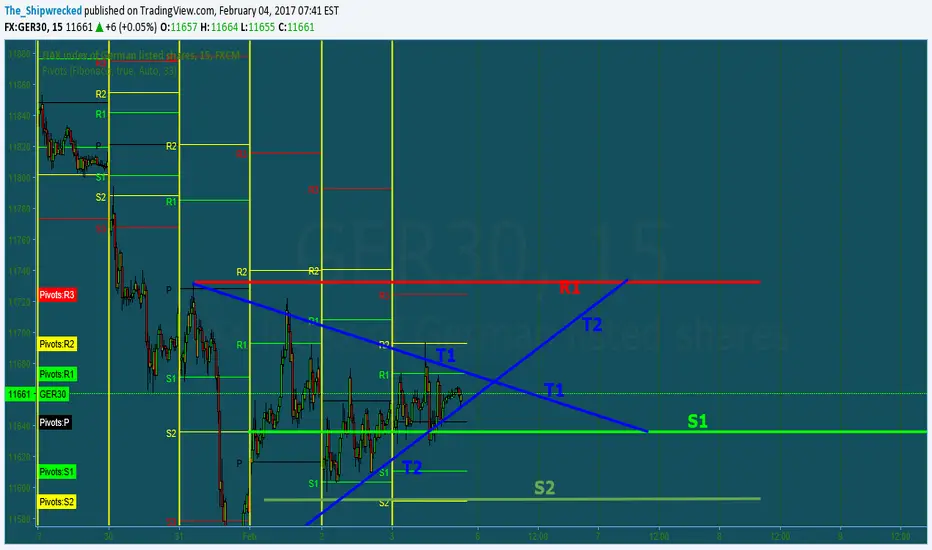
GER30 in a Triangle area. Weekly analyseHola guys,
Our DAX30 is in a indecision moment, this is the reason this week i staied neutral. It is between R1 resistence and S1, S2 supports. The triangle pattern is made by connecting T1 upper trendline and T2 lower trendline. Also in the chart you can see T3 daily trendline.
Now... my plan for the next week is to wait Monday to see where it's gonna break and after i'll wait a confirmation for the trend that is gonna come ( i'll look for a test ceilling ).
We could have:
1) breaking of T2 and a test ceilling on T1 or S1. Than i'll sell paying attention at 5min candle stick patterns and at the price action. I'll also look for the possible pullback on S2 and T3 ( this are bullish areas ); here i could swip the trade, but anyway i'm gonna advice you if a change is near. S1 and T1 will protect my SL while the first TP could be when the price touches T3
2) breaking of T1 trendline and a test ceiling on the same trendline. This would be a bullish signal ( of course first we have to look at the price action of the market and candle stick patterns ). In this case i'm gonna take a long position, paying attention at when the market touches R1 resistence ( this is the strongest bearish area ). If a swip of the trade will happen i'll write you. S1 will protect my trade while the TP will be near to 11800 ( or i'll close it at a strong pullback that could be a change of direction ).
This is my weekly technical analyse for GER30. When the broke of the triangle will happen i'll publish the idea of the direction that i'm taking.
I hope that this idea will help you. Personally i'll use it to open BO options and couwntdowns... and of course for normal trading too. For any question about the analyse or others request like: the reason of the support and resiste areas, money management or personal market advicer service or account manager ( if you're account is in a bad moment ) contact me in p.m. without any problem, i'll be happy to help you.
Kind Regards,
Delta B.