XLM Stellar - Previous video continuation, as forecasted.Not much to say. Just watch the forecast on previous video a few days back. Close to Fib now - no entries.
Video:
Enjoy!
Weiswave

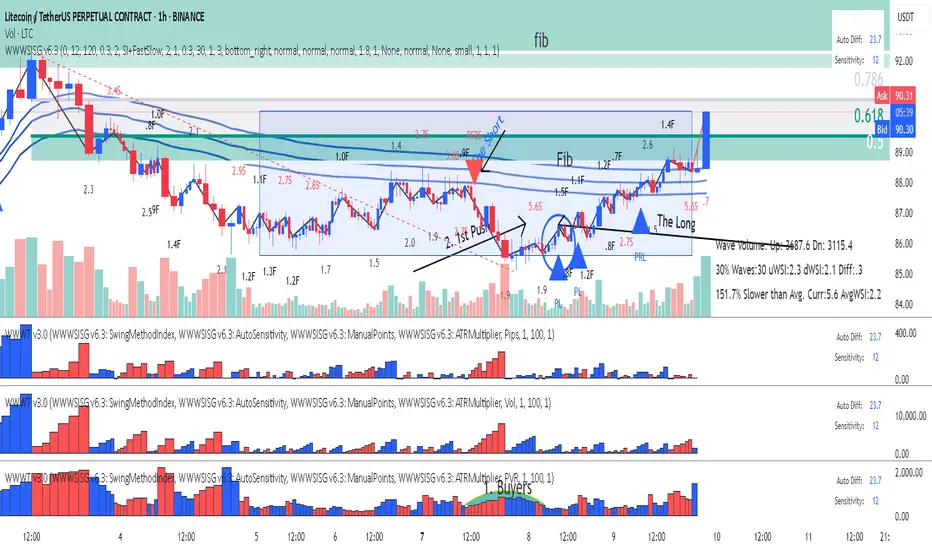
LTC- LitCoin - This is how a Fake Break on Fib looks like This is how a Fake Break on Fib looks like using Weis Wave with Speed Index
Reading the Daily Cha rt
1. Fib Location - Sellers could enter here
2. Largest Up volume wave after a while - also sellers could be hidden in there.
3. Increasing PVR (progressing volume rate) = as we approve the top more volume comes in (sellers)
4. This up wave has the highest Speed Index 10.0S of all the up waves in the trend, that's a HTMU (hard to move up = sellers)
5. The highest PVR bar =sellers
6. Another Abnormal Speed Index 25.5 S - that's another HTMU = more sellers on the up move, price cannot progress upward anymore.
7. and finally down we go with a PRS signal.
All the ingredients for the Short were there. Reading Weis Wave with Speed Index is like reading a book, page after page, until you reach to the last page that the writer has kept the surprise, the only difference is that this is never ending chart book with many stories. This was the story of LTC for now. I think this story has not ended yet and continue to drop to another Fib, the details on the 1HR!.
I hope you enjoy this chart reading lesson using Weis Wave with Speed Index.

BitCoin - Is it heading for the Fib?This is a classic Entry Short for Weis Wave with Speed Index owners called " Exit from Range with a Plutus Signal" and in this case it was a PS. It looks that it's heading for the Fib, I will wait for some pullback on 1HR to confirm with Speed Index and the waves, as well as getting a better RR.
I

BNB Binance Coin: Lesson 15 methodology did the job again
Lesson 15 methodology (annotations in sync with the chart):
1. Largest up volume wave after a while - sellers might be in there.
2. Placed AVWAP and waited for price to cross downwards and pullback again on AVWAP
3. HTMU (hard to move up) - Abnormal Speed Index 4.6S at the top
4. Entry short signal PRS with abnormal SI 4.8.2 (price has a hard time to move up - absorption)
Simple as that. Enjoy!

HOW TO: Reading the Daily Chart on XLM - getting ready to ShortIn this video I will demonstrate how I read the chart using two indicators Weis Wave with Speed Index Signals and Weis Wave - Wave Types.
Enjoy!

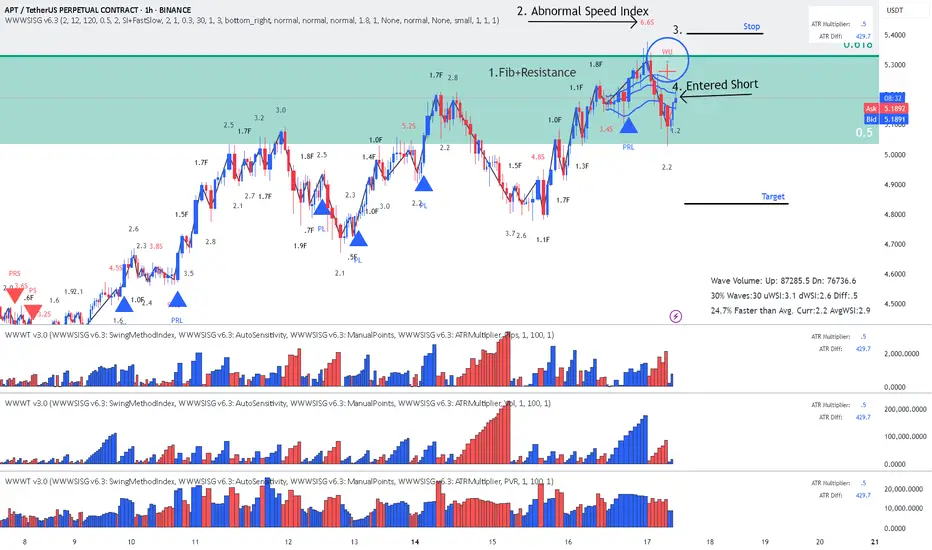
APT - Short on Wyckoff Up-ThrustReading the chart (annotations in sync with the chart):
1. Location: Fib+ Resistance level
2. Abnormal Speed Index of 6.6S (Hard to move up or closing positions)
3. Wyckoff Up-Thrust signal from signal
4. Entered Short on pullback to AVWAP
RR 1:2
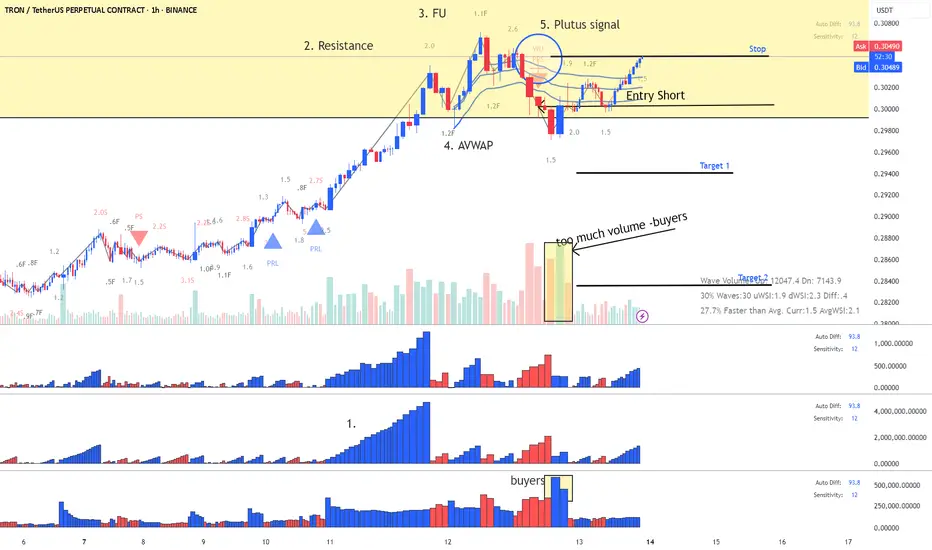
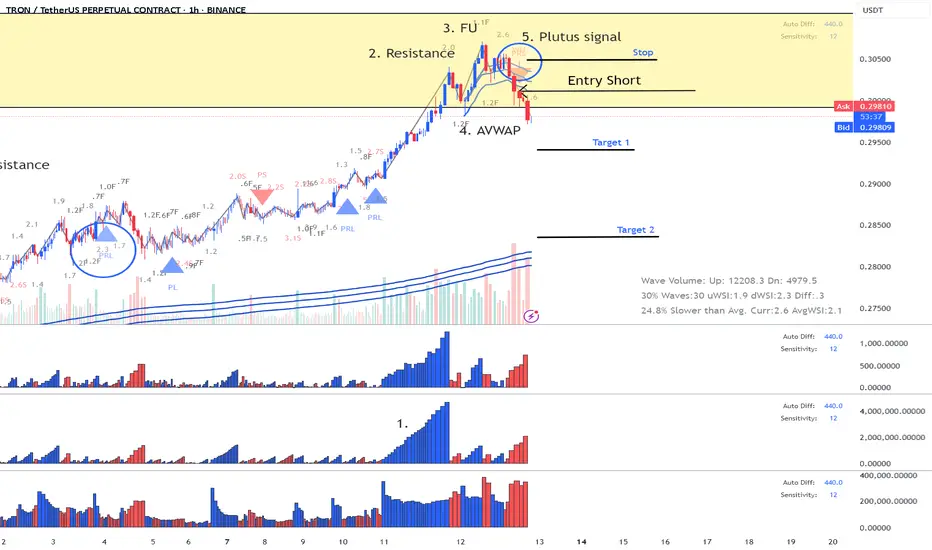
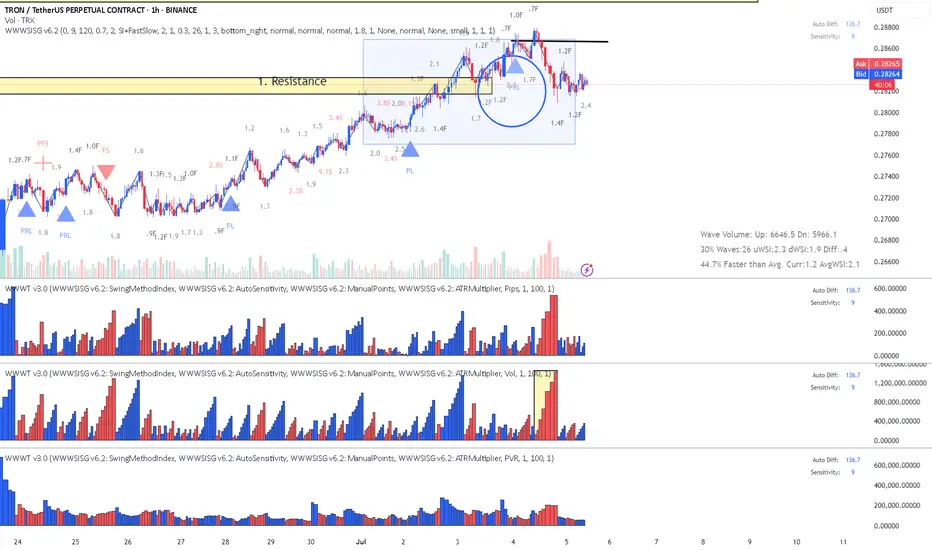
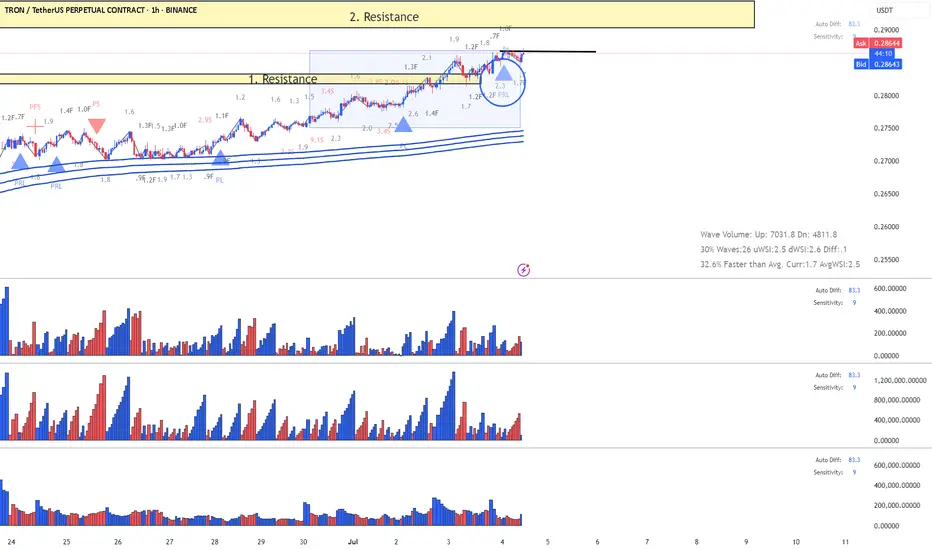
TRX - Double signal short Wyckoff Up-Trust + PRS Reading the chart (annotations in sync with chat):
1. Largest Up volume wave
3. Resistance Level coming from Daily chart
3. Fast Up Wave (could be fake)
4. Placed AVWAP on fast wave and
5. Our Entry: Double Plutus signal after the retracement Wyckoff Up- Trhust + PRL
Enjoy reading the waves , speed index and Plutus signals.
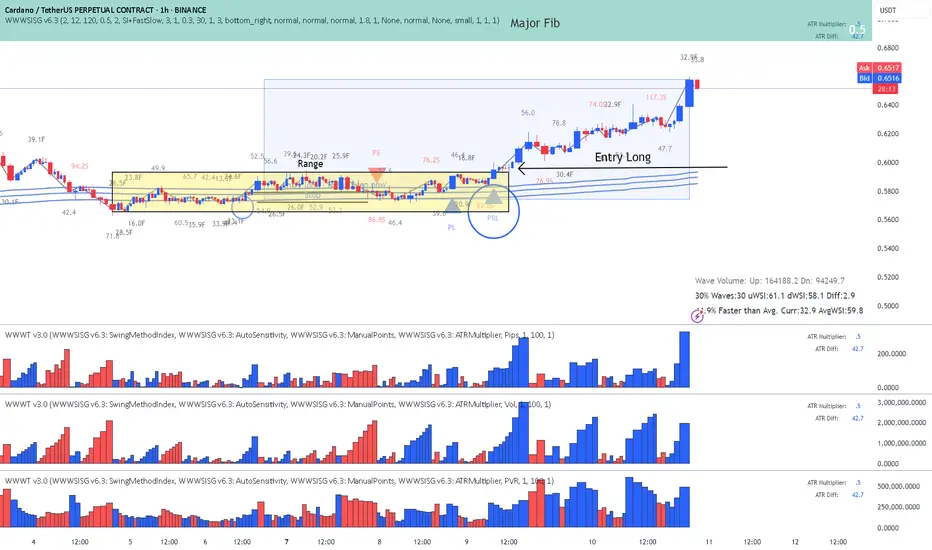
ADA- Cardano - Classic Exit from Range with Plutus signalReading the chart :
AVWAP acted as resistance and we started ranging.
This is a classic entry long for the "SI traders" called Exit from Range with a Plutus signal and in this case it was the PRL signal.
ADA is heading for a major Fib I will not advise any entries now.
Enjoy wave and speed index reading!
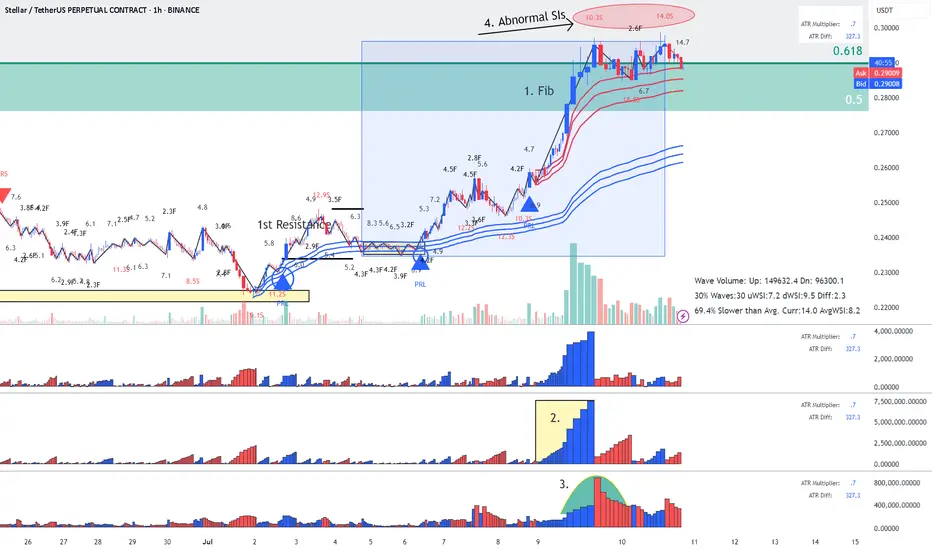
XLM - Stellar - Possible Short coming up - This is Why?Reading the chart (annotations in sync with chart):
1. Location: Fib over-shoot - possible sellers
2. Largest up volume - possible sellers in there
3. Mountain shape PVR - increasing volume as wave progress
4. Abnormal SIs at top (could be closing positions but it also could be sellers absorbing buy orders.
Risky Entry but with better RR enter now. stop above tops, target blue AVWAP
Conservative Entry with worse RR: wait for the break downwards of red AVWAP, target blue AVWAP.
Enjoy, wave and speed index reading!
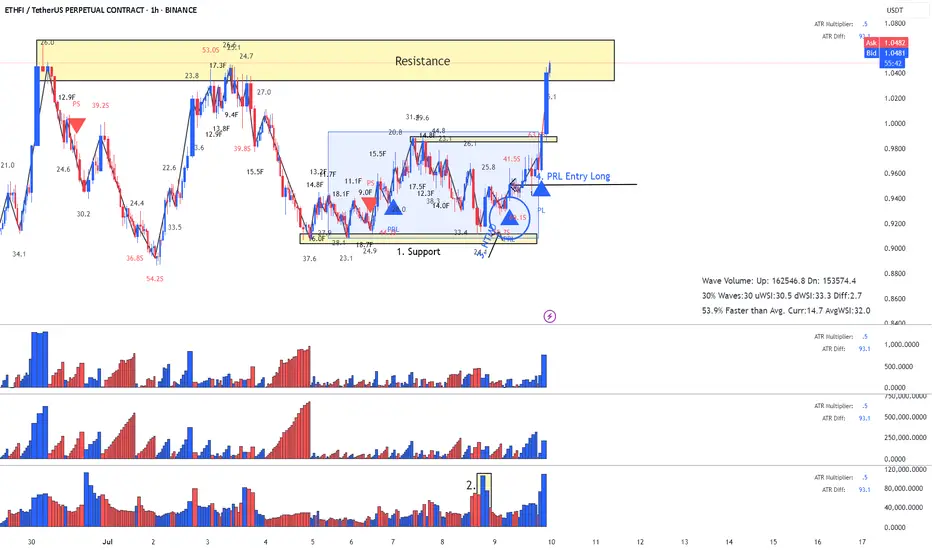
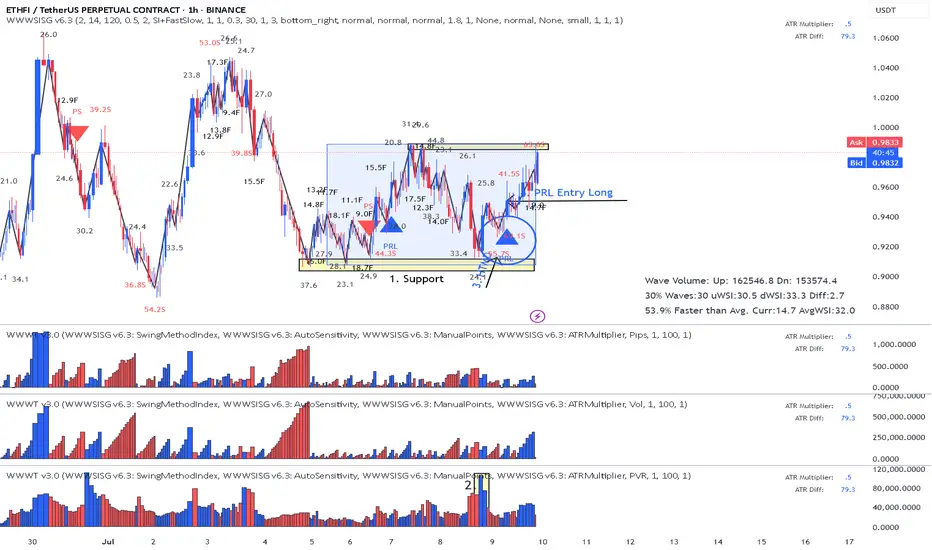
ETHFI - Target ReachedTarget reached closed with profit - let's not be greedy - this has a resistance level quite a few times
Enjoy trading with Volume Waves and Speed Index.
Enjoy trading because the chart reading says so not because because an indicator says so!!!
LTC - Litecoin - After the Short the LongAfter the short Signal on the AVWAP line we found buyers at the bottom.
1. PVR mountain shape is the first indication that buyers are coming in.
2. Abnormal SI 5.6 is what I call 1st Push Up.
Finally the entry Plutus signal PL.
You should be careful now because we are crossing Fib 61.8, get you profits sellers might be in that high volume bar. The reaction later waves will be indication if we are going to continue or reverse.
Enjoy Trading the Volume Wave and Speed Index!
ETHFI - Reached first target level - resistanceFollowing previous idea, the questions is ? let run or close it ?
One thing is for sure, move stop above break even to get some profits if you decide to let it run price turns.
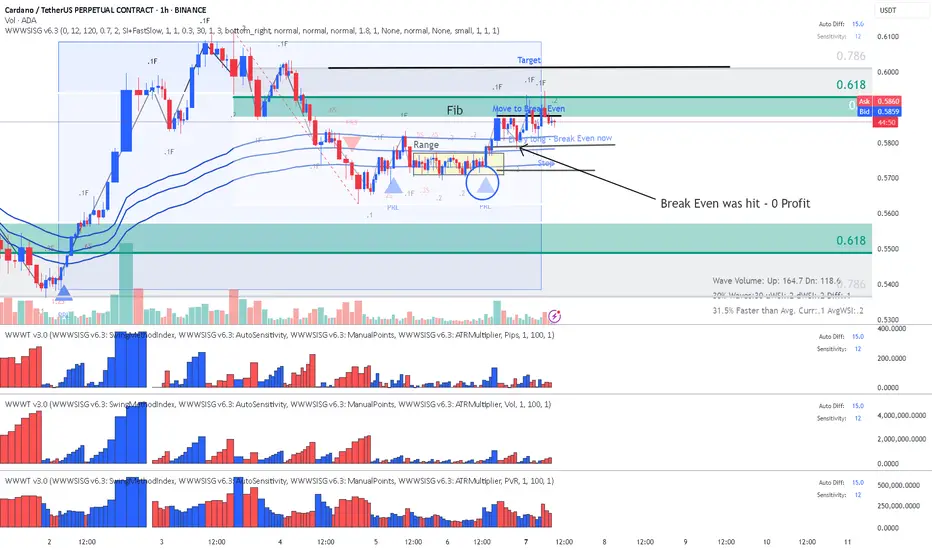
ADA - Cardano - BreakEven was hitFollowing my previous post, these sellers on Fib managed to hit my Break Even - there goes our free trade, but no problem. Mark Douglas used to say "every trade is unique" !!!
Enjoy!
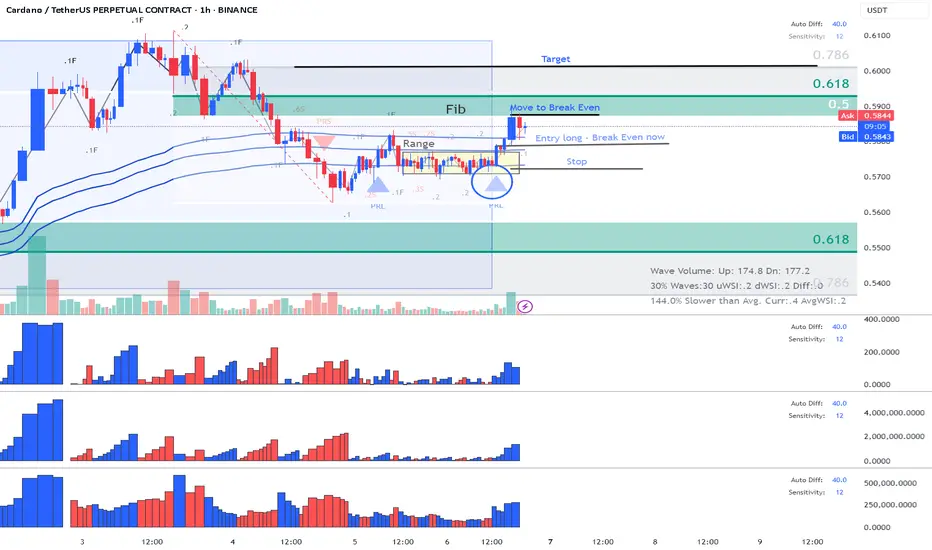
ADA - Cardano - Long - Classic Exit from Range with PRLThis is one of my classic trading strategies called "Exit from Range" with Plutus signal and in this case it was a PRL.
Entered Long on the Exit from range, put my stop and hopping that we might cross Fib. When price reached Fib moved my stop a bit above breakeven to compensate on brokers fees and now we are running a free trade. Currently sellers did show up on the Fib , but let's see who is going to win!
Enjoy!
TRX - Getting Out with a small LossIt seems that some sellers came in before resistance level. I am sure sure about the outcome so I am getting out with a small loss
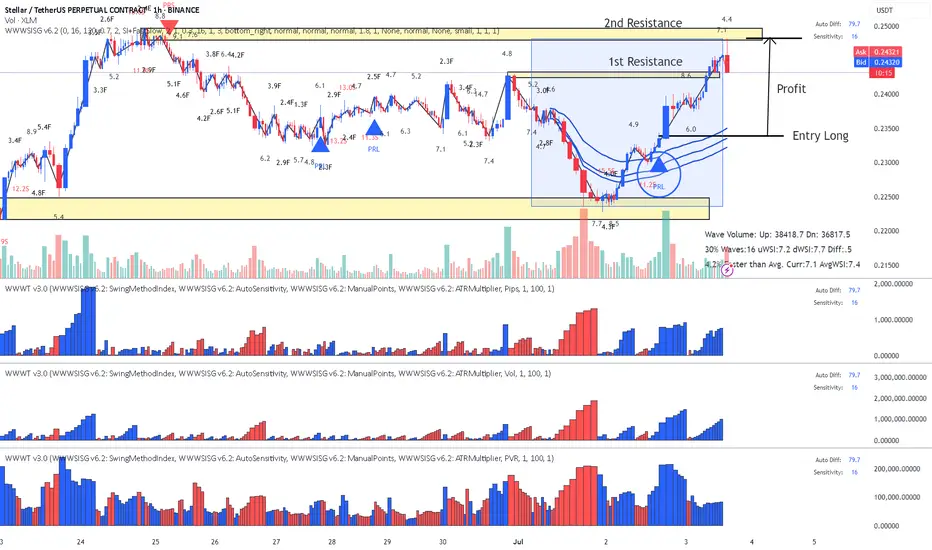
TRX - No weakness yet went Long on PRL signal No obvious signs of weakness on the waves.
Up waves larger than down waves and no abnormal SIs
Therefore I went long after the 1st resistance break on PRL signal, target the 2md resistance.
Enjoy!
XLM Stellar Long Closed on 2nd ResistanceBased on previous entry explanation posts
Trade was closed with nice profit on second resistance which happen to touch it right on US non Farm news.
Enjoy!
XLM Stellar - Classic Lesson 15 said Long Lesson 15 methodology (annotations in sync with the chart):
1. Support (this where buyers can come in)
2. Largest dn volume wave after a while - Look left - buyers came in previously at the same location.
3. Placed AVWAP and waited for price to cross upwards and pullback again on AVWAP
4. Entry signal PRL with abnormal SI 11.2 (price has a hard time to move down - absorption) after the pullback and that's our entry.
Enjoy!

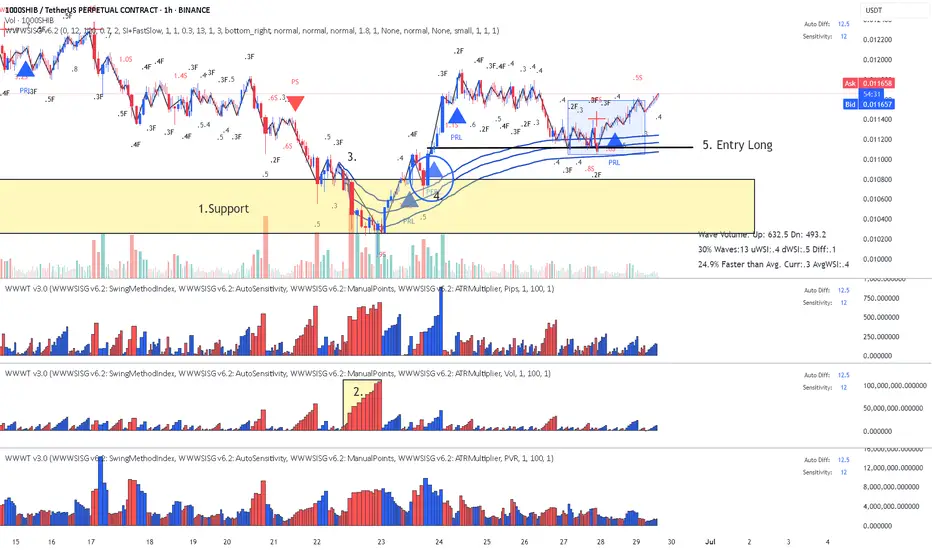
SHIB - Lesson 15 this is how to read the chartUsing Lesson 15 to read the chart (annotations in sync with chart):
1. Support (coming from daily chart)
2. Largest down wave (buyers could be in there)
3. Placed AVWAP wait for the price to cross upwards and pull back
4. PFBL Long signal on the pull back and up we go
Enjoy !
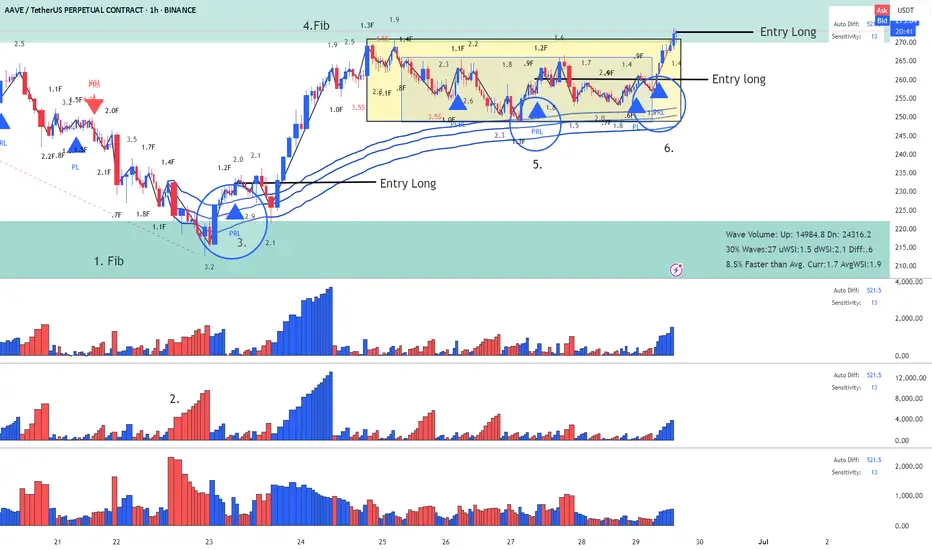
AAVE - Lesson 15 said Long and the pull back another LongReading the chart using Lesson 15 and Exit from Range methodology (annotations in sync with the chart)
1. Fib Location (buyers might enter)
2. Largest down volume wave (potential buyers in there) - Placed AVWAP at the beginning of the down wave wait for price to cross upward and pullback
3. Entry Long with PRL signal - first target fib closed with profit
4. Fib was reached and pull back started
5. PRL long on AVWAP acting a resistance
6. This my last Entry using strategy Exit from Range with a Plutus signal.
This is a risky Long since we are on Fib area, but I will take the risk.
Enjoy!
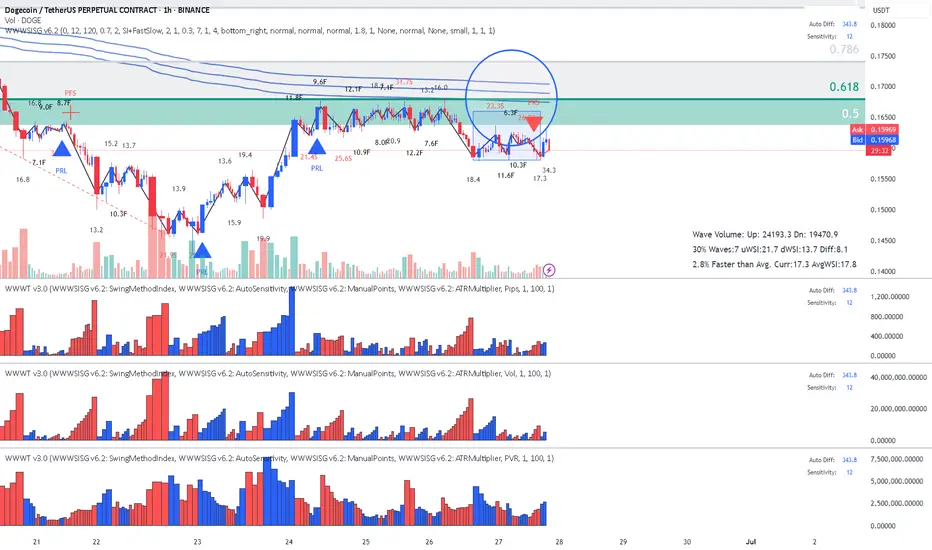
DodgeCoin - Speed Index is telling me ShortReading the chart
1.Location: Fib + touch AVWAP low
2. Speed Index numbers at top on the High side (red numbers) which means Hard to Move Up.
3. PRS Short signal
4. If we do not get stuck into range and break it downwards , it's Short!
Enjoy! Reading the chart with Speed Index!
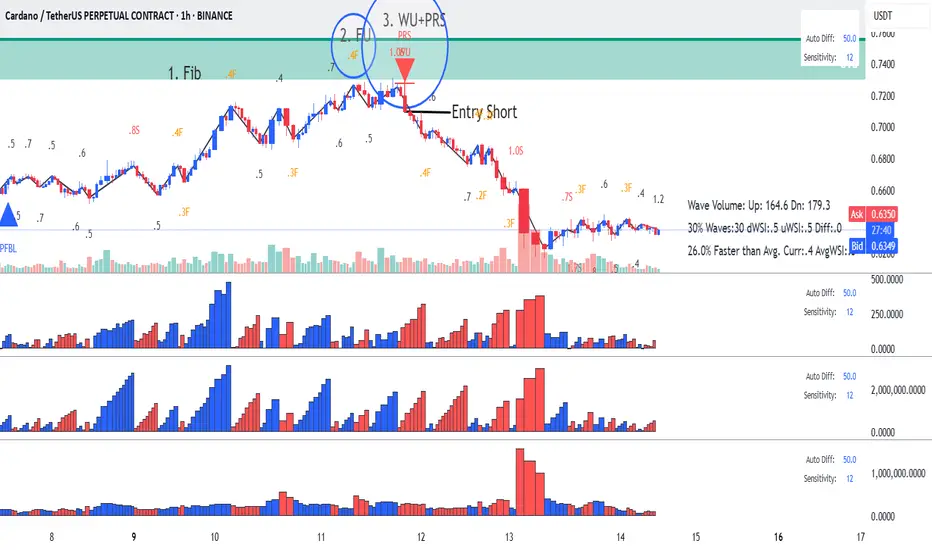
Wyckoff Up-Thrust - This is how to identify using Speed indexClassic Wyckoff Up-Thrust formation, this is how to read it using Speed Index (annotations in sync with the chart):
1. Fib Area - this is where sellers might come in
2. FU - Fast Up wave with SI 0.4F
3. Next up wave with an abnormal SI of 1.0S while the average speed at 0.5, which means price has a hard time to move up (more sellers on the up move). Following the up wave on the down move we have double Short signals WU-Wyckoff Up-Thrust and PRS-Plutus Reversal Short and this where we enter.
I hope this was helpful. Enjoy!