BitCoin - Is it heading for the Fib?This is a classic Entry Short for Weis Wave with Speed Index owners called " Exit from Range with a Plutus Signal" and in this case it was a PS. It looks that it's heading for the Fib, I will wait for some pullback on 1HR to confirm with Speed Index and the waves, as well as getting a better RR.
I
Weiswavevolume

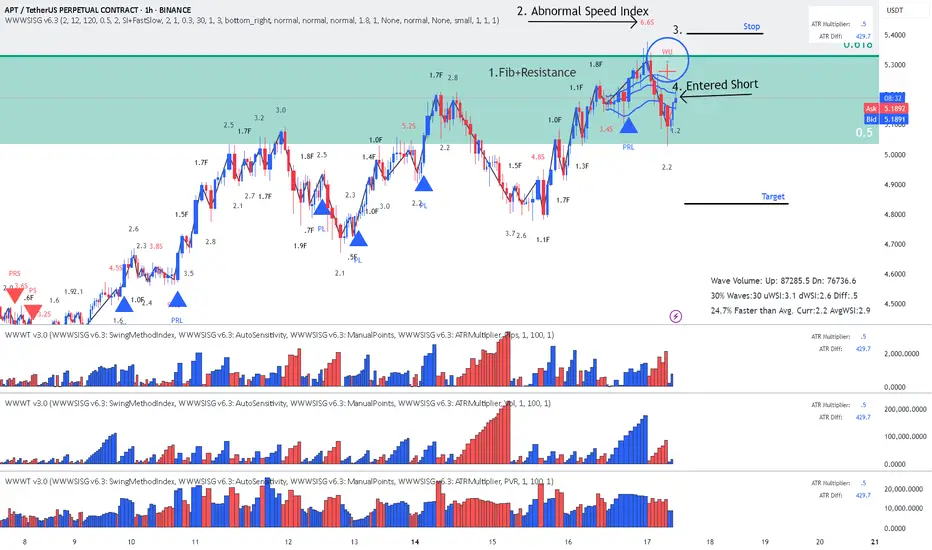
APT - Short on Wyckoff Up-ThrustReading the chart (annotations in sync with the chart):
1. Location: Fib+ Resistance level
2. Abnormal Speed Index of 6.6S (Hard to move up or closing positions)
3. Wyckoff Up-Thrust signal from signal
4. Entered Short on pullback to AVWAP
RR 1:2
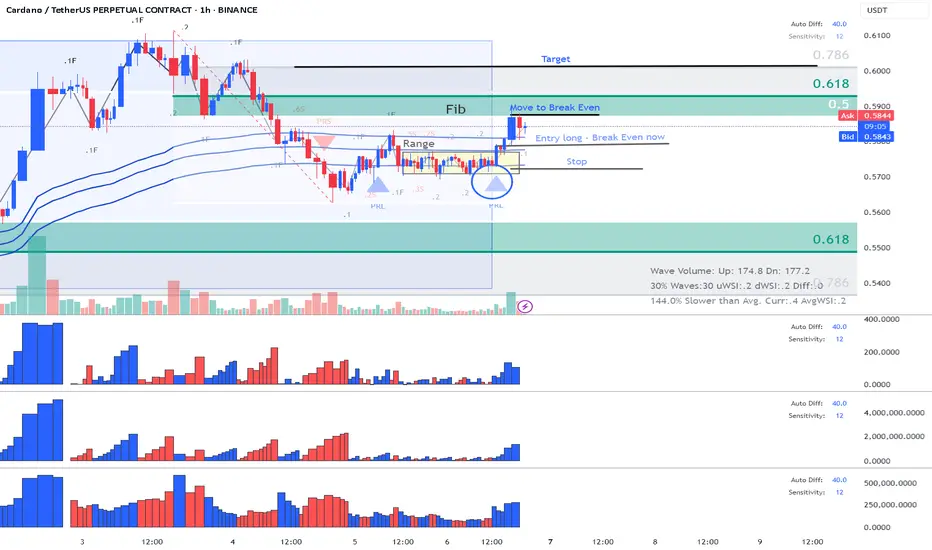
ADA - Cardano - Long - Classic Exit from Range with PRLThis is one of my classic trading strategies called "Exit from Range" with Plutus signal and in this case it was a PRL.
Entered Long on the Exit from range, put my stop and hopping that we might cross Fib. When price reached Fib moved my stop a bit above breakeven to compensate on brokers fees and now we are running a free trade. Currently sellers did show up on the Fib , but let's see who is going to win!
Enjoy!
TRX - Getting Out with a small LossIt seems that some sellers came in before resistance level. I am sure sure about the outcome so I am getting out with a small loss
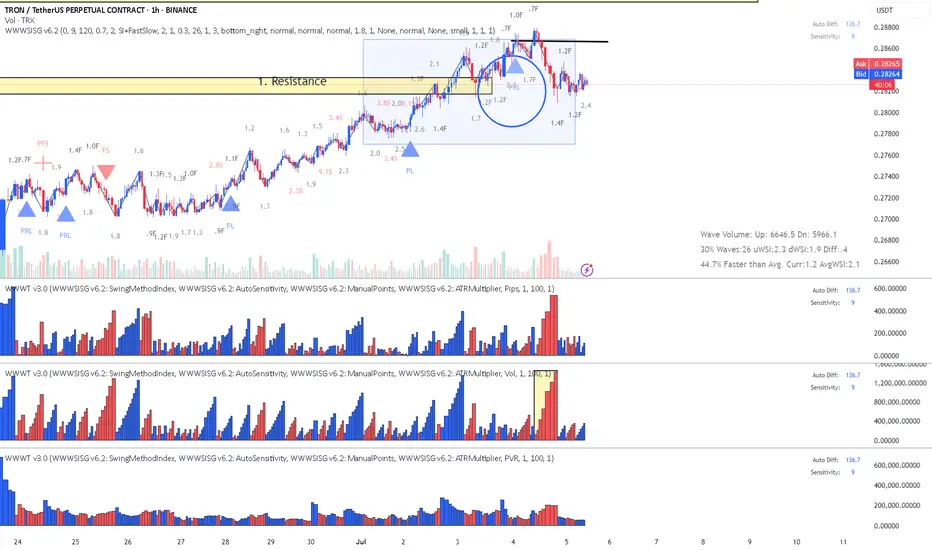
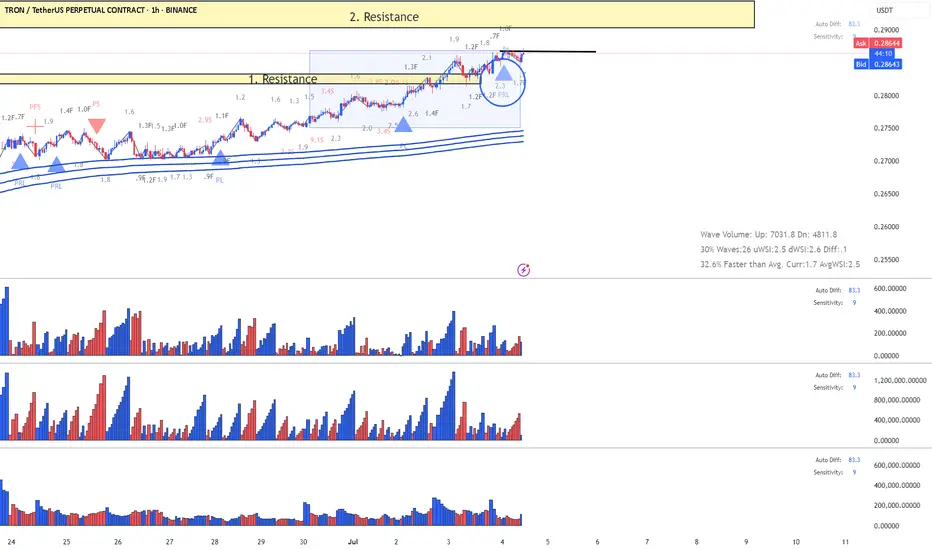
TRX - No weakness yet went Long on PRL signal No obvious signs of weakness on the waves.
Up waves larger than down waves and no abnormal SIs
Therefore I went long after the 1st resistance break on PRL signal, target the 2md resistance.
Enjoy!
XLM Stellar Long Closed on 2nd ResistanceBased on previous entry explanation posts
Trade was closed with nice profit on second resistance which happen to touch it right on US non Farm news.
Enjoy!
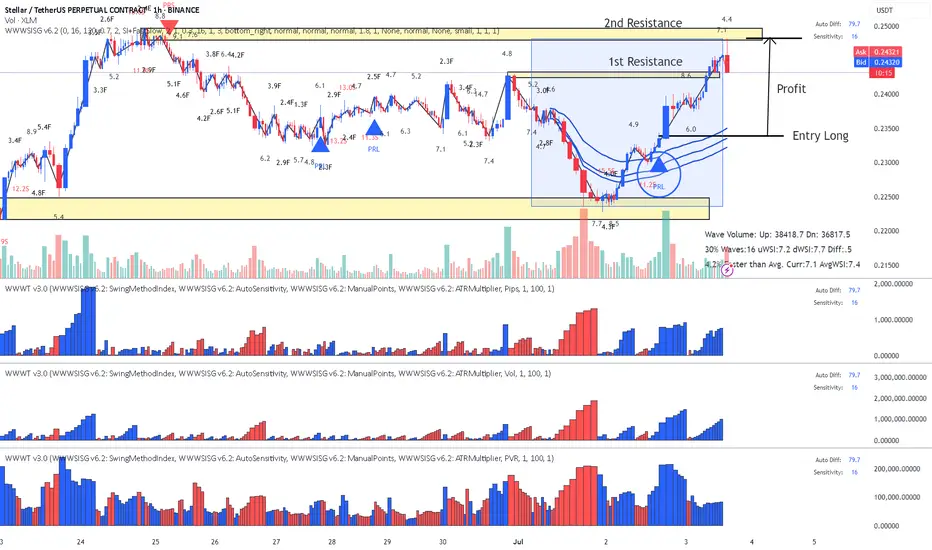
XLM Stellar - Lesson 15 did the jobBased on previous idea explaining the entry Long.
I have moved stop to profit and we have two Resistance levels to surpass or not. According to the details on this levels I will close or let it run.
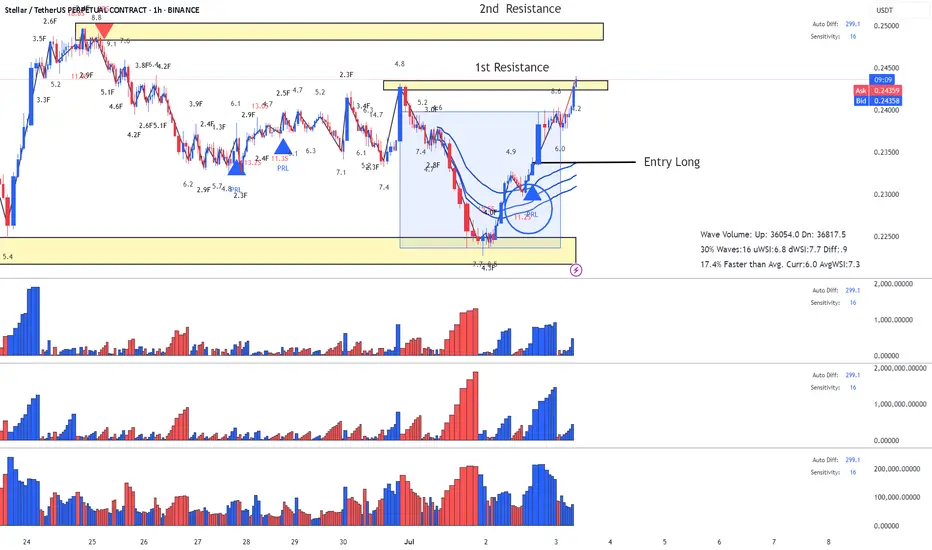
XLM Stellar - Classic Lesson 15 said Long Lesson 15 methodology (annotations in sync with the chart):
1. Support (this where buyers can come in)
2. Largest dn volume wave after a while - Look left - buyers came in previously at the same location.
3. Placed AVWAP and waited for price to cross upwards and pullback again on AVWAP
4. Entry signal PRL with abnormal SI 11.2 (price has a hard time to move down - absorption) after the pullback and that's our entry.
Enjoy!

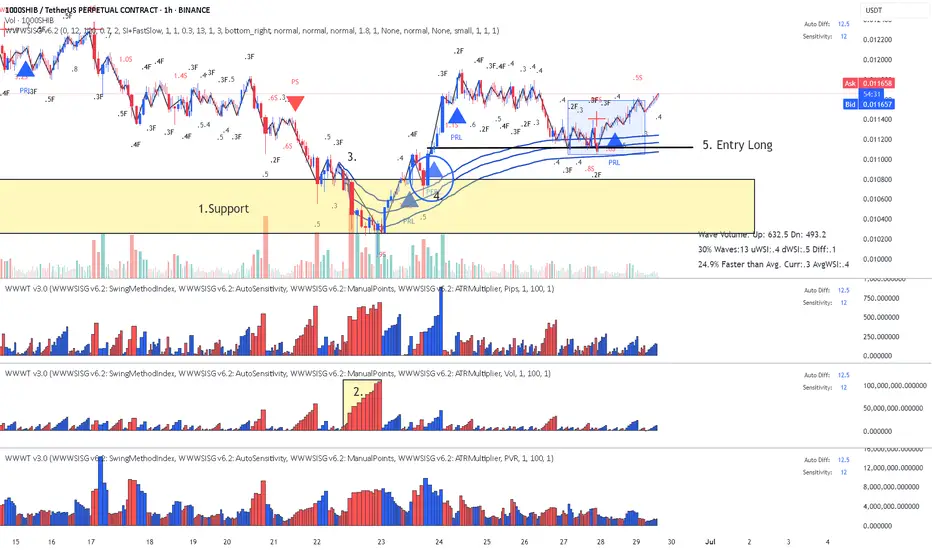
SHIB - Lesson 15 this is how to read the chartUsing Lesson 15 to read the chart (annotations in sync with chart):
1. Support (coming from daily chart)
2. Largest down wave (buyers could be in there)
3. Placed AVWAP wait for the price to cross upwards and pull back
4. PFBL Long signal on the pull back and up we go
Enjoy !
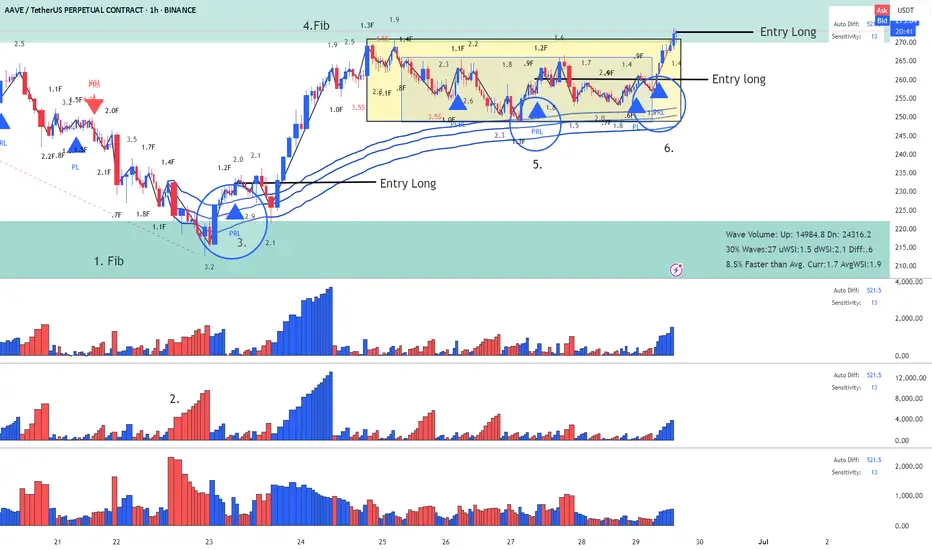
AAVE - Lesson 15 said Long and the pull back another LongReading the chart using Lesson 15 and Exit from Range methodology (annotations in sync with the chart)
1. Fib Location (buyers might enter)
2. Largest down volume wave (potential buyers in there) - Placed AVWAP at the beginning of the down wave wait for price to cross upward and pullback
3. Entry Long with PRL signal - first target fib closed with profit
4. Fib was reached and pull back started
5. PRL long on AVWAP acting a resistance
6. This my last Entry using strategy Exit from Range with a Plutus signal.
This is a risky Long since we are on Fib area, but I will take the risk.
Enjoy!
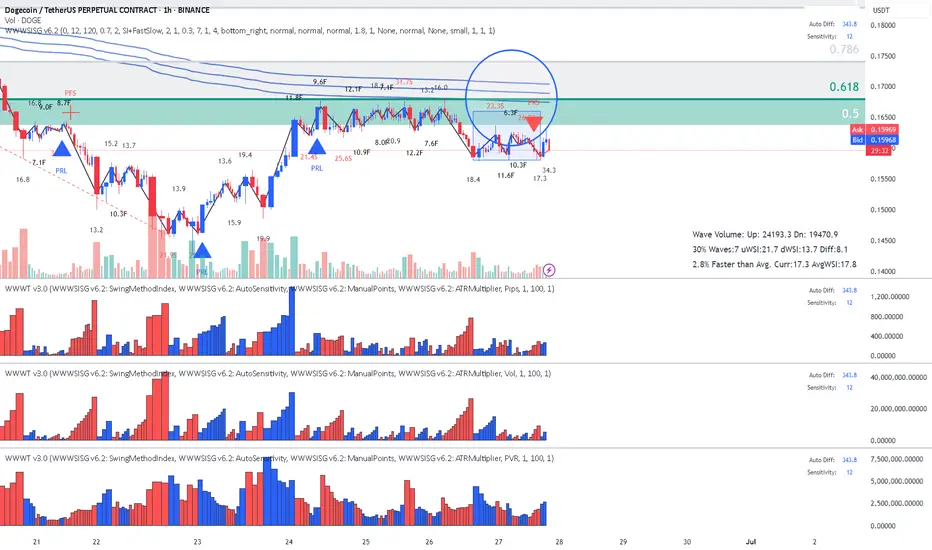
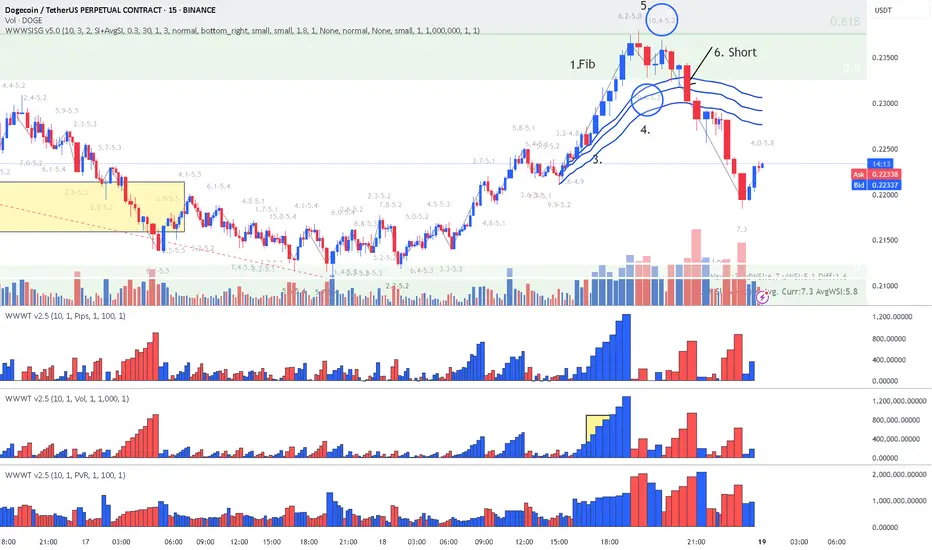
DodgeCoin - Speed Index is telling me ShortReading the chart
1.Location: Fib + touch AVWAP low
2. Speed Index numbers at top on the High side (red numbers) which means Hard to Move Up.
3. PRS Short signal
4. If we do not get stuck into range and break it downwards , it's Short!
Enjoy! Reading the chart with Speed Index!
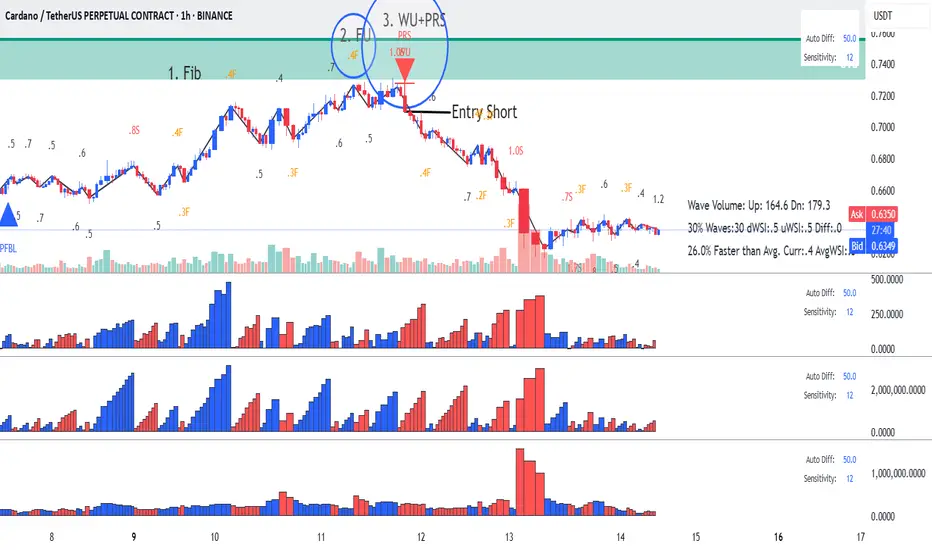
Wyckoff Up-Thrust - This is how to identify using Speed indexClassic Wyckoff Up-Thrust formation, this is how to read it using Speed Index (annotations in sync with the chart):
1. Fib Area - this is where sellers might come in
2. FU - Fast Up wave with SI 0.4F
3. Next up wave with an abnormal SI of 1.0S while the average speed at 0.5, which means price has a hard time to move up (more sellers on the up move). Following the up wave on the down move we have double Short signals WU-Wyckoff Up-Thrust and PRS-Plutus Reversal Short and this where we enter.
I hope this was helpful. Enjoy!
HOW TO:Major Update Weis Wave with Speed Index Signals and TypesThis is an information video about the 6 new features of Weis Wave with Speed Index - Signal v6.0 and Weis Wave - Wave Types v3.0.
These versions will release at end of this week or next week.
Available to answer any of questions that you might have!!!
Enjoy!

ETH- Etherium - Are we getting ready to Short?1. Resistance Level - Triple top (1st one not visible)
2. Abnormal SI at the top 17.8
3. Waiting for a Plutus Short Signal to Enter
Enjoy!

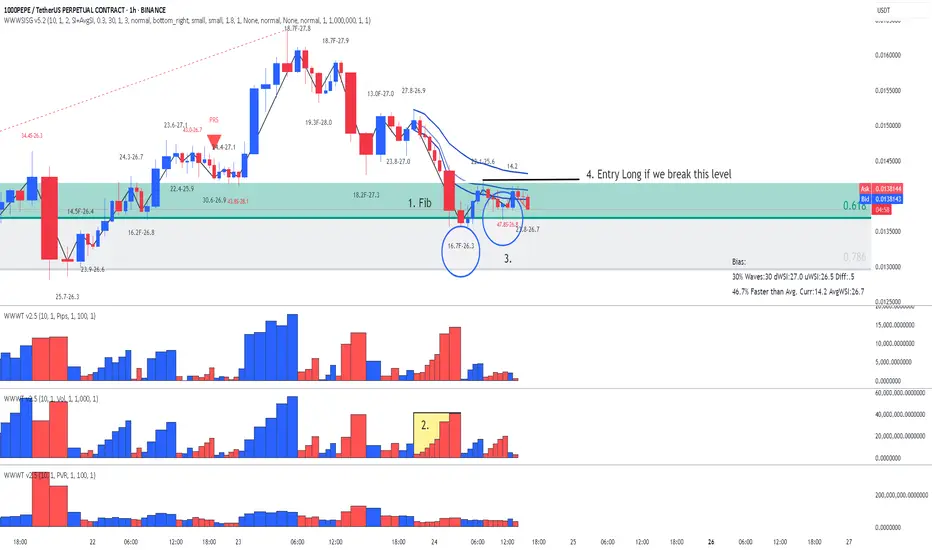
PEPE - Trade is on the way - Reading Speed IndexChart reading using price location, volumes and Speed Index:
1. We are on Fib (buyers could enter here)
2. Fast down wave on the way to Fib with SI at 16.7 while the average was 26.3
3. Next down wave it's a very slow wave and it look like an HTMD (hard to move down) with a very high Speed Index of 47.8 while the average was 26.8 (probable buyers absorbing sell orders). This is change in Behavior , but in order to confirm the reading it would nice be for the forming down wave to finish with a high Speed Index.
4. AVWAP blue lines act as resistance. Finally to enter long we need price to break resistance level marked with the black line, otherwise we might get stuck into a range and you never know what's going to happen next.
Patience! Enjoy!
LiteCoin-LTC Lesson 15 said Long - This is why!Lesson 15 Methodology chart reading:
1. Fib Location (buyers might enter here)
2. Largest down volume wave (buyers could be in there) with increasing PVR
3. Placed AVWAP at the beginning of the down wave and wait for price to cross upwards, wait for a pull back and a Plutus Long on the pull back.
4. Entry Long on the PRL signal.
Enjoy!

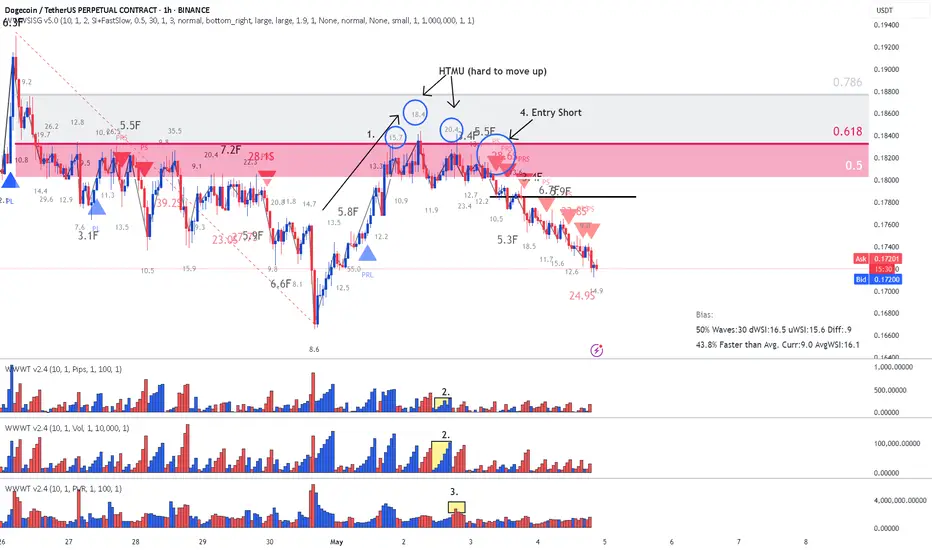
How to read Speed Index and Identify Potential Reversals!In this chart we removed all Plutus signals and we are reading just Speed Index and weighted Averaged Speed Index. The purpose is to identify a potential reversal at a significant location such as Fib.
There are two numbers visible on every price wave swing, the first one is the wave's Speed Index and the second one is the weighted average Speed Index of the 30 waves back.
What do we need to identify for a potential reversal? The answer is Abnormal Speed Index compared to the weighted average Speed Index, which means that something is cooking.
Reading the chart:
- Look at highest volume up wave hitting the Fib area, Speed Index at 6.2 while the average at 5.0 , higher than the average but not too abnormal.
- The next down wave is where it gives you an Abnormal Speed Index of 10.4 with an average of 5.2. This is what we call their first Push Down, now definitely something is cooking.
- The next up wave has a Speed Index 10.4 (Abnormal) with an average of 5.2 and that's we call a Hard to Move Up Wave (HTMU).(by coincidence these two waves have the Speed Index and average Speed Index)
- Finally to make sure that all these were sellers we need price to break these waves.
To Summarize this is how we approach this Short trade (annotations are in sync with chart).
1. Fib Location (potential sellers might enter)
2. The highest volume up wave to get to Fib
3. Placed AVWAP at the beginning of this up wave, because we will go short if price goes below AVWAP with the appropriate Speed Index justification.
4. First Push Down wave with SI 10.4 with AvgSI at 5.2
5. HTMU (Hard to Move Up) wave with SI 10.4 with AvgSI at 5.2
6. Our entry Short breaking the structure of the previous waves and cross AVWAP downwards.
I hope this helps all you Weis Wave Speed Index owners. Enjoy!!!
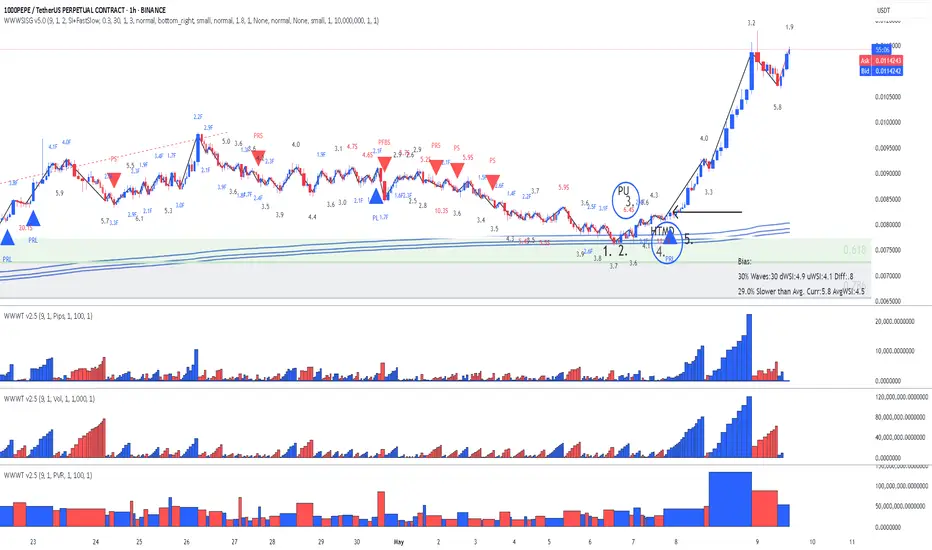
PEPE - This is why price explode - Speed Index ReadingThere is always a reason why price explodes either true or fake. The criteria to look at are:
- Location - very important - where is the price locate - higher probability trades accomplished when the price leaves a significant location such us Fib, Sup/Res, AVWAP
- The volume waves - nothing moves without volume - sometimes is not so visible by the volume waves alone because they distribute or accumulate little by little, that's why we have Speed Index
- Reading Speed Index
- The proper entry signal
In the attached chart I will demonstrate how I read it using the above criteria (annotations are in sync with the chart):
1. Price entering Fib Area 50-61.8 - possibility of buyers to come in
2. Price touching AVWAP (three blue lines) coming from the bottom of a previous swing acting as resistance - another possibility of buyers to come in.
3. Speed Index 6.4, that's an abnormal speed index , that what I call first push up or PU, price never drops below the beginning of this wave
4. Speed Index 11.1, that's another abnormal speed index and that's what I call a hard to move down (HTMD) . What's happening here is that all the sell orders are absorbed by buy orders and price breaks on the up wave the origin of the HTMD wave.
5. Finally the entry Long with a PRL (Plutus Reversal Long) signal an up,up,up, we go!!!
I hope my years of work helps you out on reading charts!
Enjoy!
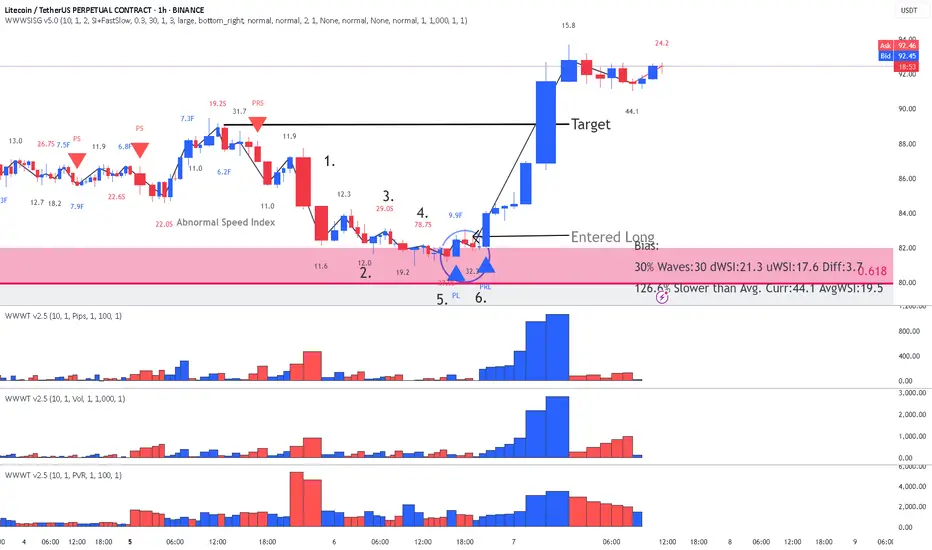
LTC Long - Learn to read Weis Wave with SI- Target hit overnightLearning to read the chart using Weis Wave with Speed Index will help you understand how the market works. Speed Index is very valuable to understand if there is absorption happening in the market. Remember that absorption takes time, it takes hours or sometimes days, so you have to be patient. In this chart I will explain how to read this 1HR LTC chart using Speed Index and why we had this explosion in price. I have entered long (my target was hit overnight). Annotations on chart are in sync with my below notes.
Reading:
1. We had a high volume down move (buyers could be in there but I am not sure yet)
2. We have touched 50-61.8 Fib area - If buyers would like to enter this is a great area.
3. Speed Index 29 that's an Abnormal Speed Index. Why is it abnormal? Because at that time the average Speed Index of 30 waves back was 15. I call this as the first Push or the first absorption. Buyers are entering.
4. Speed Index 78.7 another abnormal SI -> more buying
5. Speed Index 37 on a down wave that's what I call a HTMD (Hard to move down) more buying and finally a PL (Plutus Long signal) breaking by a bit the previous resistance level. This is where I have Entered Long.
6. Another HTMD , hard to move down wave with Speed Index 32.2, more buying and another Plutus long signal PRL.
Therefore the explosion is completely justified because it has a history of several hours of absorption. If you were to read just volume waves you would not be able to see this coming Speed Index alerts that something is cooking and when the time is right you enter (PL signal)
I hope my above explanations helped you.
Enjoy!
This is how to read the chart using Weis Wave with Speed IndexReading the chart:
1. We have bottom down and we pull back with high up volume waves, approaching the Fib area. Notice how SI is increasing on the up waves as we are reaching Fib from 13.3 to 15.7 to 18.4 and last not able to break previous resistance at 20.4. This means sellers are absorbing all buy orders of people entering long thinking that the trend will continue.
2. Notice the up volume wave with SI 20.4 and respective pip move right above it which is small compared to the amount of volume used - This is absorption.
3. The highest PVR bar at the beginning of the down wave - more sellers
4. Entry Short on the Plutus Short signal
Notice all the Short signals following confirming the continuation of the down move!
Simple as that, if you are able to read the chart and not just following signals from an indicator.
Enjoy!
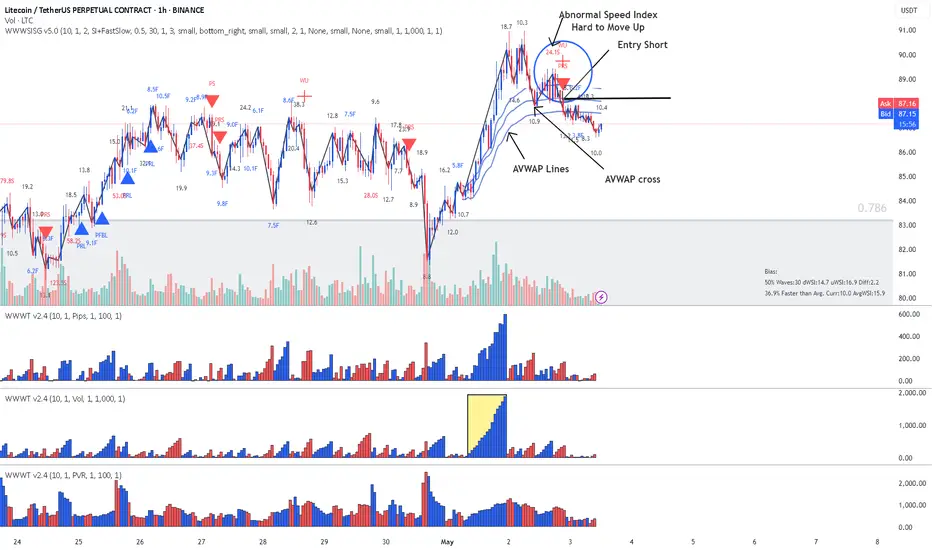
Litecoin (LTC) Lesson 15 said - This is How to Read the ChatLesson 15 Methodology Chart Reading:
1. Highest up volume wave (sellers could be there)
2. Placed AVWAP lines at the beginning of the wave
3. Wait for price to cross downward AVWAP line
4. Pull back with an Abnormal Speed Index of 24.1S , that's a hard to move up, meaning sellers are absorbing on the up move
5. Enter Short on a Plutus signal which in this case is a double signal WS (Wyckoff Spring) and PRS (Plutus Reversal Short)
Enjoy!!!
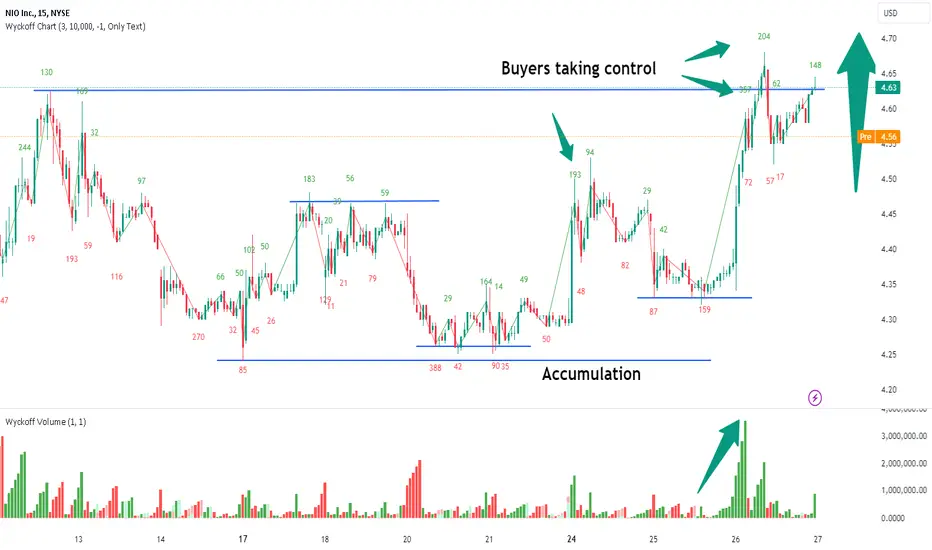
Wyckoff Bullish Patterns - Accumulation (strong buyers action)VolumeDayTrader offers script of such indicators on TradingView. For more details check our profile or DM us.
Weis Wave is an advanced trading indicator used to identify bullish and bearish patterns in the market. It is based on Richard D. Wyckoff's methodologies and is typically used to analyze volume and price action. Here's how to recognize and understand bullish patterns using Weis Wave:
Key Concepts of Weis Wave
Wave Volume: This is the cumulative volume of each price wave. It helps to identify the strength of buying or selling pressure.
Price Waves: These are the movements in price, which can be upward or downward.
Recognizing Bullish Patterns
Rising Volume on Upwaves: When the volume increases on upward price waves, it suggests strong buying interest. This is a bullish signal as it indicates accumulation.
Decreasing Volume on Downwaves: When the volume decreases on downward price waves, it indicates weak selling pressure. This is also a bullish sign as it shows that sellers are not aggressive.
Higher Highs and Higher Lows: In a bullish pattern, each successive upwave will typically make a higher high, and each downwave will make a higher low. This reflects a strong uptrend.
Support and Resistance Levels: Pay attention to how the price reacts around key support and resistance levels. A bullish pattern often sees the price breaking through resistance levels with strong volume.
Example of Bullish Patterns
Accumulation Phase: This phase is characterized by a series of higher lows and higher highs, with increasing volume on upwaves. It suggests that smart money is accumulating shares.
Breakout with Volume: A significant bullish signal is when the price breaks above a resistance level with a large increase in volume. This confirms that buyers are in control.
Pullback with Low Volume: After a breakout, a minor pullback or consolidation with low volume is often seen. This is typically a continuation pattern indicating that the uptrend is likely to resume.
Using Weis Wave for Confirmation
Combine with Other Indicators: Use the Weis Wave in conjunction with other technical indicators like Moving Averages, RSI, or MACD to confirm bullish patterns.
Volume Clusters: Look for clusters of high volume on upwaves at key price levels to confirm bullish strength.
By analyzing these aspects, you can effectively use the Weis Wave to identify and trade bullish patterns in the market. Would you like more detailed examples or further explanation on any specific aspect of the Weis Wave?
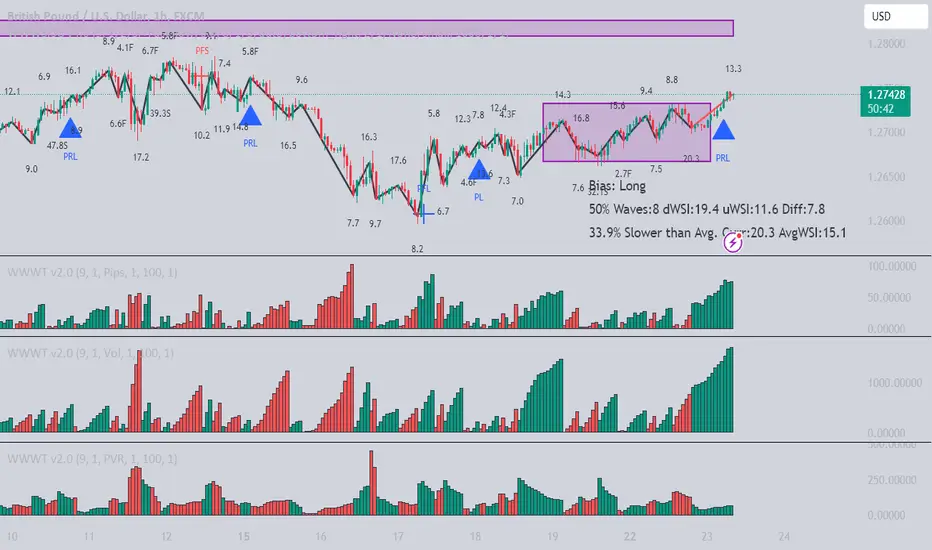
GBPUSD - Let's get to that Resistance Level - Long 60 pips targeSimple story:
First of all this is classic entry as TTVW says - Exit from range with PRL
The rest of the story
Green waves larger than red waves
Speed Index on the high side at the pullback = Hard to move done (Effort vs Result)
No funny stuff at the top yet
Therefore we should be heading for the resistance level approximately 60 pips