Weighted Basket of 5 Agri Commoditeis - Hyperinflation Coming*EDIT in text quote on left of chart - *Synchronicity in between
I have created an equally weighted portfolio of 5 sustenance based commodities including Soybean, Soybean Oil, Sugar, Wheat, and Maize (continuous fwd contracts). This is an update to the first chart I have published (rough rice) which isn't updating for some reason but if you see the RR1! graph on another website you will see that my analysis is 100% on point so far and even identifies exact msp level prior to breakout. I am expecting sustenance based commodity hyperinflation in the coming years as we enter a macroeconomic environment that the economics textbooks have never described. The money manager commitment data points to breakout, technicals show clear range suppression and evident accumulation pointing to impeding breakout. Global trade statistics are abysmal, statistics of subprime/consumer debt/corporate debt delinquencies are abysmal, PE ratios of leading equity markets are abysmal. I do not wish for this to happen because this will affect billions of people but this is most likely what is going to happen. Best of luck.
Wheat

Wheat LongI still haven't come across any compelling justification to get long besides my technical read. Most fundamentals, crop yields, weather all appear to suggest we go further south but we are now in my buy zone

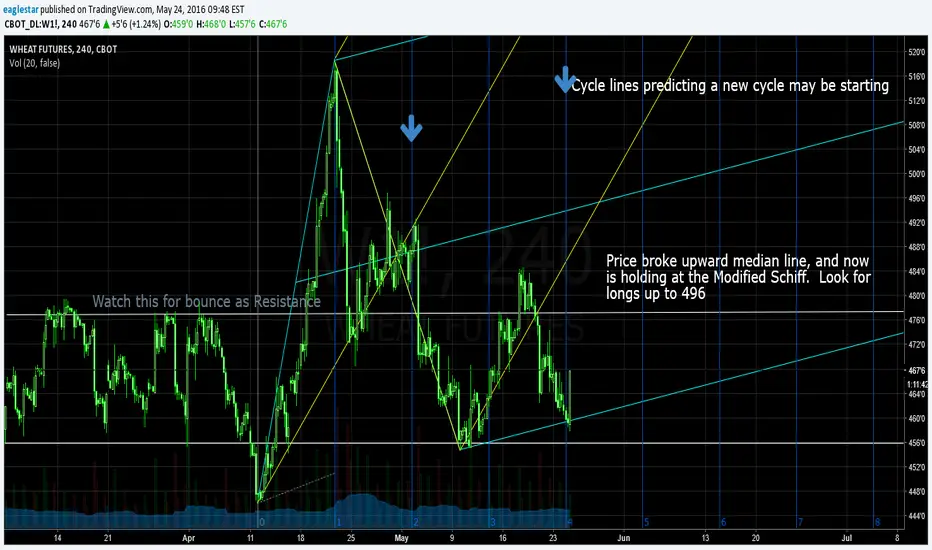
Wheat Futures 240 CBOT Updated 5/24/2016Price broke down, and is testing and holding near lower Median Line on Modified Schiff
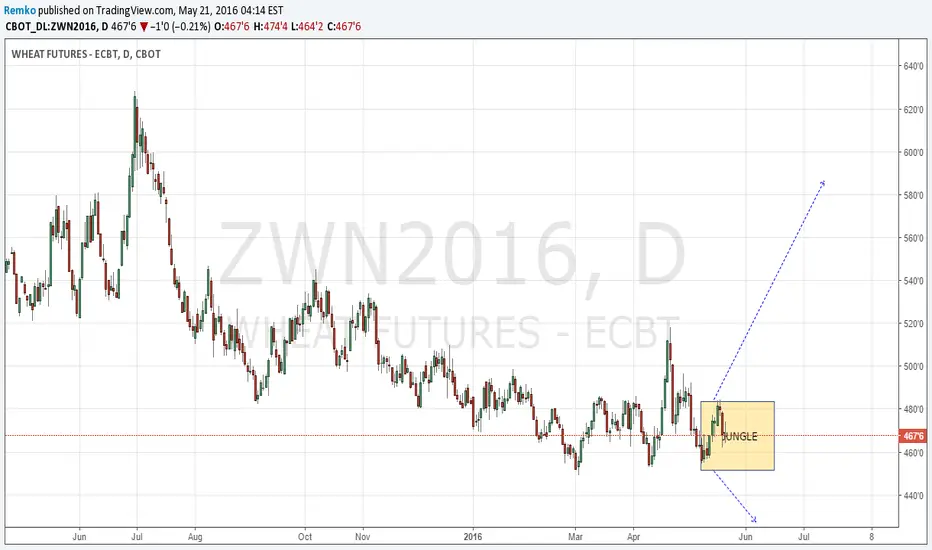
Wheat CBoTWheat:
Nothing much changed in our views on this market. We are still in an area which we see as a jungle from where we see no exit (either up or down) and we want to see that price breaks out of the 450/485 'no-mans-land-zone' before we pick any side. The moves during the past week and, maybe oddly enough, especially during the last 3 sessions start making look us to the upside very carefully but we are still not ready to take a bullish bias unless the 485 breaks.
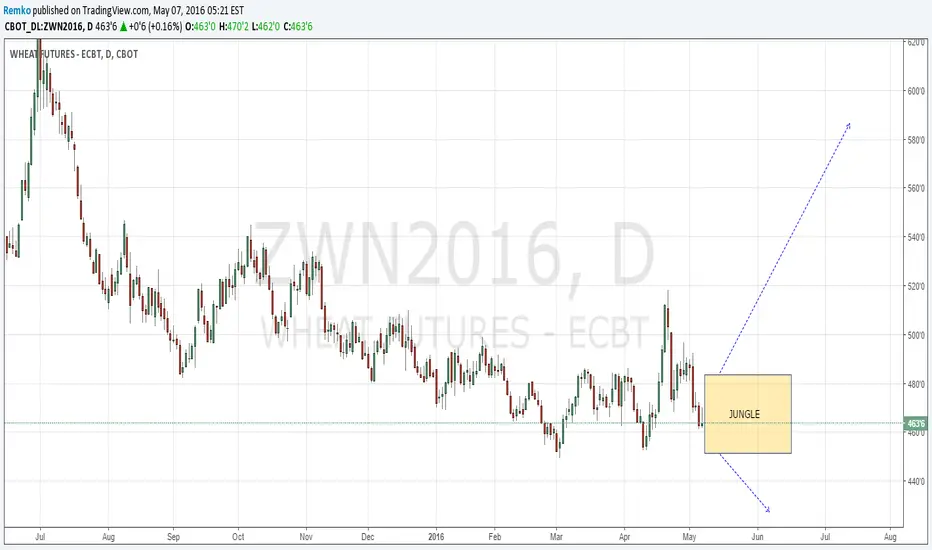
Wheat CBoT N16Wheat:
Price has made a move up during the past week but has not yet left the 'jungle'. No changes from our point of view and we want to see clearer picture first before choosing sides.

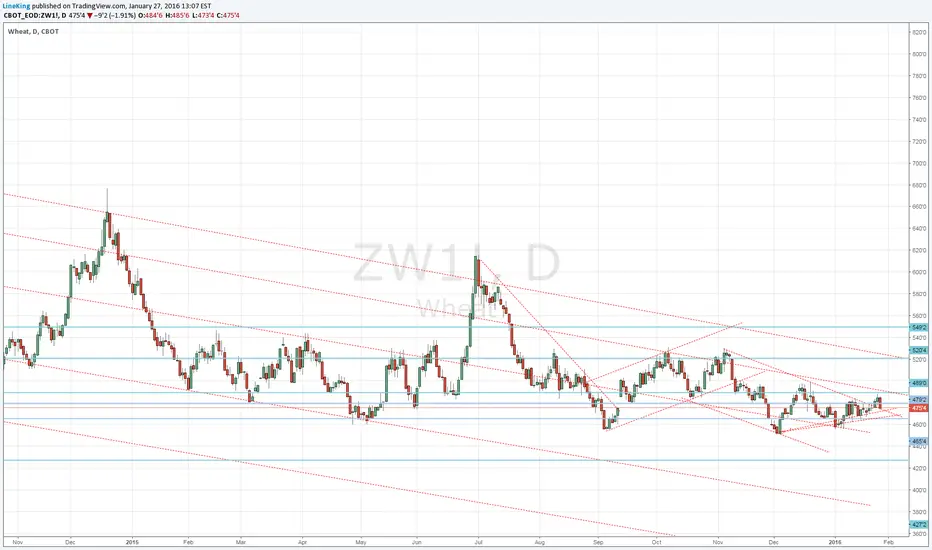
ZW1! - Wheat will trigger bullish sentiment?Fundamentally not much bullish... maybe a mini USD meltdown/correction might provide enough to send all commodities flying?
Strong support around 420-430

Wheat No Play yetPrice did not develop as per our preferred path during last week and broke through the downside of our ascending price channel. This makes us feel less comfortable although the critical supportive level of 450 remains intact for now. However, with the price making a move down last week we will only start feeling more comfortable if price breaks the 480 level and settles above decisively. For now price is rather in an area that is probably best described as 'the jungle from where we do not see the exit' and we should rather hold back for now and see when price gets out of that jungle and, especially, on what side.
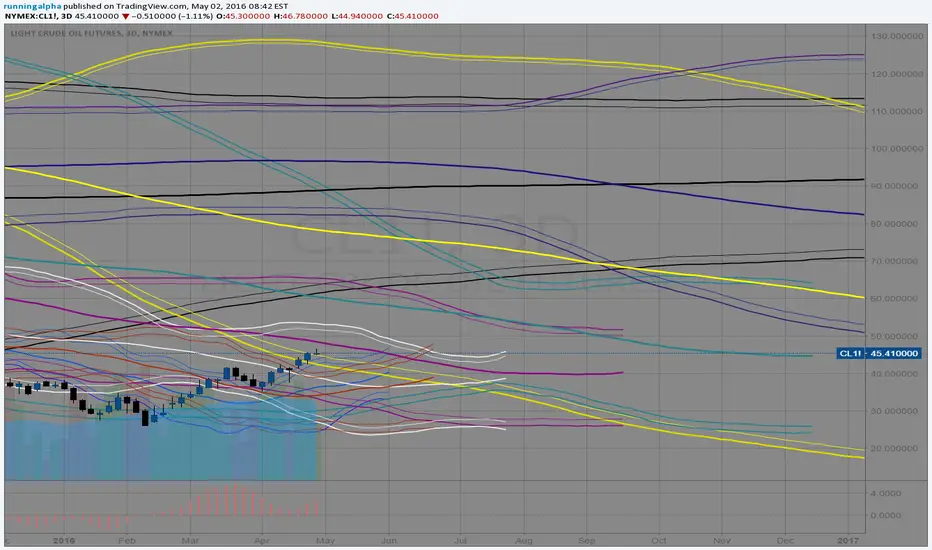
RunningAlpha Upgrades Commodity Markets Update to Priority ListRunningAlpha dot com Capital Markets Intelligence High Priority Update for Monday, May 2nd, 2016
Although $39 and $36.50 remains baseline intermediate to long-term support for Light Crude Oil ( in reference to June Contract Pricing ), the recent advance upwards has opened the door for a further short covering rally upwards to $62 to $65, and perhaps $74 to $76 levels if on a spike. Bullish window for buying on dips extends into at least June period -- this also applies to Brent Crude. Russian Stock Market ( $RSX ) looks bullish during this period. Oil and Gas Drilling stocks will likely continue higher on balance -- particularly a core position in stocks like $PBR.A would be sensible, which should also benefit from a continued bullish run in Brazilian Equities ( which I expect Brazilian equities should trend higher into the summer, and again later in the fall to close out the year much higher ). Among many other equities in Latin America, $ARCO and $KOF also have a strong bullish bias with sentiment conviction windows extending into foreseeable future.
Other Commodity Markets showing very significant sentiment strength going forward are in the Agricultural complex -- Soybean, particularly Soybean Meal $SOYB, Rice, Corn $CORN, Cotton $BAL and Coffee ( $JO is ETF -- when above $18.02 and especially when trading above above $19.00, then $27 is interim target ), and even wheat to some degree. Equities that would benefit from a rise in these commodity markets should have a tail-wind. Silver and Gold stocks, which RunningAlpha.com has been bullish on for a few months now, still shows signs of strength on pullbacks. Sourced from premium sentiment conviction list on RunningAlpha dot com
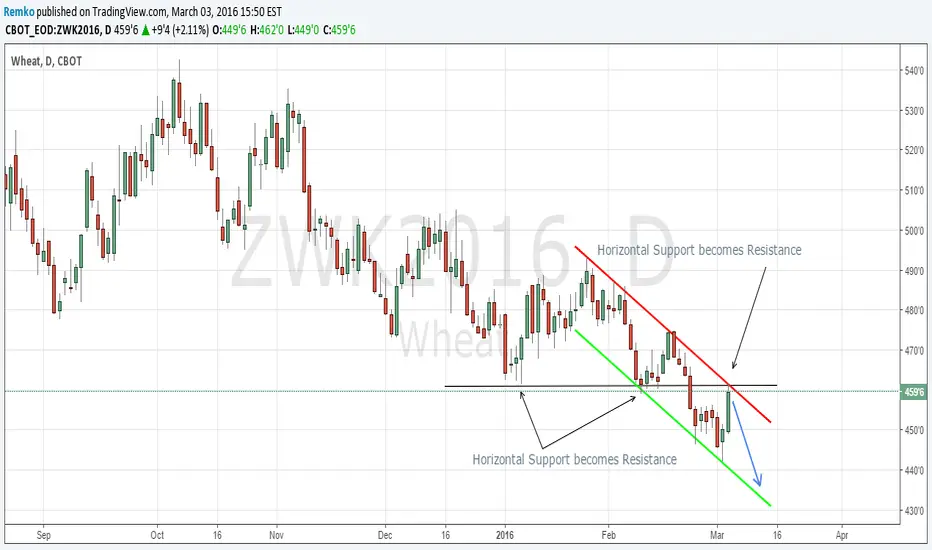
Wheat short play opportunityThe price of CBoT MAY16 wheat develops and interesting short play opportunity here, same although going short in the lower regions usually is not to be recommended.
Price has started to create a descending price range channel during late January with lower highs and lower lows. The candle of March 2 is a bit contradictory in the sense that price made a lower low again but one could classify the shape and position of the candle as a 'Hammer', be it not a perfect one.
Price made a solid move up of some 2% on March 3 which pushed price straight to the upper boundaries of the descending channel where the upper trend-line (in red) coincides with the horizontal (in black) line. This line was support to price during 4-7 January and during 8-12 February but same support was broken quite decisively on February 23. Now the same horizontal line offers resistance to price together with the earlier mention (red) upper trend line of the price channel.
A short play entry is being offered here with stop at 476 basis intra-day or at 466 basis end-of-day. First target 430 which is a 5% swing down from here and where at least half the position will be closed. As soon as there is a bit of profit in the position we trail the stop down to entry level in order to protect our capital.
$WHEAT - Sudden Stratospheric Warming - Don't Fight the Climate ... strong downward trend, which does not intend to end. Perhaps nature itself will do it instead of the market. Sudden Stratospheric Warming is coming. In brief - another attack of deep frost will damage winter $wheat. Chances for now: 65/35
GL!
www.youtube.com
fortune.com


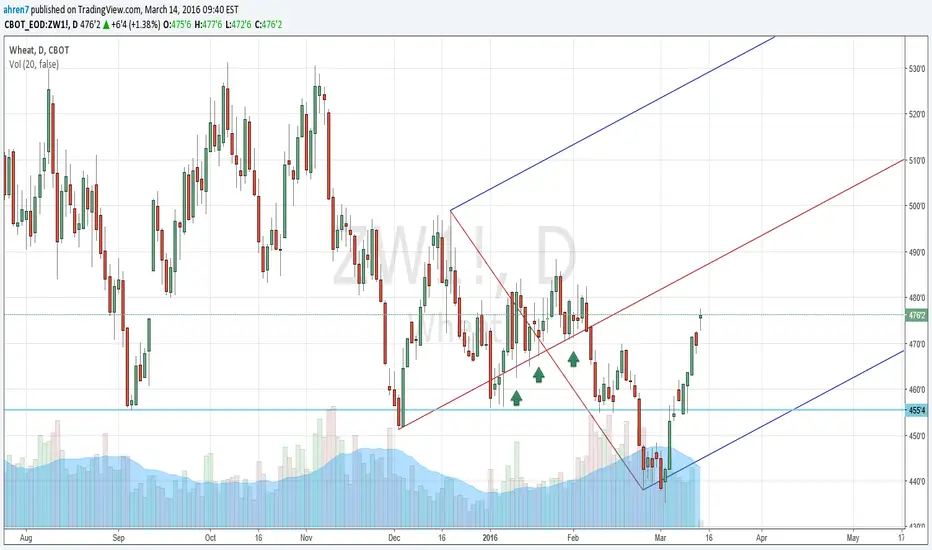
Long Wheat (Mar) - small 476Stop 461.
Looks like the sort of trade I will regret.
Bull-tinted spectacles required
$WHEAT - Complex Head-and-Shoulders Bottom ... imo - on the chart, we see two very rare formations: the triangle where one of the sub-waves is itself a triangle, and complex head & shoulders pattern. In a small triangle - minimum level for the wave e /orange/ is reached.
thepatternsite.com
www.elliottwave.com

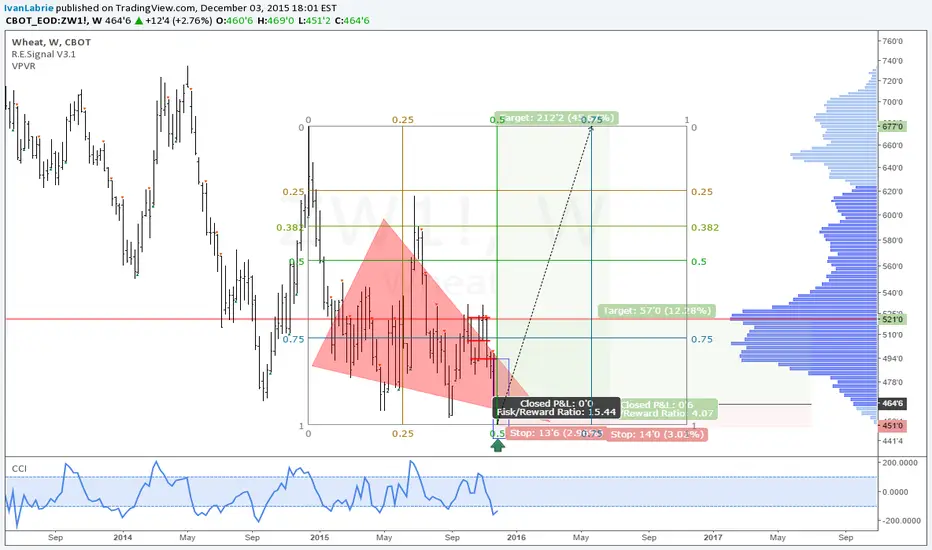
Wheat: Bottoming pattern?The wheat chart has a very interesting and huge terminal triangle in the weekly scale.
You can enter long as depicted on chart, and aim for the high volume node above, or even the start of the terminal triangle if it were to be valid.
As you can see in the related ideas, it's highly probable that the dollar has topped in the long term, and the macroeconomic landscape favors an increase in agricultural commodities.
Good luck,
Ivan Labrie
Wheat - all ags are weakBoth fundamentals (record/near record crop yields), strong U$ and technicals favour continue downside

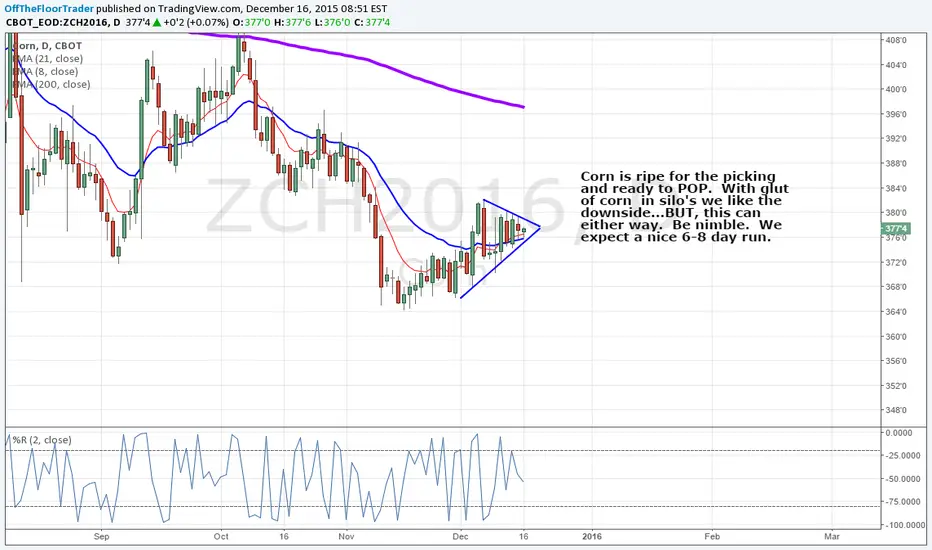
How about some "POP" Corn?Corn is ripe for the picking and ready to POP. With glut of corn in silo's we like the downside...BUT, this can either way. Be nimble. We expect a nice 6-8 day run.
$WHEAT - Expanding Ending DiagonalStill under pressure. We are waiting for seasonal bottom. The postman always rings twice.

Wheat preparing for a shot to the sky again?It's all in place for a new potential turn...
Context
From extreme top to center to extreme low again. And here we are, at the L-MLH (Lower Medianline Parallel).
We had a nice push through the upper ML-H. And so we can expect the same below here (dashed red sliding).
In these higher timeframes we can see very good how price is reacting within a fork, which represents nothing more the a function of Newtons Law (Action/Reaction).
Price Action
A real pressing at the U-MLH of the red downsloping fork.
See the WRB around 2010? This rocket bar gives information...see where the support was later since 2014.
Trade Idea
Potential turn to the north could be within the green zone.
I allways prefere to wait for a sign, like a break of the red U-MLH and take the PB if i have a good stop.
Alltough, here i would take it at the red sliding too, with my stop behind the green lines.
Peace!

$WHEAT - Looking for the bottom.El niño fully active - I expect a harsh winter in Europe / La niña is coming/ and smaller harvest in subsequent years.

CORN DOWNTREND WILL CONTINUE, BUT IT WILL END IF WATER SHORTAGE Both corn and wheat downtrend will continue.
Since Dollar is very strong, agriculture is flourishing, oil is cheap, and is going to get cheaper, Corn and Wheat prices will go lower. There's no shortage of food, and it will continue to be like that in the next period.
Unless something bad happens this summer, in terms of weather, Prices will go lower.
The other possibility of this going higher is due to lack of water in some regions, like California:
www.zerohedge.com
www.zerohedge.com
Lack of water around the world could be possible due to more factors, but I will start with this:
www.zerohedge.com
www.zerohedge.com
www.zerohedge.com
www.zerohedge.com
www.zerohedge.com
Also, glaciers forming more in asia, it has to do with water retreating, possible global freezing, instead of global warming:
www.livescience.com
www.globalresearch.ca
www.globalclimatescam.com
www.thelongview.com.au
dailycaller.com
nextgrandminimum.wordpress.com
iceagenow.info
Also, there appears to be water barons buying all water:
www.bibliotecapleyades.net
www.blacklistednews.com
www.zerohedge.com
Also, why is global warming a pseudoscience:
www.bibliotecapleyades.net
So this means, short now commodities while you still can, and watch out for lower production in the coming years because of lack of water around the world that can trigger lack of food and so, rising prices in all commodities.
If on 1 month chart, highest high for corn is near 850, it can go in the future to 1600, 2000 or more, but that likely in 2 years or more, and that if farmers won't get water.
Short, short term, Long, long term.
Breaking the wedge indicates potential short target of 340, and longer target to 320.
Breaking above 50 day EMA at 370 indicates possible long, and getting out of the wedge and breaking 200 day EMA at 385 indicates longs to unknown potential.
This is ZCN2015 futures on corn chart, same as ZC1! idea.
(Made this idea again because on zcn2015 posting it in forum posts it with chart, unlike zc1!, which is posted with link.)
That is all.

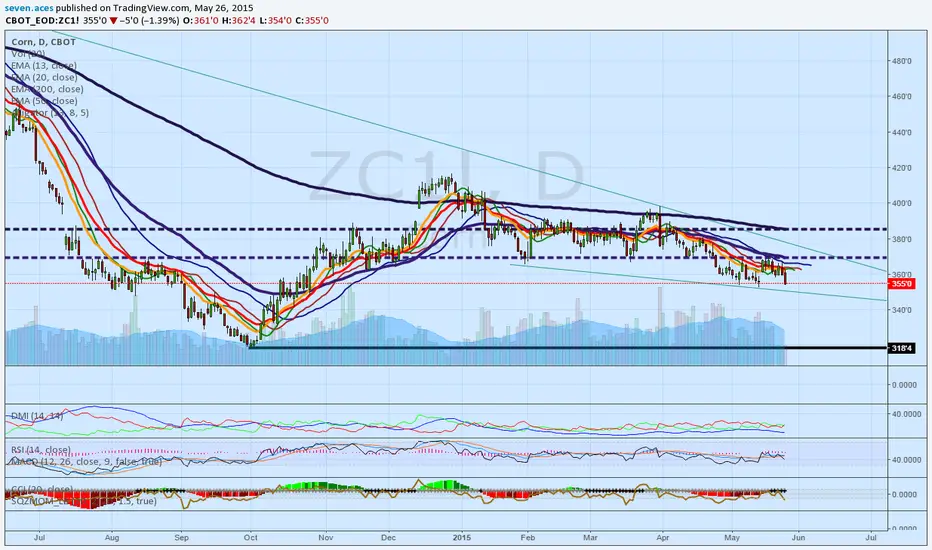
CORN DOWNTREND WILL CONTINUE, BUT IT WILL END IF WATER SHORTAGEBoth corn and wheat downtrend will continue.
Since Dollar is very strong, agriculture is flourishing, oil is cheap, and is going to get cheaper, Corn and Wheat prices will go lower. There's no shortage of food, and it will continue to be like that in the next period.
Unless something bad happens this summer, in terms of weather, Prices will go lower.
The other possibility of this going higher is due to lack of water in some regions, like California:
www.zerohedge.com
www.zerohedge.com
Lack of water around the world could be possible due to more factors, but I will start with this:
www.zerohedge.com
www.zerohedge.com
www.zerohedge.com
www.zerohedge.com
www.zerohedge.com
Also, glaciers forming more in asia, it has to do with water retreating, possible global freezing, instead of global warming:
www.livescience.com
www.globalresearch.ca
www.globalclimatescam.com
www.thelongview.com.au
dailycaller.com
nextgrandminimum.wordpress.com
iceagenow.info
Also, there appears to be water barons buying all water:
www.bibliotecapleyades.net
www.blacklistednews.com
www.zerohedge.com
Also, why is global warming a pseudoscience:
www.bibliotecapleyades.net
So this means, short now commodities while you still can, and watch out for lower production in the coming years because of lack of water around the world that can trigger lack of food and so, rising prices in all commodities.
If on 1 month chart, highest high for corn is near 850, it can go in the future to 1600, 2000 or more, but that likely in 2 years or more, and that if farmers won't get water.
Short, short term, Long, long term.
Breaking the wedge indicates potential short target of 340, and longer target to 320.
Breaking above 50 day EMA at 370 indicates possible long, and getting out of the wedge and breaking 200 day EMA at 385 indicates longs to unknown potential.
That is all.
WHEAT MUST BREAK 535 FOR AN UPTRENDWheat is neither good, nor bad.
Currently, it formed a bullish flag on daily, MACD/RSI convergent with price that is going up.
First, breaking into a new 15 day high, above 530 would mean breaking the small wedge and going up.
Breaking the 200 day EMA at 535$ would make wheat go into an uptrend, all the way to 600.
News:
economictimes.indiatimes.com
Hedge funds are cutting wheat shorts:
www.agrimoney.com
Neutral-long for wheat.
If 535 isn't broken in 2 weeks, price will likely go down.
