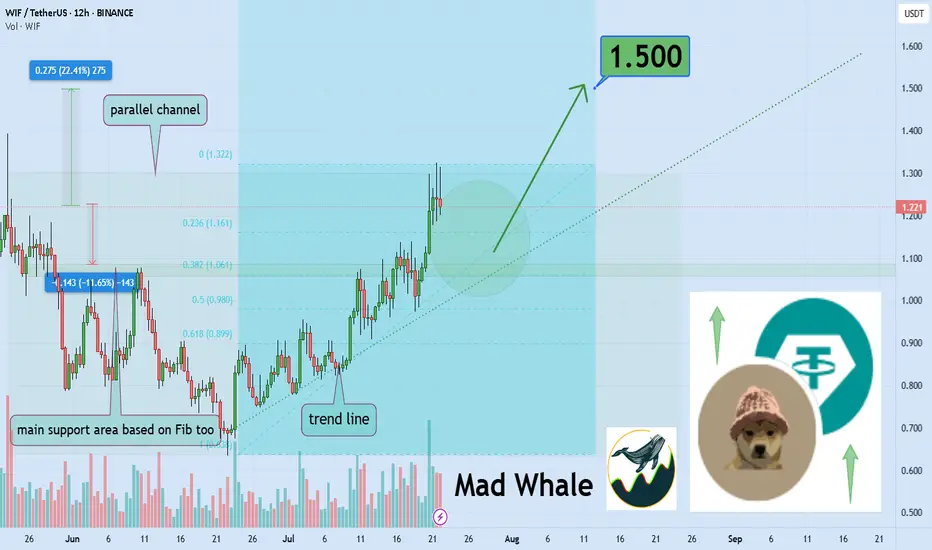
Dogwifhat Poised For 22% Growth Toward $1.50Hello✌
Let’s analyze Dogwifhat’s upcoming price potential 📈.
📈 BINANCE:WIFUSDT is currently sitting near a strong daily support and trendline. At the same time, the Fibonacci Level support lines up closely with this key level. This convergence suggests a potential upside of about 22%, aiming for a target price of $1.50. 🔥
✨We put love into every post!
Your support inspires us 💛 Drop a comment we’d love to hear from you! Thanks , Mad Whale
Wiflong
WIF WIF - He is back!WIF looks good for a straight move and mostly due to hype of liq hunting hahhahahaa
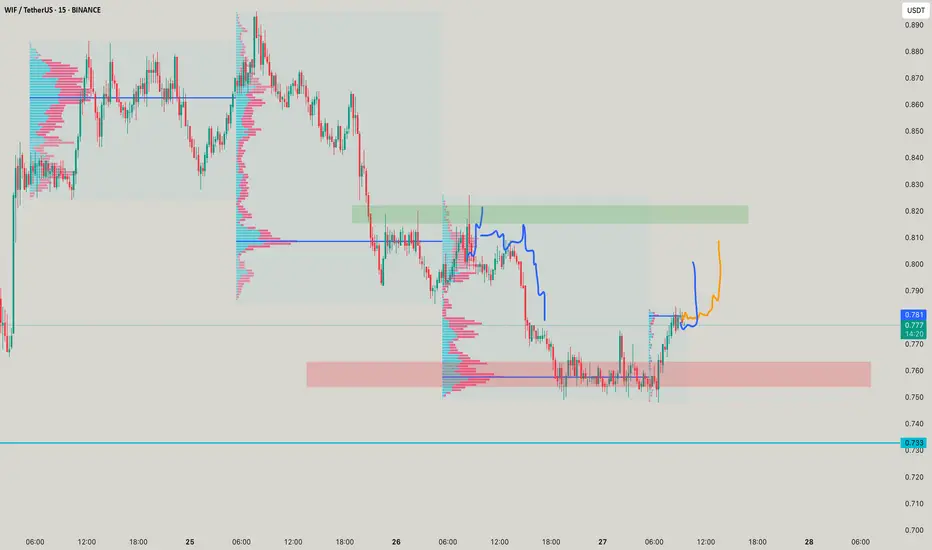
WIF /USDT Long SL -14.12%WIF/USDT Long Setup ( Retake )
Reason:
Breakout and Confirmation done in Internal Structure.
Strong Bullish bullish momentum with high Volume.
All technical Parameters suggesting a strong Bullish Wave.
After Successfully breakout from wedge, we can Expect a 40% bullish wave.
Pro Tips:
After Target 2, Move Stoploss to breakeven
HODL
Best Regards,
The Panda
BINANCE:WIFUSDT
MEXC:WIFUSDT
BINANCE:WIFUSDT.P
KUCOIN:WIFUSDT
BITGET:WIFUSDT.P
BINGX:WIFUSDT.P
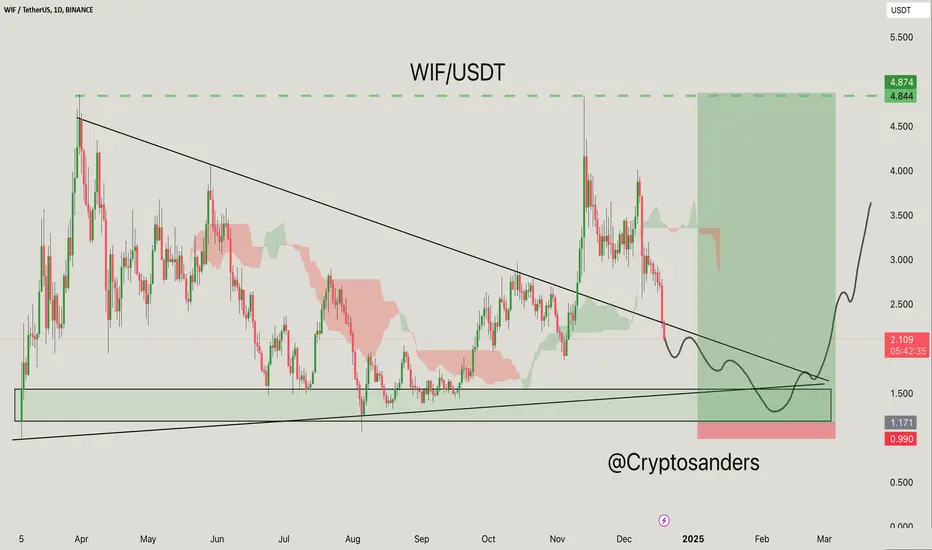
WIF/USDT Chart Analysis. The chart of WIF/USDT shows a potentially bullish setup based on technical analysis.
Descending Triangle Breakout:
The price seems to be approaching the end of the descending triangle, with a potential breakout area of around $2.50.
Support Area:
A significant green area below the current price suggests strong historical support between $0.99 and $1.17.
Ichimoku Cloud:
The behavior of the cloud suggests a transition point, indicating potential bullish momentum if the price breaks above the cloud resistance.
The upward-moving green box shows the long target area of $4.84 to $4.87.
The curve drawn on the chart suggests that the price may fall slightly to the support area before reversing sharply.
Trade Setup:
Entry: Consider buying near the $1.17 support level.
Stop-loss: Place it slightly below $0.99 to manage risk.
Target: Aim at $4.87, which provides a favorable risk-to-profit ratio.
DYOR, NFA
@Peter_CSAdmin
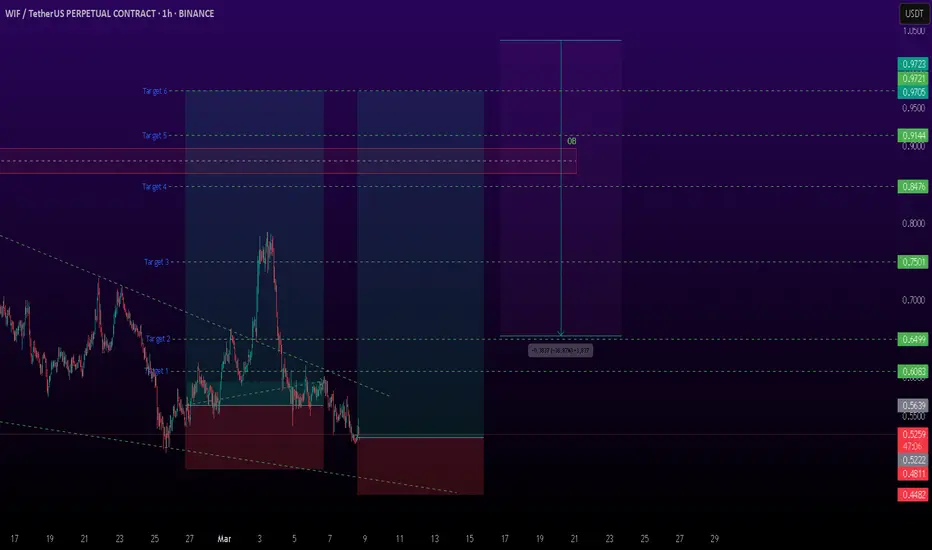
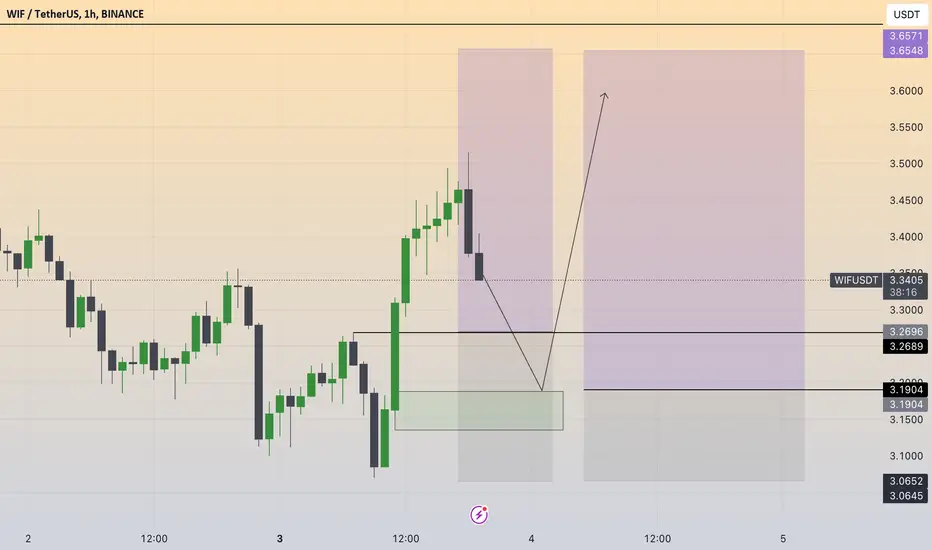
WIF - Good opportunity for LONG (Re-entry)Very good shopping site, this can go up a lot soon. We are in excellent support.
T1: 3.15
T2: 3.50
T3: 3.95 - 4
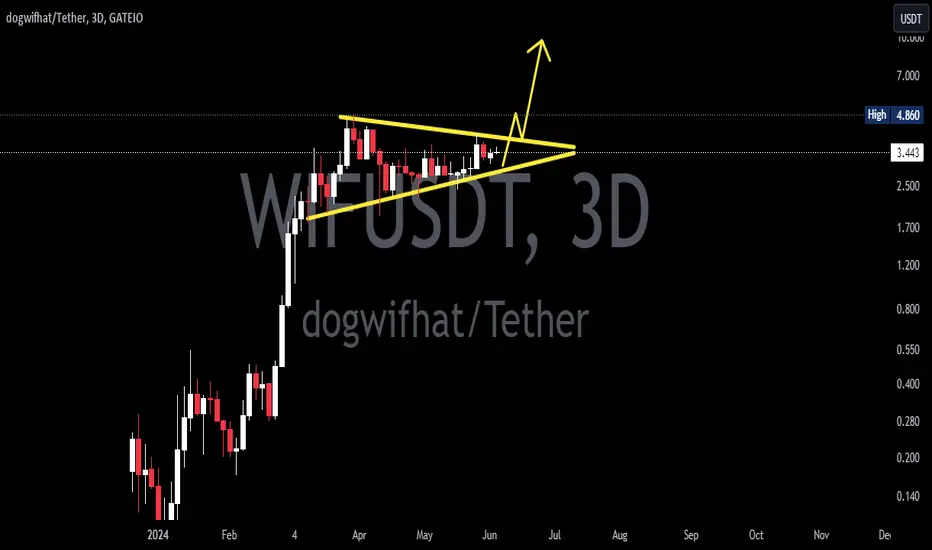
WIFUSD 3DWIF ~ 3D
#WIF Accumulation is occurring within this pattern.
Make purchases gradually in this pattern, with a minimum target of 20%++
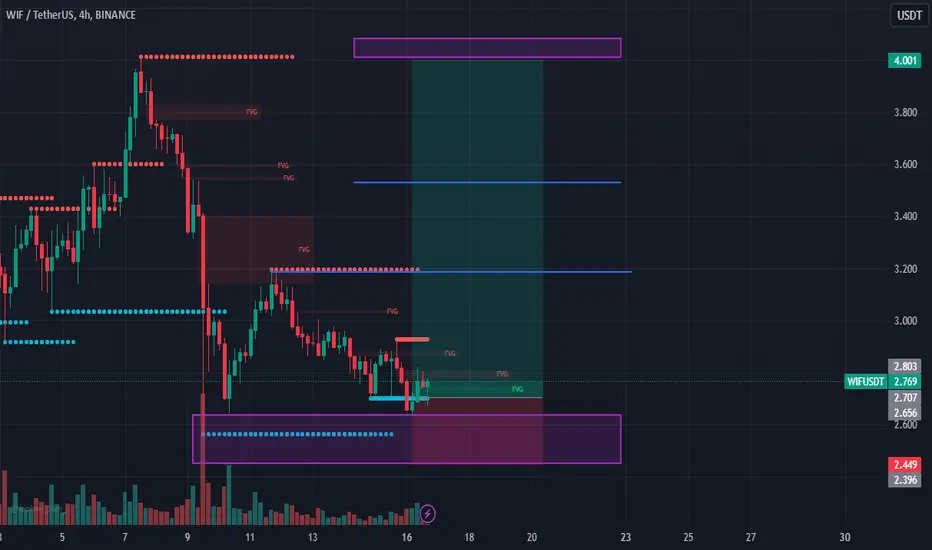
WIF 1Hr Long Scalp Day Trade Clear Break of structure on 1hr chart.
Just jump into it and enjoy the ride.
Do not forget to follow to share.
Manage RISK Pls.
WIF/USDT 4HOUR CHART UPDATE !!Hello friends, welcome to this WIF/USDT update from Crypto Sanders.
Chart Analysis:- Hello friends, what do you think after seeing the chart? Please comment on the WIF/USDT 4-HOUR update.
Currently, WIF is traversing within the confines of a symmetrical triangle pattern. Recent price action indicates rejection from the resistance trendline, where both the MA 100 and the Ichimoku cloud have acted as formidable barriers. The Relative Strength Index (RSI) is positioned within the neutral zone, signaling a state of equilibrium between buying and selling pressures. As the price oscillates within this geometric formation, investors and traders are advised to exercise patience and await a decisive breakout or breakdown of the triangle, as this will confirm WIF's next directional move.
I have tried to bring the best possible results in this chart.
If you like it, hit the like button and share your charts in the comments section.
Thank you.
