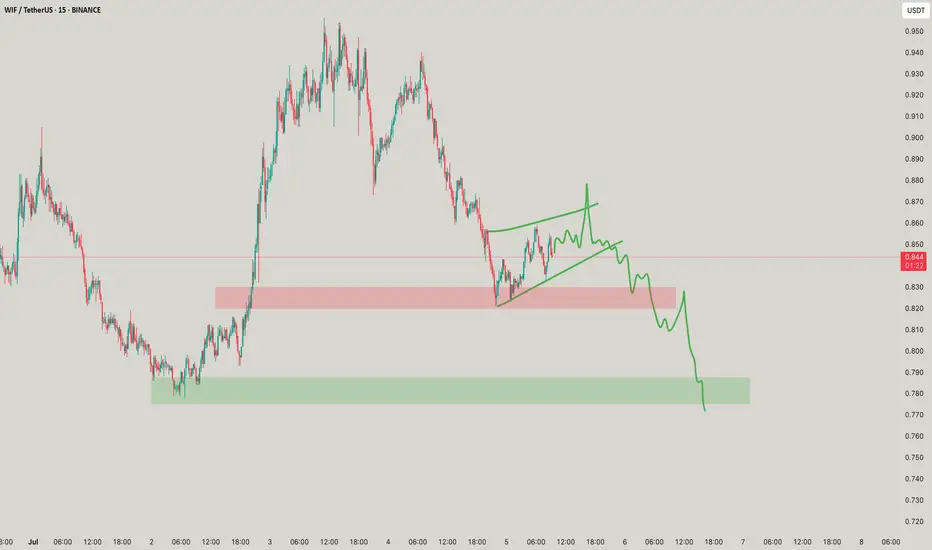
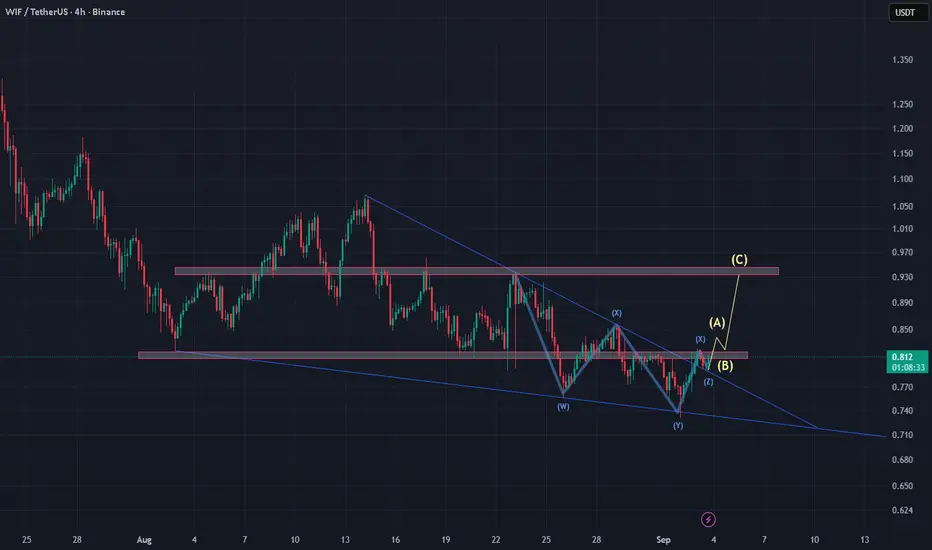
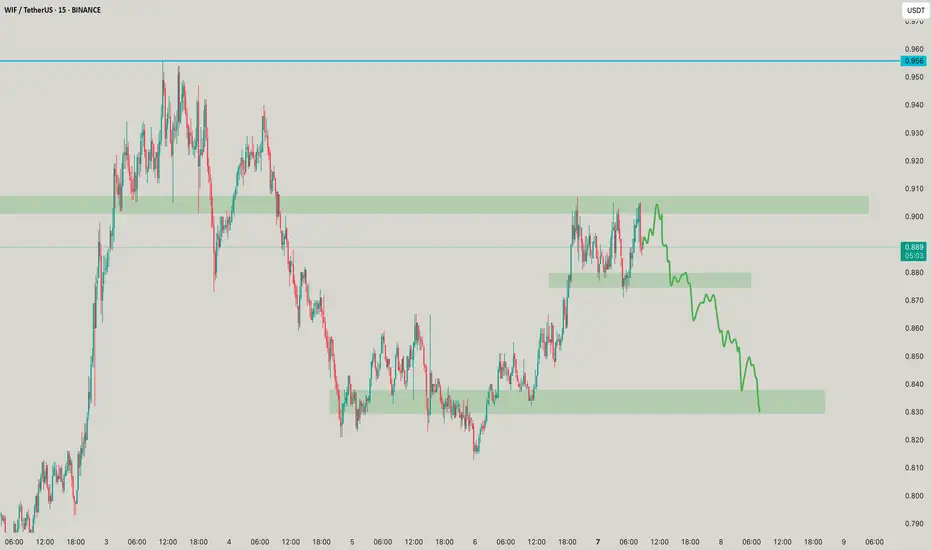
WIF/USDT Technical UpdateBINANCE:WIFUSDT has successfully broken out of the falling wedge 📉➡️📈 and has already completed a clean retest of the breakout zone ✅.
Currently price action is forming a potential ABC corrective wave structure (Elliott Wave count), with:
🅰️ Wave (A) aiming toward the 0.84–0.85 resistance zone
🅱️ Wave (B) likely testing support around the breakout area (~0.80)
🅾️ Wave (C) targeting the major resistance zone at 0.93–0.94
Key confluences:
✨ Bullish market structure shift after wedge breakout
✨ Support-turned-resistance flip successfully tested
✨ Momentum favors the upside if BTC continues bullish momentum 🟢
📌 Watch out for BTC’s move — if BTC pumps, WIF has a high probability to continue rallying toward 0.93–0.94 🎯
⚠️ Invalid below 0.78 support zone
WIFUSDT
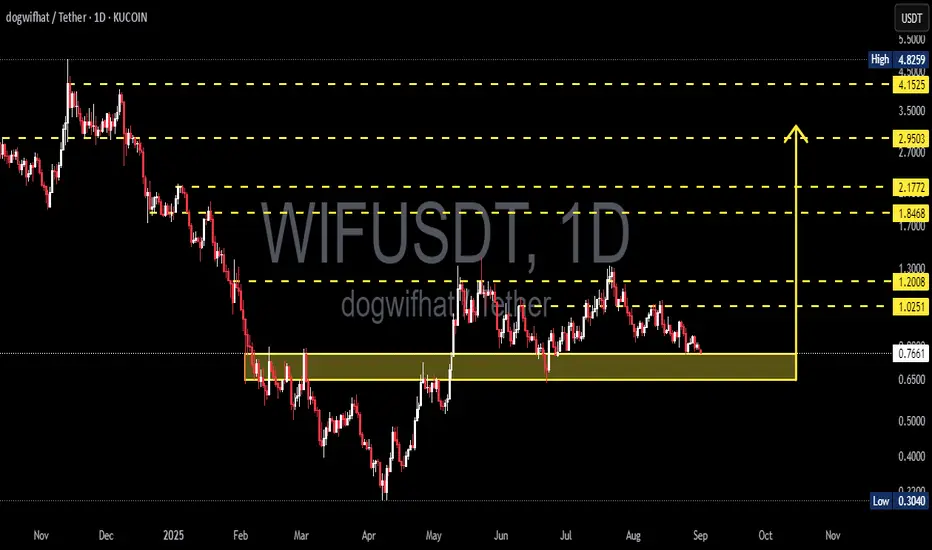
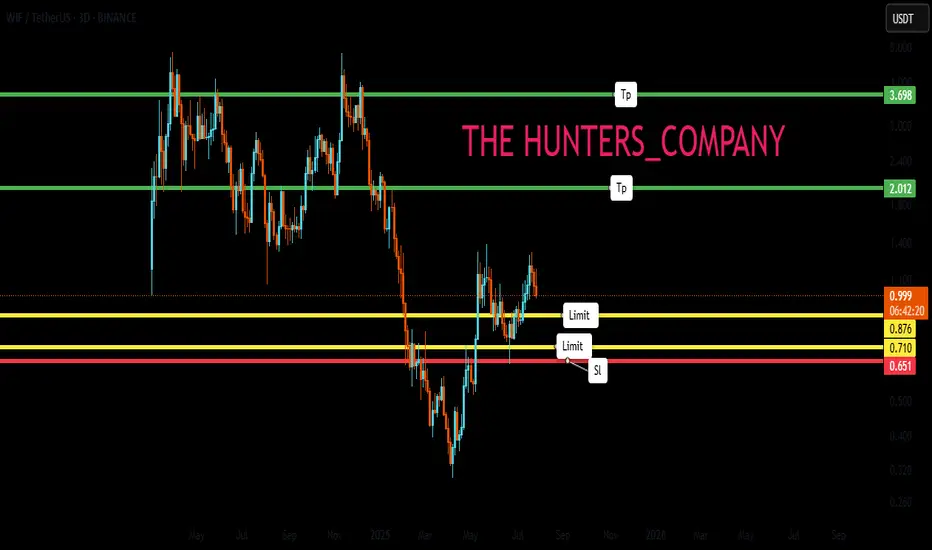
WIFUSDT — Critical Demand Zone: Bounce or Breakdown?Currently, WIFUSDT is trading around 0.7605 and retesting the major demand zone (~0.62 – 0.78) — a level that previously acted as strong resistance before flipping into support.
The price action here will determine the medium-term direction:
Either a bullish reversal fueled by accumulation,
Or a bearish continuation if this zone fails.
---
🔎 Market Structure & Pattern
1. Macro Trend:
From late 2024 to early 2025, WIF faced a strong downtrend.
A sharp rebound in March–May 2025 pushed the market into a consolidation range.
Since then, the chart has been forming lower highs, showing persistent selling pressure.
2. Critical Flip Zone (0.62 – 0.78):
Previously acted as heavy resistance.
Flipped into support after a breakout in May.
Now being retested as a decisive level.
3. Potential Reversal Formation:
Holding this zone may form a double bottom / base pattern → bullish setup.
Losing this zone could trigger a continuation breakdown toward new lows.
---
🟢 Bullish Scenario
Confirmation: Daily close above 0.75–0.78 with a strong bullish candle.
Upside targets:
1.0251 → nearest resistance.
1.2008 → major consolidation area.
1.8468 – 2.1772 → mid-term resistance levels.
Ideal setup: Retest & bounce with rising volume, forming a higher low.
---
🔴 Bearish Scenario
Confirmation: Daily close below 0.62 with strong follow-through.
Downside targets:
0.50 → psychological level & minor demand.
0.3040 → major low from the chart.
Ideal setup: Breakdown → retest of yellow zone as resistance → rejection → continuation downtrend.
---
⚖️ Key Notes
The yellow zone (0.62 – 0.78) is the decision zone for WIF.
Breakout or breakdown here will likely trigger strong momentum.
Aggressive traders: may enter inside the zone with a tight SL below 0.62.
Conservative traders: wait for a daily close confirmation with volume.
Always use risk management — WIF is highly volatile.
---
✍️ Conclusion
WIFUSDT is at a strategic turning point:
Holding above support could trigger a bullish reversal toward 1.02 → 1.20.
Losing this zone could open the door to deeper downside toward 0.40 – 0.30.
The next daily close will be crucial for validating direction.
#wifusdt #dogwifhat #cryptoanalysis #altcoins #supportresistance #demandzone #bullishscenario #bearishscenario #cryptotraders #priceaction #technicalanalysis
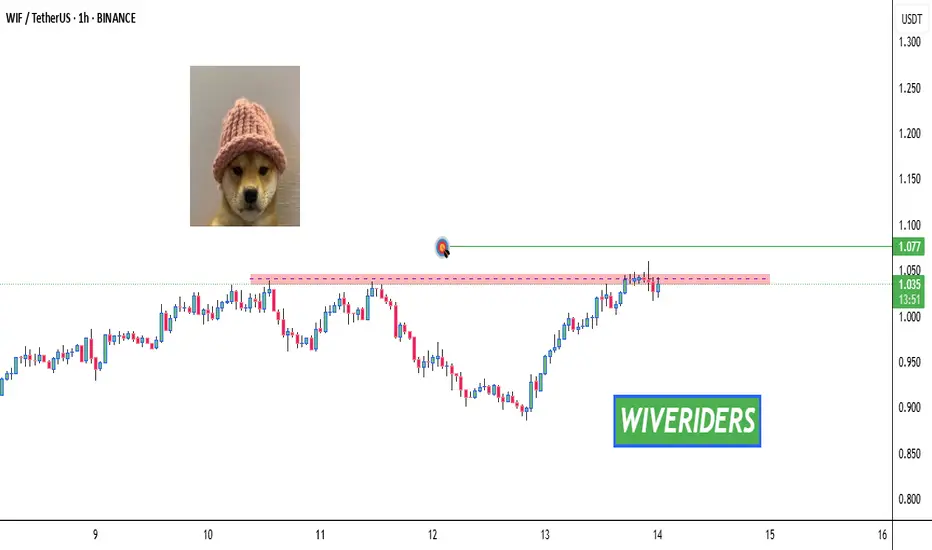
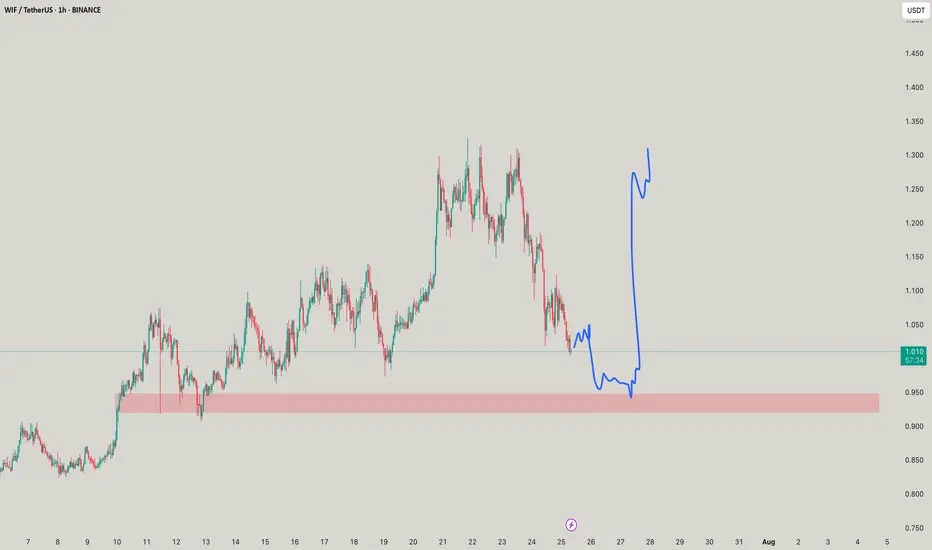
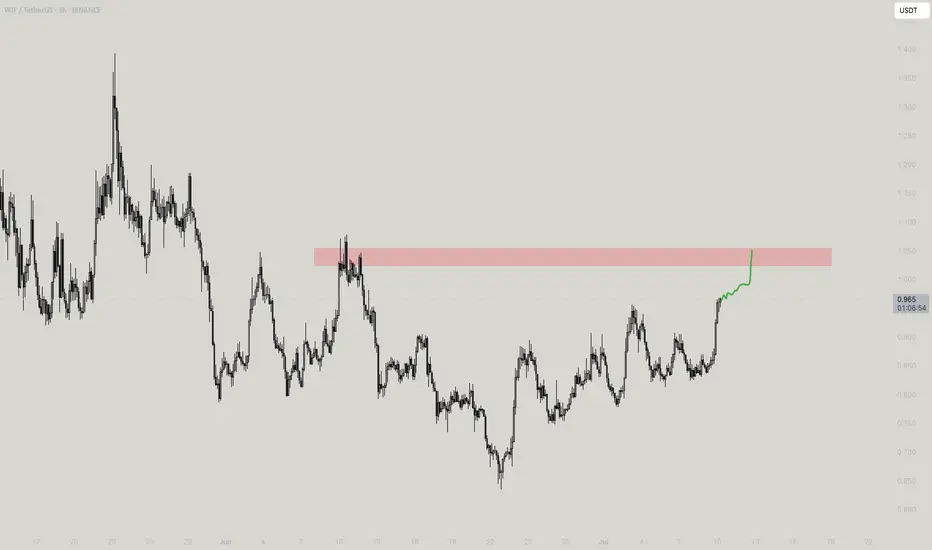
WIF Breakout Watch – Testing Key Resistance! 🚨 WIF Breakout Watch – Testing Key Resistance! 🔴⏳
WIF is testing the red resistance zone right now.
📊 If a breakout confirms, the next move could target:
🎯 First Target → Green line level
A confirmed breakout here could trigger strong bullish continuation.

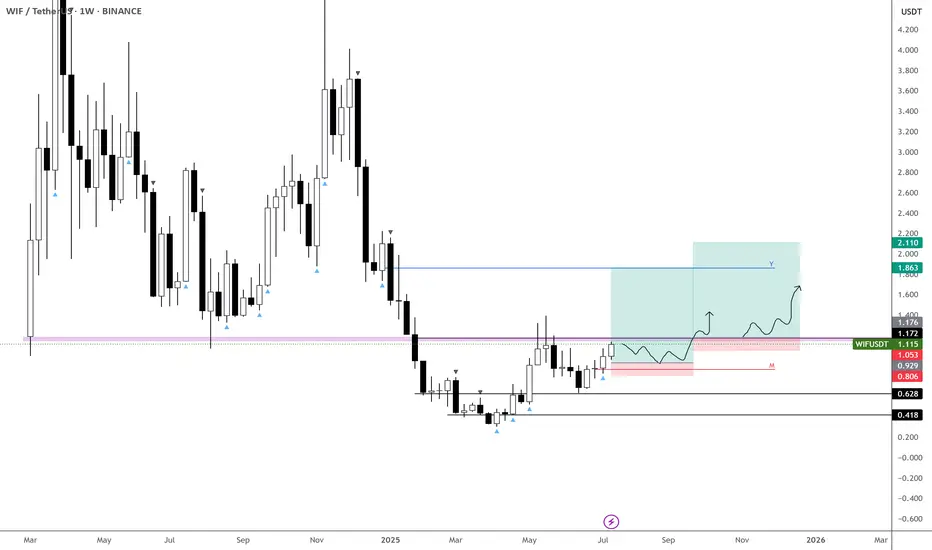
WIFUSDT to bounce from weekly support around 0.60#WIF #WIFUSD #WIFUSDT SEED_WANDERIN_JIMZIP900:WIF
On WIFUSDT, I see two possibilities for the upcoming price action.
The price has tapped into daily support DS1 and it is currently bouncing from there.
The first path suggests that this is the start of the reversal and upward journey continuation. But I am not very inclined to that possibility.
The second path suggests that the price will go down further to weekly support zone WS1 after the current bounce from DS1 is exhausted.
I am more inclined on the second path. This will allow a bounce with enough strength to make the price move beyond the current highs. And that bounce from weekly support WS1 will be a real breakout and allowing the price to move beyond 1.5 and so on.

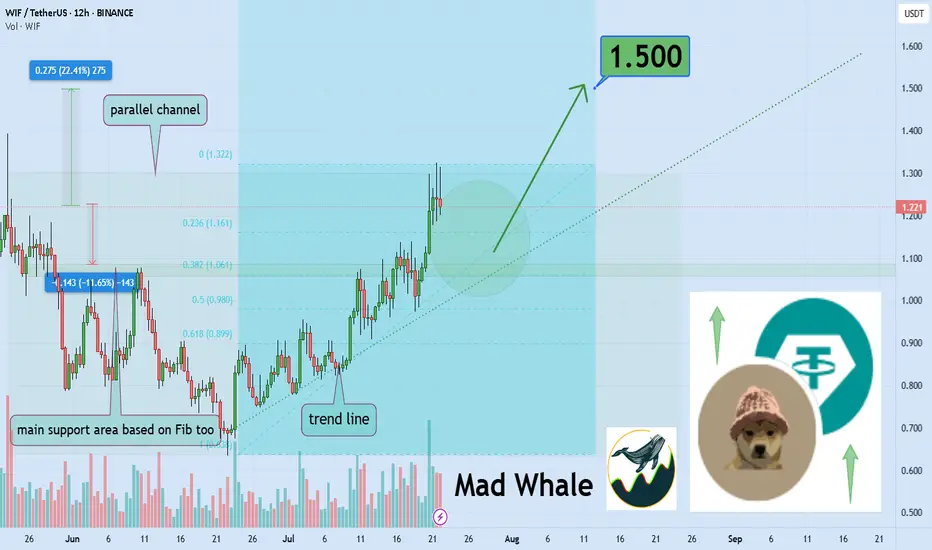
Dogwifhat Poised For 22% Growth Toward $1.50Hello✌
Let’s analyze Dogwifhat’s upcoming price potential 📈.
📈 BINANCE:WIFUSDT is currently sitting near a strong daily support and trendline. At the same time, the Fibonacci Level support lines up closely with this key level. This convergence suggests a potential upside of about 22%, aiming for a target price of $1.50. 🔥
✨We put love into every post!
Your support inspires us 💛 Drop a comment we’d love to hear from you! Thanks , Mad Whale
Memecoin with potential for purchase.Hello friends🙌
Considering the decline we had in the weekly timeframe, you can now see that with the good growth we had, it gives us a good signal to buy, of course in a stepwise manner and with capital and risk management.
🔥Follow us for more signals🔥
*Trade safely with us*
WIFFF your destiny!The patience is a game most fail, here you can get something which u cant expect!
Bullish Cup & Handle Pattern Formed 🚨 SEED_WANDERIN_JIMZIP900:WIF Testing Red Resistance – Bullish Cup & Handle Pattern Formed 📈
SEED_WANDERIN_JIMZIP900:WIF is currently testing the red resistance zone and has formed a bullish cup and handle pattern on the chart.
If a breakout occurs, potential upside toward:
✅ First Target: Green line level
✅ Second Target: Green line level
Wait for breakout confirmation before entering long. 📊
Patience is key—watch this closely! 💼💸

WIFUSDT: Mid-Term AnalysisI know the prices I want are very cheap.
But I believe this market can give me those prices if I’m patient.
Until then, I’m watching calmly. If price comes to my levels, I will look for:
✅ Footprint absorption
✅ CDV support
✅ Structure reclaim for confirmation
If it aligns, I’ll take the trade with clear risk. If not, I’ll keep waiting.
No rush. The right price, or no trade.

WIFUSDT Cup And Handle PatternWIF is showing a classic Cup and Handle pattern on the daily chart, a strong bullish reversal setup.
The price has broken above the neckline resistance around the $1.25–$1.30 area with bullish momentum. This breakout, if sustained with volume confirmation, could open the doors for a major upside move.
Cheers
Hexa
BINANCE:WIFUSDT

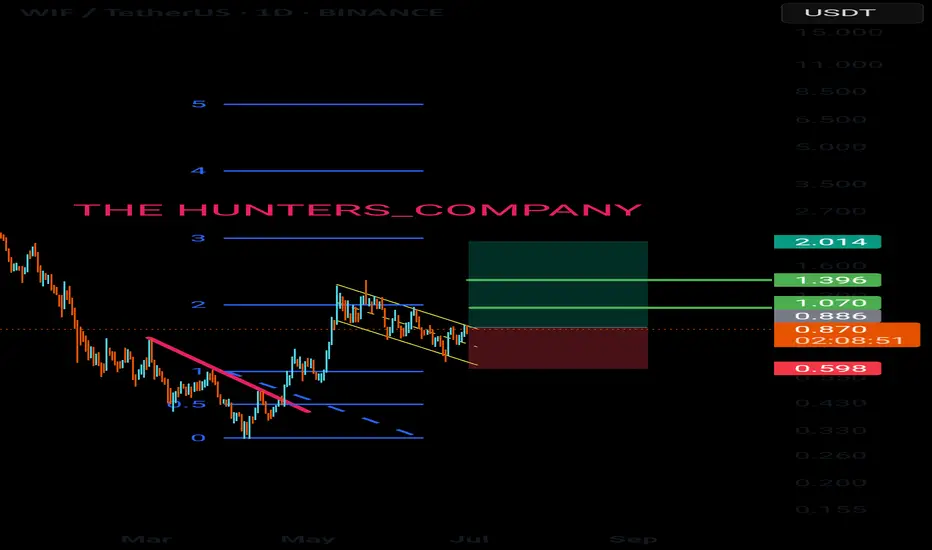
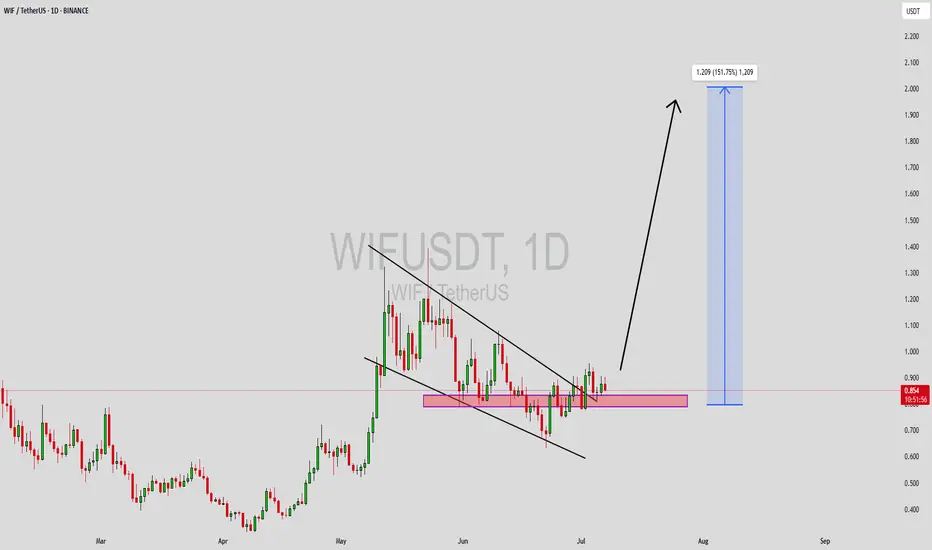
WIFUSDT Forming Descending ChannelWIFUSDT is currently trading within a descending channel pattern, a structure often considered bullish when found in a broader uptrend. This pattern indicates a period of healthy correction and consolidation, which often precedes a breakout move to the upside. With good trading volume and growing interest from the crypto community, WIF may be preparing for a strong reversal. The technical setup suggests a potential gain of 140% to 150%+ upon a confirmed breakout above the upper boundary of the channel.
Dogwifhat (WIF) has garnered significant attention due to its strong meme coin narrative within the Solana ecosystem. As meme tokens continue to attract retail attention, WIF has remained one of the more resilient and talked-about assets in its category. This strong community support, combined with current technical indicators, adds confidence to the bullish case.
The descending channel has allowed price to compress and reset RSI levels, setting the stage for a possible explosive move. If price breaks out with volume, this could mark the beginning of a new bullish wave. Traders should watch for a breakout candle with strong follow-through above recent resistance zones as a key confirmation point.
✅ Show your support by hitting the like button and
✅ Leaving a comment below! (What is You opinion about this Coin)
Your feedback and engagement keep me inspired to share more insightful market analysis with you!

$WIF just gearing for a new ATH! Not expecting much of a retrace on BINANCE:WIFUSDT — more likely we get consolidation against resistance.
This current level is crucial, and likely to form the base for either:
• A new ATH, or
• At minimum, a third retest of the $4.5–5 zone.
The broader market continues to push higher, and with Bitcoin Dominance breaking down, things could get very interesting in the coming months.
📌 Plan:
• Waiting on a clean retrace (as per second entry... previous post)
• Or a reclaim of the purple block to add to the position
Time to Accumulate $WIF - $1.2 is NextWIF finally showing signs of life.
Starting to build a position below 60c—this looks like an optimal entry given how well it's behaving.
Accumulation zone remains between 40–50c, as long as price holds there.
Targeting the 1.2 area on a break and hold above 65c.
BINANCE:WIFUSDT SEED_WANDERIN_JIMZIP900:WIF

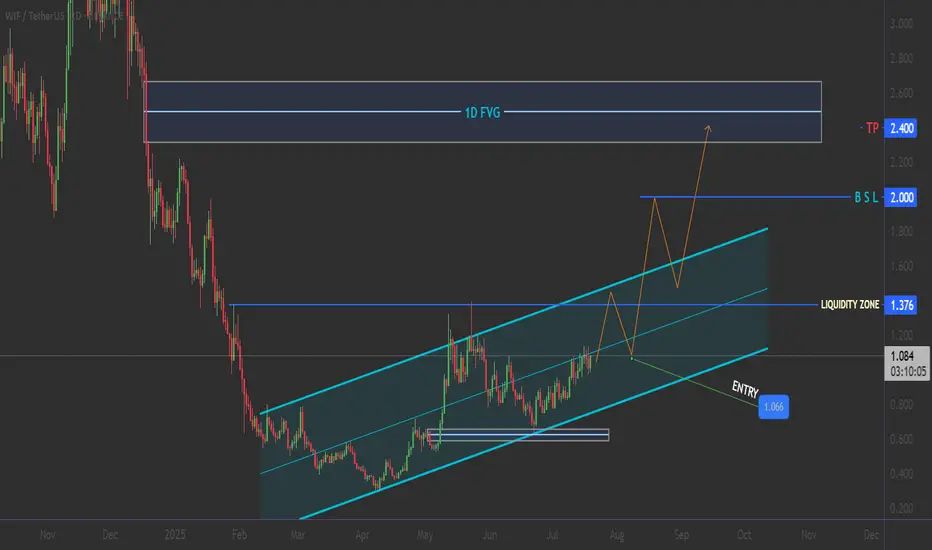
WIF: The Perfect Storm Setup - Ascending Triangle Breakout
📐 Perfect geometric pattern formation
📊 Volume profile supporting the setup
🎯 Clear target zones with minimal resistance
⚡ Compression leading to expansion
🎯 THE SETUP: Triple Confluence Strategy 🔥
📍 ENTRY ZONE: $1.00 - $1.06
🎯 TARGET 1: $2.000 (+85%)
🎯 TARGET 2: $2.400 (+120%)
🔴 STOP LOSS: $0.95 (-3%)
___________ NOTE ____________
🚨 RISK MANAGEMENT 🚨 DYOR
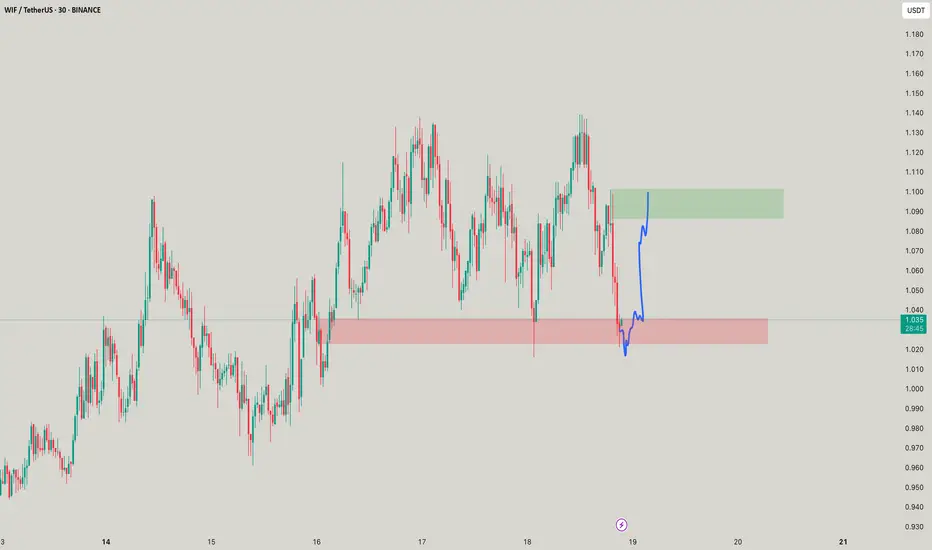
WIF WIF - SMOL SCALPSas showed stays in red box its happy, goes above its gone! Awesome super small scalps
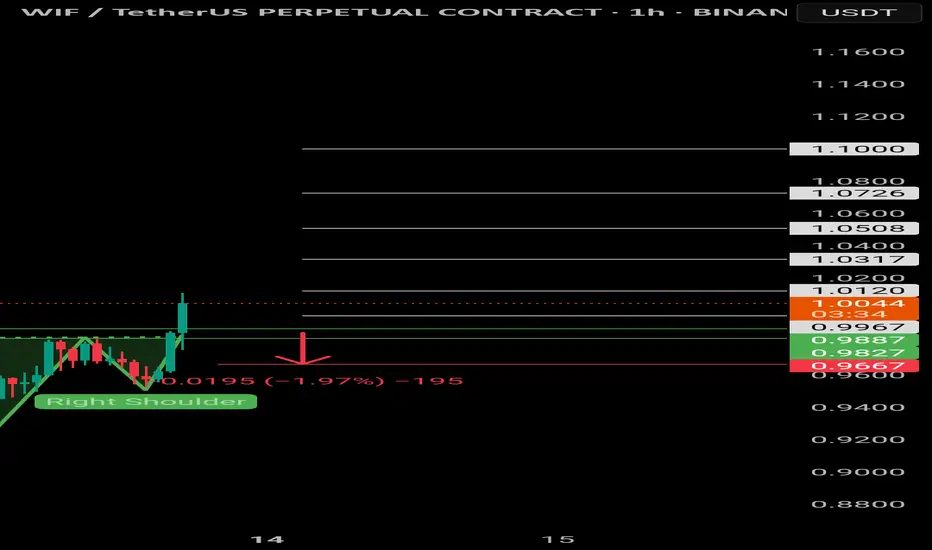
$WIF | Inverted head and shoulders $Wif/Usdt
BINANCE:WIFUSDT.P
The price is formed the Inverted head and shoulders pattern and did a breakout of the neckline, expecting the price to retest green lines (neckline).
If 1H CC hit and bounce above the green lines, it'll be a long opportunity.
Entering at current price will increase the SL, it's suggested to wait for a retest, to have better entry and a good risk management.
Use only 1-2% of your portfolio.
NFA, DYOR
TP:
Price explosion is coming?Read carefullyhello friends👋
We have come to analyze a popular Kuwaiti meme that you have asked to analyze a lot.
🌟Well, according to the drop we had, it can be seen that the buyers came in and formed a good upward wave, and after that, Femt entered a channel, which can be said to be a flag pattern...🧐
Now, according to the formed channel, we can enter into a purchase transaction with capital and risk management in case of a valid failure of the channel.
🔥Follow us for more signals on Bolran.🔥
*Trade safely with us*
WIF - One COIN TWO MOVES!SO the moves are for you to be seen, I am as usual saying half things so you come to me and ask whats it hahahha

MEW MEW - WIF is here!So yet again a very probable trade to the mark and you see something is better than nothing! The moves as said and marked!
WIFUSDT Forming Breakout Descending ChannelWIFUSDT is showing an exciting technical setup as it breaks free from a prolonged downward channel and consolidates near a strong support zone. This breakout pattern signals that the coin could be on the verge of a significant trend reversal, supported by healthy trading volume and renewed investor confidence. With buyers defending key levels and pushing the price above resistance, WIF is capturing the attention of traders looking for high-momentum plays.
Looking at the chart, WIFUSDT’s recent price action suggests that the base has formed well within the highlighted demand zone, providing a solid foundation for a sharp upward move. The breakout from the descending channel is a classic sign of trend change, and this technical shift is further reinforced by steady volume and bullish sentiment across social platforms. Traders should keep an eye on retests of the breakout zone for potential entry opportunities, as these could offer excellent risk-to-reward setups.
The potential gain of 140% to 150%+ makes WIFUSDT a top pick for those scanning the market for trending coins with breakout potential. The meme coin community remains highly active around WIF, and this fresh surge in interest could propel the coin to test its next major resistance levels in the coming weeks. As always, risk management and closely monitoring price action will be key to riding this bullish wave successfully.
✅ Show your support by hitting the like button and
✅ Leaving a comment below! (What is You opinion about this Coin)
Your feedback and engagement keep me inspired to share more insightful market analysis with you!
When the bark is louder than the bid - WIFWIF looks problematic, fall is there, but it would take shorters with them! so wait for that time!