#WLD/USDT Approaching Breakout After Long-Term Downtrend !#WLD
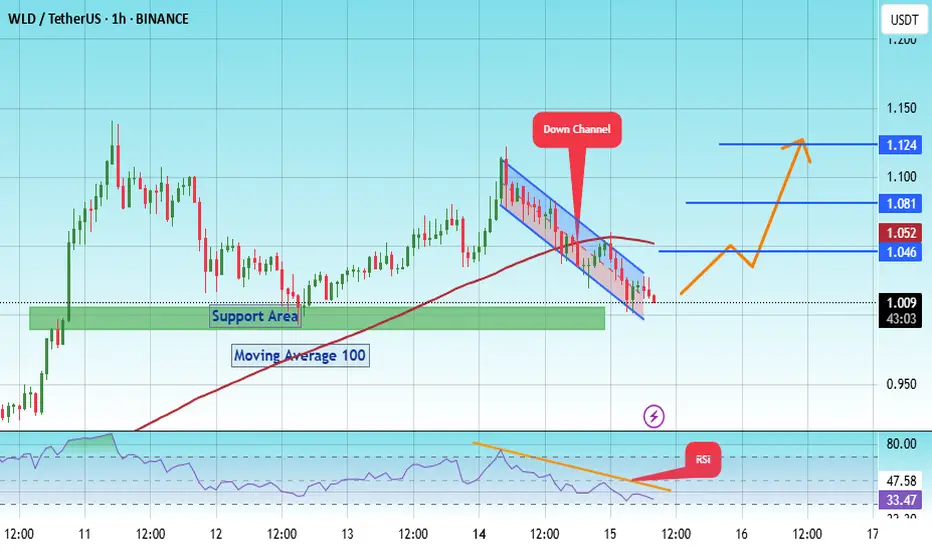
The price is moving within an ascending channel on the 1-hour frame, adhering well to it, and is on its way to breaking strongly upwards and retesting it.
We have support from the lower boundary of the ascending channel, at 1.00.
We have a downtrend on the RSI indicator that is about to break and retest, supporting the upside.
There is a major support area in green at 1.02, which represents a strong basis for the upside.
Don't forget a simple thing: ease and capital.
When you reach the first target, save some money and then change your stop-loss order to an entry order.
For inquiries, please leave a comment.
We have a trend to hold above the 100 Moving Average.
Entry price: 1.08.
First target: 1.12.
Second target: 1.157.
Third target: 1.20.
Don't forget a simple thing: ease and capital.
When you reach your first target, save some money and then change your stop-loss order to an entry order.
For inquiries, please leave a comment.
Thank you.
Wldusdtsignal
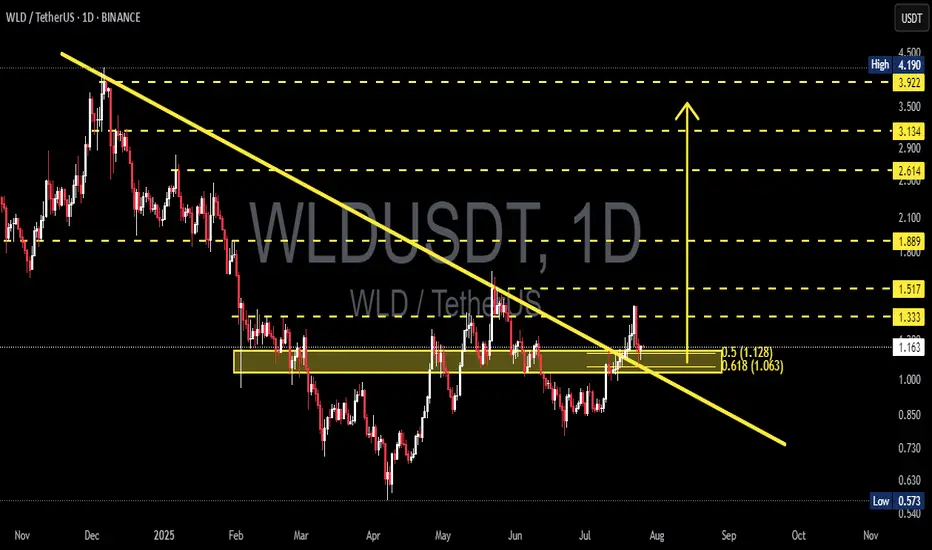
WLDUSDT at a Critical Level: Valid Breakout or Just a Fakeout?WLDUSDT is catching traders' attention after successfully breaking above a long-term descending trendline that has capped price since late 2024. But the big question now is — is this the start of a real trend reversal, or just a classic bull trap fakeout?
---
📌 Detailed Technical Breakdown
🟡 1. Major Trendline Breakout
The yellow trendline drawn from November 2024 has finally been broken to the upside.
This is a potential signal that bearish momentum is weakening significantly.
🟨 2. Key Demand Zone (Horizontal Yellow Box)
The area between 1.063 – 1.128 USDT has acted as a strong demand/support zone since March 2025.
Price is currently retesting this zone, which makes it a decisive level for validating the breakout.
🔁 3. Fibonacci Retracement Levels
Price is retesting the 0.5 (1.128) and 0.618 (1.063) retracement levels.
These fib levels could serve as a launchpad for a bullish continuation if held.
🧱 4. Layered Resistance Structure
If the bounce holds, WLD could target:
🔹 1.333 – Psychological resistance
🔹 1.517 – Previous structural resistance
🔹 1.889 – Key horizontal level
🔹 2.614 – 3.922 – Medium-term targets based on historical structure and fib extension
---
🟢 Bullish Scenario (Increasing Probability)
Price holds above the 1.063 – 1.128 zone and confirms a rebound.
A daily close above 1.333 would further confirm bullish continuation.
Formation of higher highs and higher lows would validate trend reversal.
🔴 Bearish Scenario (If Breakdown Occurs)
Price loses support at 1.063, invalidating the breakout and retest.
Possible targets to the downside:
Minor support: 0.85 – 0.75
Major support: 0.573 (Previous macro low)
---
📈 Interesting Chart Pattern
Potential formation of an Inverse Head and Shoulders, with the neckline around 1.333.
A confirmed breakout above the neckline could trigger a strong bullish impulse.
---
🎯 Conclusion
WLD is now in a golden zone that will decide its medium-to-long-term trend.
The 1.063 – 1.128 area is make-or-break. If bulls defend this zone, it confirms trend reversal. If it fails, WLD could slide back into a distribution range.
📌 Traders who wait for confirmation at this stage may have the strategic edge.
#WLDUSDT #WLDAnalysis #CryptoBreakout #TrendlineBreak #TechnicalAnalysis #InverseHeadAndShoulders #FibonacciSupport #AltcoinSetup #CryptoTrading #CryptoUpdate
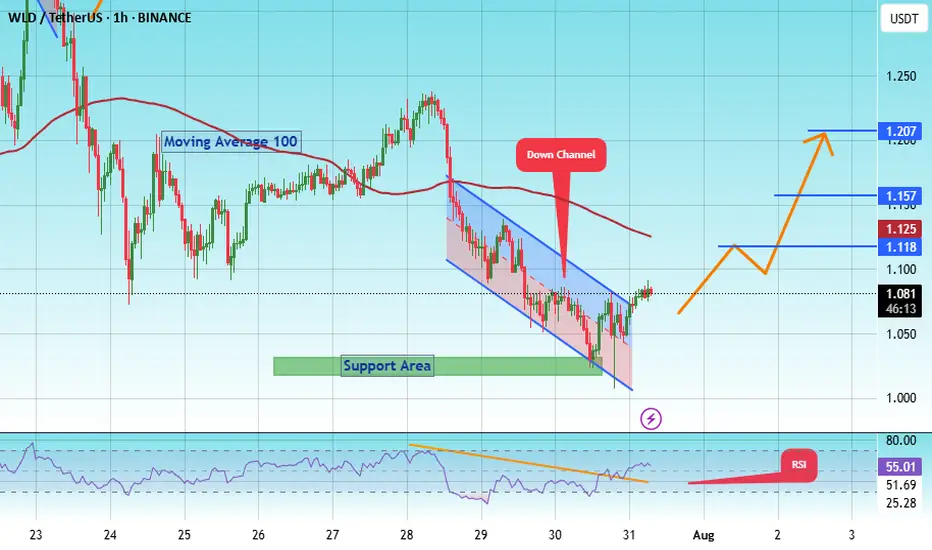
#WLD/USDT Approaching Breakout After Long-Term Downtrend!#WLD
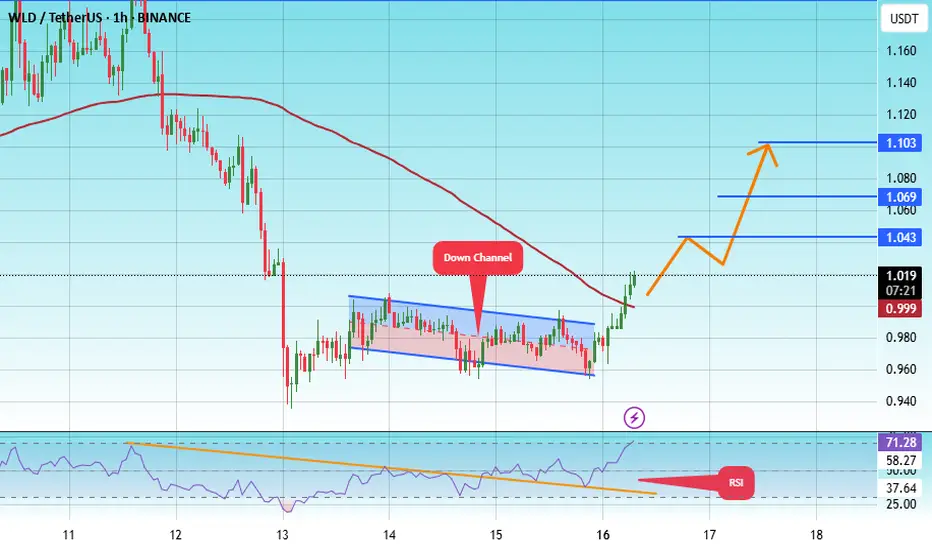
The price is moving within a descending channel on the 1-hour frame, adhering well to it, and is on its way to breaking strongly upwards and retesting it.
We have support from the lower boundary of the descending channel, at 1.200.
We have a downtrend on the RSI indicator that is about to be broken and retested, supporting the upside.
There is a major support area in green at 1.170, which represents a strong basis for the upside.
Don't forget a simple thing: ease and capital.
When you reach the first target, save some money and then change your stop-loss order to an entry order.
For inquiries, please leave a comment.
We have a trend to hold above the 100 Moving Average.
Entry price: 1.250.
First target: 1.288.
Second target: 1.321.
Third target: 1.373.
Don't forget a simple thing: ease and capital.
When you reach your first target, save some money and then change your stop-loss order to an entry order.
For inquiries, please leave a comment.
Thank you.

$WLD Breakout: 200% Move Ahead?MIL:WLD just broke out of a long-term triangle pattern, which could be the start of a big move.
If it stays above the $1.085 zone, we might see it climb toward $3.30, which is over 200% upside.
A clean retest would make this breakout even stronger.
DYOR, NFA

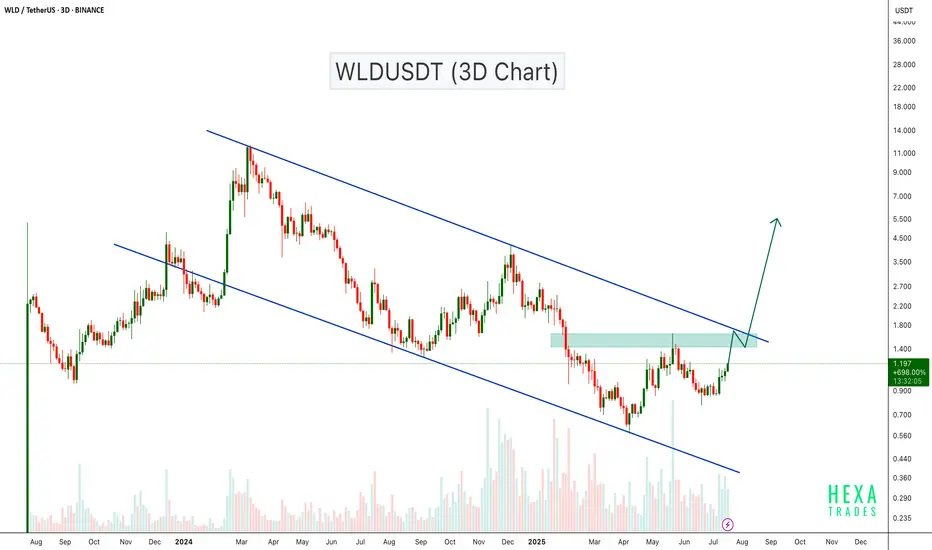
WLDUSDT Approaching Breakout After Long-Term Downtrend!WLD is currently trading inside a descending channel on the 3-day chart. The price has recently shown strong bullish momentum and is approaching the upper boundary of the channel as well as a key resistance zone.
A breakout above this zone could lead to a significant bullish continuation. Volume has started to pick up, indicating increasing interest. If the price manages to flip the resistance into support, we could potentially see a rally towards the $5.00 - $10.00 zone.
#WLD/USDT Builds Pressure Inside Long-Term Range#WLD
The price is moving within a descending channel on the 1-hour frame, adhering well to it, and is on its way to breaking it strongly upwards and retesting it.
We have a bounce from the lower boundary of the descending channel. This support is at 1.00.
We have a downtrend on the RSI indicator that is about to break and retest, supporting the upside.
There is a major support area in green at 0.990, which represents a strong basis for the upside.
Don't forget a simple thing: ease and capital.
When you reach the first target, save some money and then change your stop-loss order to an entry order.
For inquiries, please leave a comment.
We have a trend to hold above the 100 Moving Average.
Entry price: 1.01
First target: 1.04
Second target: 1.08
Third target: 1.12
Don't forget a simple thing: ease and capital.
When you reach the first target, save some money and then change your stop-loss order to an entry order.
For inquiries, please leave a comment.
Thank you.
#WLD/USDT Builds Pressure Inside Long-Term Range#WLD
The price is moving within a descending channel on the 1-hour frame and is expected to break and continue upward.
We have a trend to stabilize above the 100 moving average once again.
We have a downtrend on the RSI indicator that supports the upward break.
We have a support area at the lower boundary of the channel at 0.992, acting as strong support from which the price can rebound.
We have a major support area in green that pushed the price upward at 0.930.
Entry price: 1.00
First target: 1.036
Second target: 1.073
Third target: 1.111
To manage risk, don't forget stop loss and capital management.
When you reach the first target, save some profits and then change your stop order to an entry order.
For inquiries, please comment.
Thank you.

#WLD/USDT , How Long Will It Take For A $ 1.14 Target?#WLD
The price is moving within a descending channel on the 15-minute frame and is expected to break and continue upward.
We have a trend to stabilize above the 100 Moving Average once again.
We have a downtrend on the RSI indicator that supports the upward break.
We have a support area at the lower boundary of the channel at 1.06, acting as strong support from which the price can rebound.
We have a major support area in green that pushed the price higher at 1.05.
Entry price: 1.08
First target: 1.09
Second target: 1.117
Third target: 1.14
To manage risk, don't forget stop loss and capital management.
When you reach the first target, save some profits and then change the stop order to an entry order.
For inquiries, please comment.
Thank you.

#WLD/USDT#WLD
The price is moving within a descending channel on the 1-hour frame, adhering well to it, and is heading towards a strong breakout and retest.
We are experiencing a rebound from the lower boundary of the descending channel, which is support at 0.950.
We are experiencing a downtrend on the RSI indicator that is about to be broken and retested, supporting the upward trend.
We are looking for stability above the 100 moving average.
Entry price: 1.20
First target: 1.04
Second target: 1.07
Third target: 1.10
#WLD/USDT#WLD
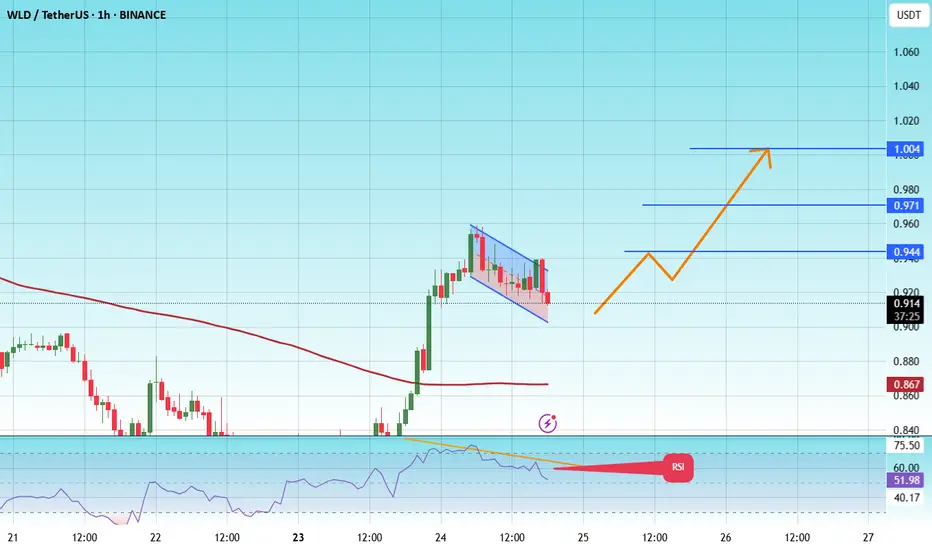
The price is moving within a descending channel on the 1-hour frame and is expected to break and continue upward.
We have a trend to stabilize above the 100 moving average once again.
We have a downtrend on the RSI indicator that supports the upward move with a breakout.
We have a support area at the lower limit of the channel at 0.900, acting as strong support from which the price can rebound.
Entry price: 0.913
First target: 0.944
Second target: 0.971
Third target: 1.004
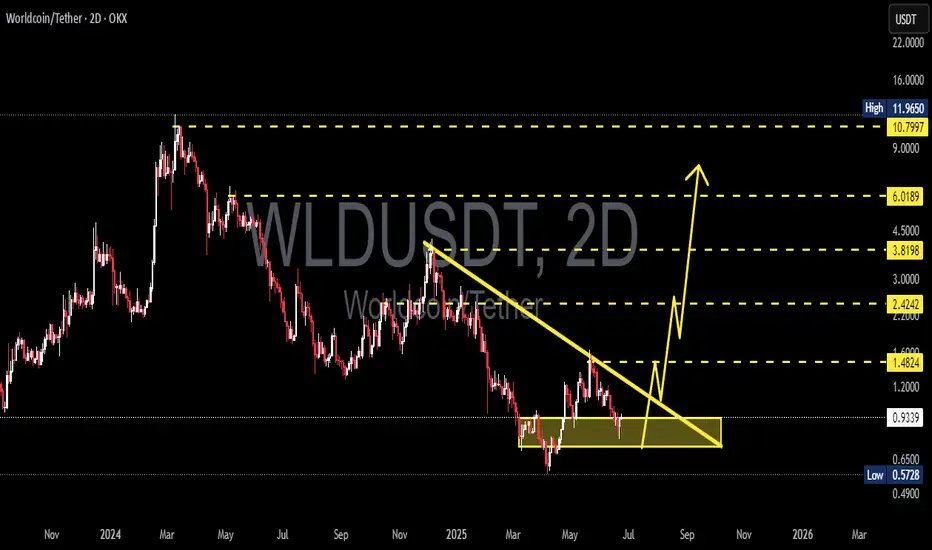
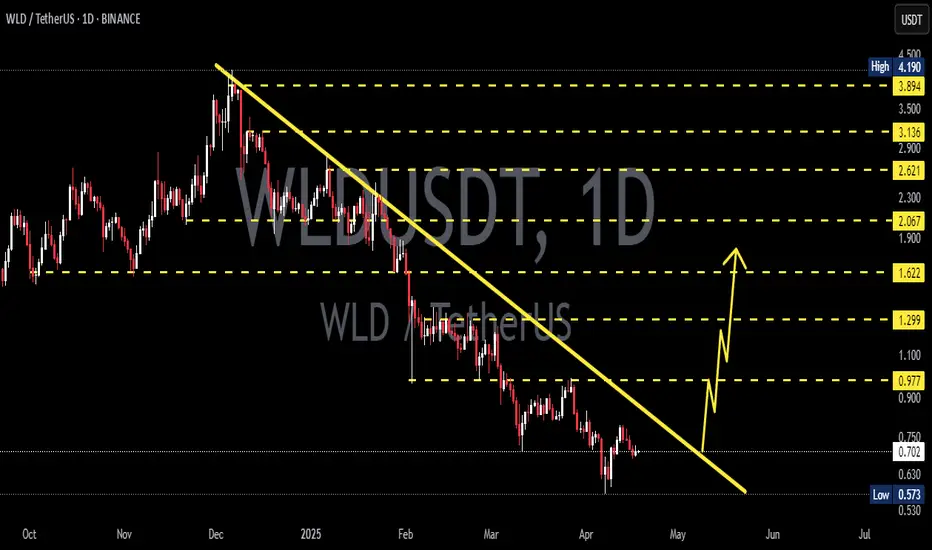
Worldcoin (WLD/USDT) Breakout Potential – Bullish Setup in PlayThis chart illustrates a potential breakout setup for Worldcoin (WLD) against USDT on the 2-day timeframe (2D), published on June 25, 2025. Key technical insights are as follows:
🔍 Technical Structure:
Strong support zone (accumulation area): Formed in the range of $0.9300 – $0.5728 (highlighted in yellow box). Price is currently consolidating within this zone, which has been tested multiple times and held, indicating a potential bottom formation.
Descending trendline: Has been broken with a bullish candle, suggesting an early signal of a potential trend reversal from bearish to bullish.
Key resistance levels (potential targets):
$1.4824 – initial breakout validation level
$2.4242 – mid-term resistance
$3.8198 – psychological and previous distribution zone
$6.0189 – major resistance before ATH
$10.7997 – $11.9650 – All Time High zone
📈 Projected Price Movement:
Bullish scenario depicted:
1. A possible retest of the breakout zone around $0.93
2. Gradual price rally toward $1.48 and $2.42 as initial targets
3. If momentum and volume support the move, a further rally toward $3.81 and $6.01 is possible
4. Ultimate long-term target lies near previous highs at $10.79–$11.96
💡 Additional Notes:
This setup is still unconfirmed and requires further breakout confirmation and supporting volume for reliability.
Trade remains high risk, as price is still near the final support zone before potential breakdown.
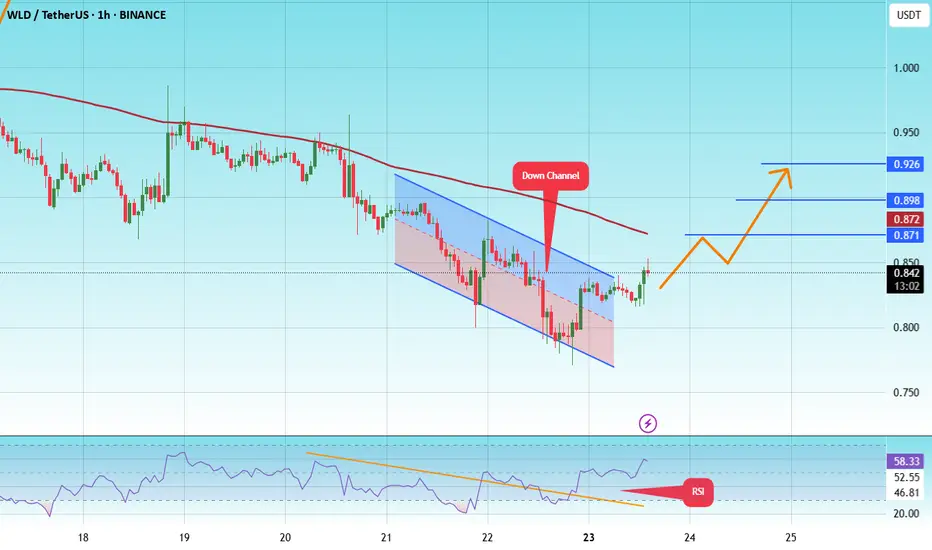
#WLD/USDT#WLD
The price is moving within a descending channel on the 1-hour frame and is expected to break and continue upward.
We have a trend to stabilize above the 100 moving average once again.
We have a downtrend on the RSI indicator that supports the upward move with a breakout.
We have a support area at the lower limit of the channel at 0.825, acting as strong support from which the price can rebound.
Entry price: 0.846
First target: 0.871
Second target: 0.898
Third target: 0.926
Worldcoin Eyes Breakout But Faces Strong HeadwindsWorldcoin is currently facing a key resistance zone that was previously acting as strong support — a classic flip that now caps upward moves.
Despite recent recovery, the price is still trading below the descending trendline, which continues to act as dynamic resistance.
Until we see a confirmed breakout above this confluence zone, upside potential remains limited. A rejection here could send the price back toward previous support levels.
Keep an eye on this area. A strong breakout could shift momentum, but for now, caution is warranted.
DYOR, NFA

WLDUSDT 3D AnalysisWLD ~ 3D Analysis
#WLD Buy gradually from here if you still have confidence in this coin with a short term target of at least 15%+ from here.

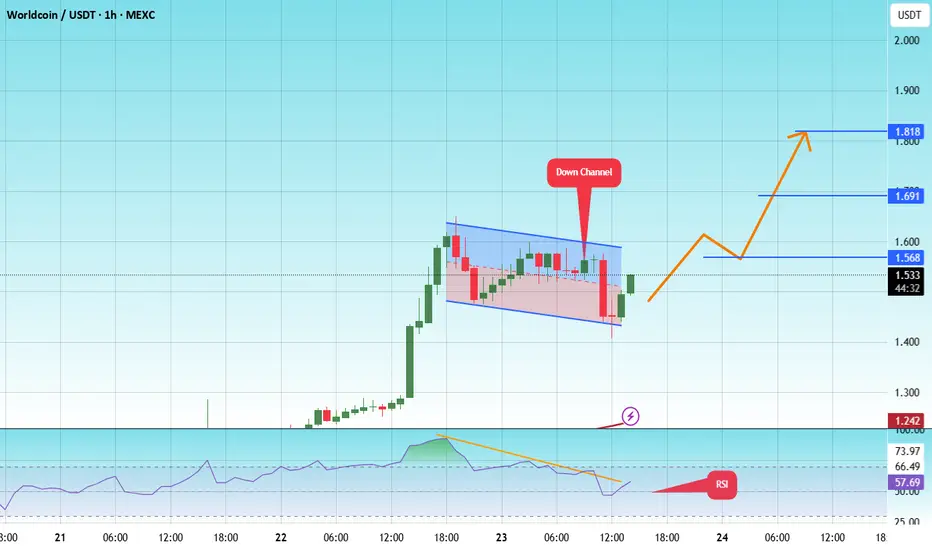
#WLD/USDT#WLD
The price is moving within a descending channel on the 1-hour frame and is expected to break and continue upward.
We have a trend to stabilize above the 100 moving average once again.
We have a downtrend on the RSI indicator that supports the upward move with a breakout.
We have a support area at the lower limit of the channel at 0.410, acting as strong support from which the price can rebound.
Entry price: 0.500
First target: 1.568
Second target: 1.691
Third target: 1.818
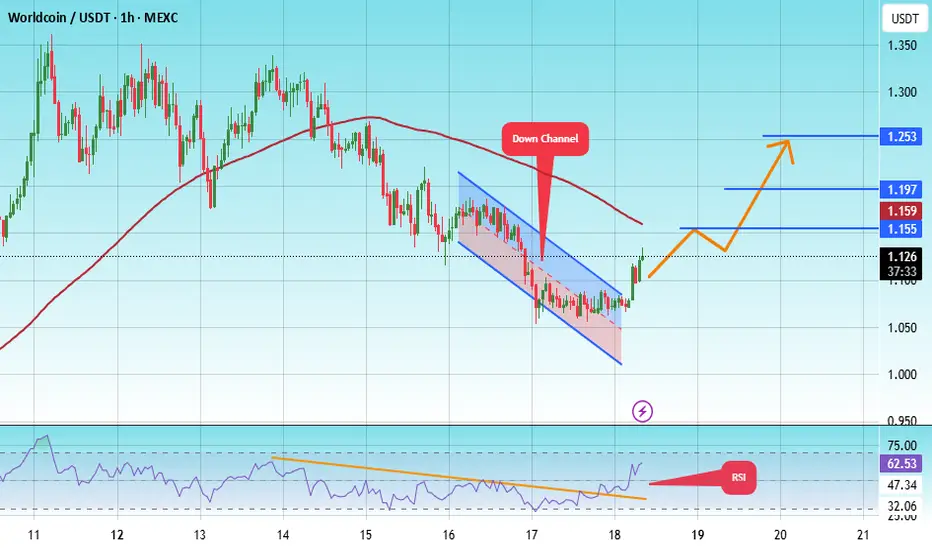
#WLD/USDT#WLD
The price is moving within a descending channel on the 1-hour frame and is expected to break and continue upward.
We have a trend to stabilize above the 100 moving average once again.
We have a downtrend on the RSI indicator that supports the upward move with a breakout.
We have a support area at the lower boundary of the channel at 1.15, which acts as strong support from which the price can rebound.
Entry price: 1.16
First target: 1.19
Second target: 1.23
Third target: 1.28

#WLD/USDT#WLD
The price is moving within a descending channel on the 1-hour frame, adhering well to it, and is heading for a strong breakout and retest.
We are experiencing a rebound from the lower boundary of the descending channel, which is support at 1.03.
We are experiencing a downtrend on the RSI indicator, which is about to break and retest, supporting the upward trend.
We are looking for stability above the 100 Moving Average.
Entry price: 1.12
First target: 1.15
Second target: 1.19
Third target: 1.250
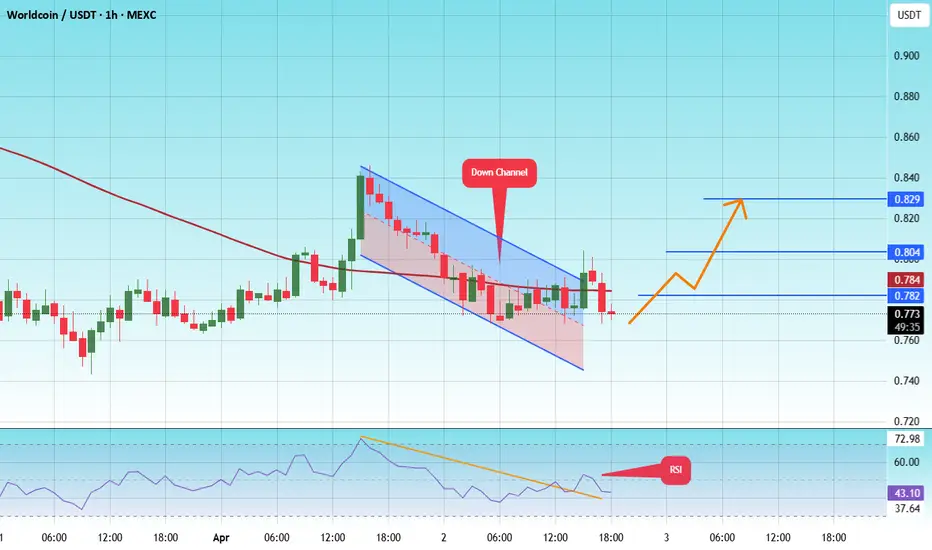
#WLD/USDT#WLD
The price is moving within a descending channel on the 1-hour frame and is expected to continue upward.
We have a trend to stabilize above the 100 moving average once again.
We have a downtrend on the RSI indicator, which supports the upward move by breaking it upward.
We have a support area at the lower limit of the channel at 0.750.
Entry price: 0.0764
First target: 0.0782
Second target: 0.800
Third target: 0.829
WLDUSDT 1D AnalysisWLD ~ 1D Analysis
#WLD Mark this coin, and buy when successfully penetrating this resistant line with a short -term target of at least 10%+.
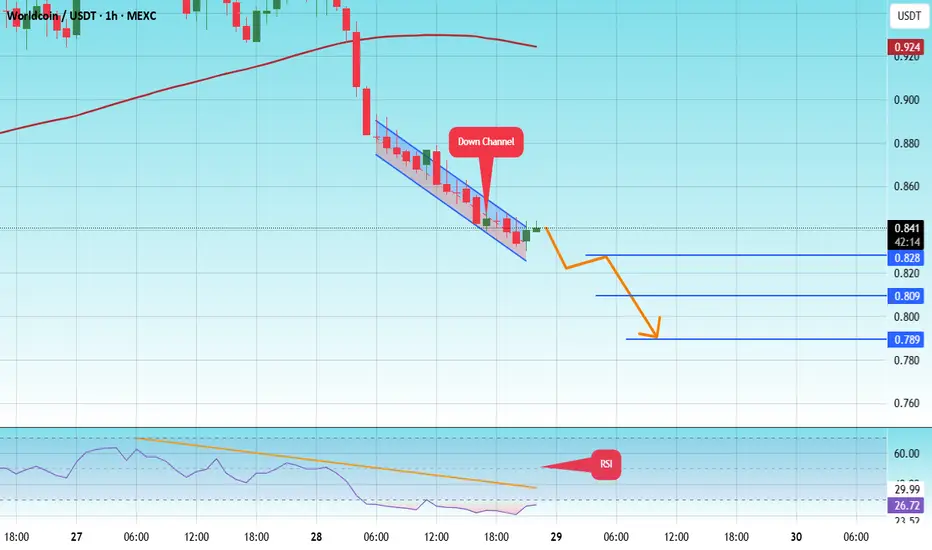
#WLD/USDT#WLD
The price is moving within a descending channel on the 1-hour frame and is expected to continue lower.
We have a trend to stabilize below the 100 moving average once again.
We have a downtrend on the RSI indicator, supporting the upward move with a break above it.
We have a support area at the upper limit of the channel at 0.844.
Entry price: 0.838
First target: 0.828
Second target: 0.809
Third target: 0.789
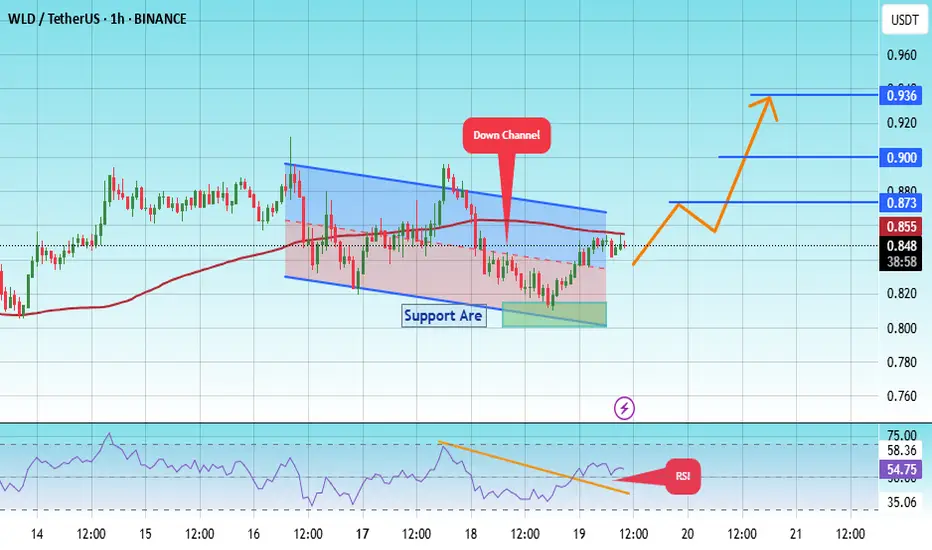
#WLD/USDT#WLD
The price is moving within a descending channel on the 1-hour frame, adhering well to it, and is heading for a strong breakout and retest.
We are seeing a bounce from the lower boundary of the descending channel, which is support at 0.807.
We have a downtrend on the RSI indicator that is about to be broken and retested, supporting the upward trend.
We are looking for stability above the 100 moving average.
Entry price: 0.850
First target: 0.873
Second target: 0.900
Third target: 0.936
#WLD/USDT#WLD
The price is moving in a descending channel on the 1-hour frame and is adhering to it well and is heading to break it upwards strongly and retest it
We have a bounce from the lower limit of the descending channel, this support is at a price of 0.870
We have a downtrend on the RSI indicator that is about to break and retest, which supports the rise
We have a trend to stabilize above the moving average 100
Entry price 1.00
First target 1.05
Second target 1.12
Third target 1.20
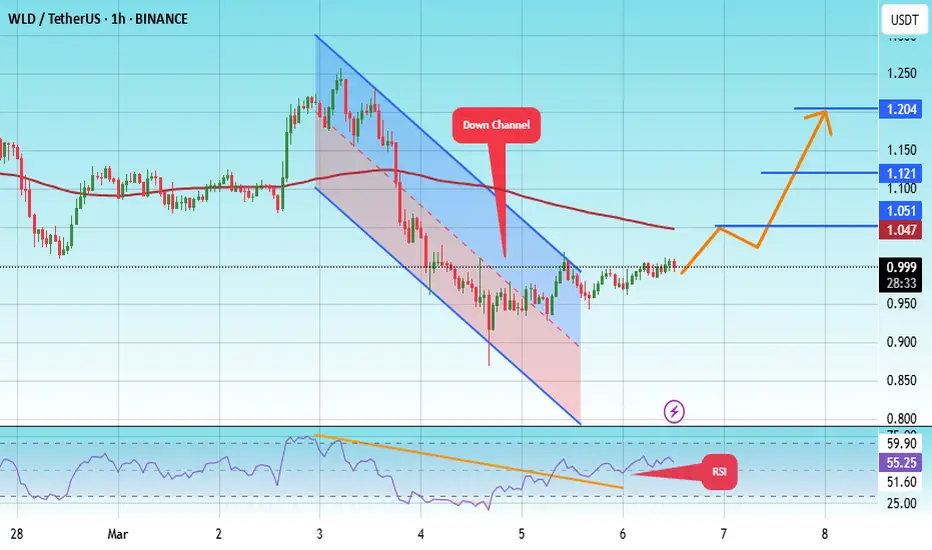
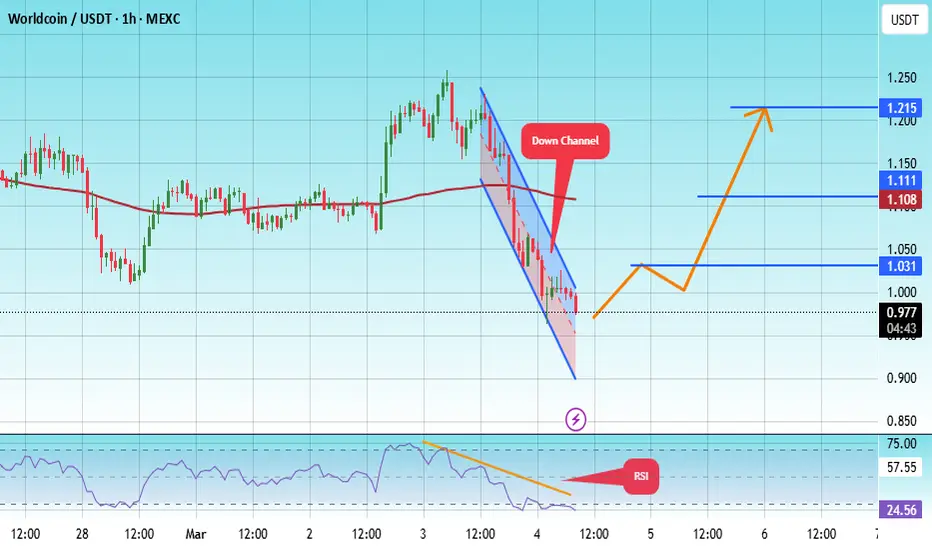
#WLD/USDT#WLD
The price is moving in a descending channel on the 1-hour frame and is adhering to it well and is heading to break it strongly upwards and retest it
We have a bounce from the lower limit of the descending channel, this support is at a price of 0.948
We have a downtrend on the RSI indicator that is about to break and retest, which supports the rise
We have a trend to stabilize above the moving average 100
Entry price 0.976
First target 1.031
Second target 1.108
Third target 1.215