WLFI Faces -10% Risk! Will PRZ Trigger a Strong Reversal?Today, I’m going to analyze World Liberty Financial ( BINANCE:WLFIUSDT ) from a fundamental and technical perspective .
WLFI is the governance token (non-equity) with a 5% per-wallet voting cap.
USD1 is a fully backed U.S. dollar stablecoin (T-Bills + cash).
Total WLFI supply is 100B, with ~24.6B circulating at launch (TGE).
A large share of economic benefits (75% of net revenues) goes to a Trump-affiliated entity, raising concentration and political/regulatory risk.
Key partnership : Alt5 Sigma announced $1.5B funding to adopt WLFI’s treasury strategy and acquire tokens.
Risks : ownership concentration, regulatory scrutiny, and recent EIP-7702 phishing attacks targeting WLFI wallets.
Latest update : WLFI trading started Sep 1 with high volatility and a strong market cap, alongside ongoing security warnings.
Summary : WLFI is a high-risk, high-attention project whose future depends on USD1 adoption, governance transparency, and security execution.
----------------------------------------------------------------------------------
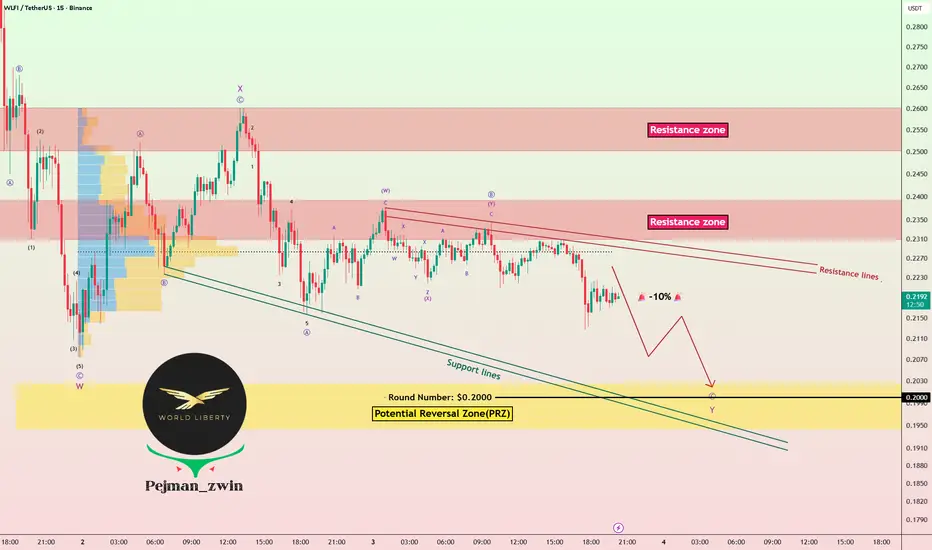
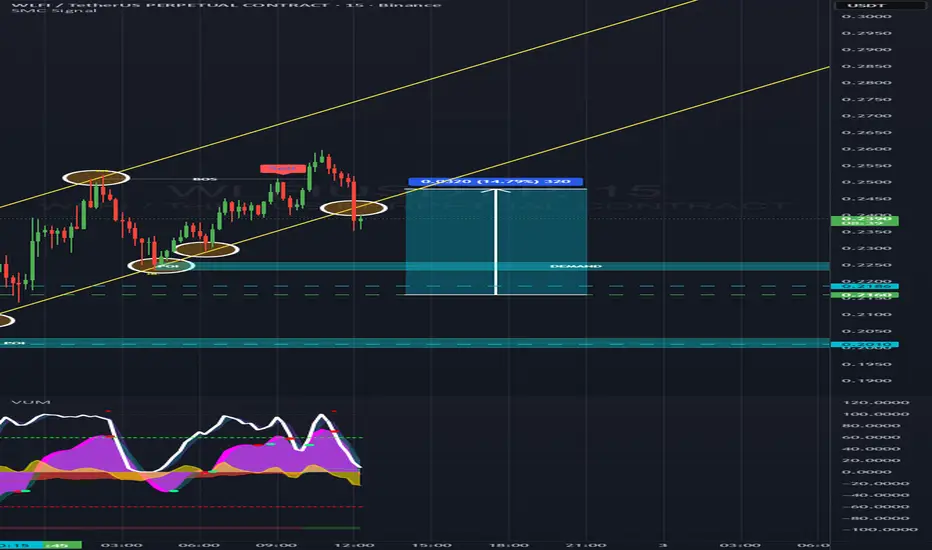
Now, let's use the candles that the WLFI token has created since September 1st and examine the technical analysis of this token on the 15-minute time frame .
First, let me say that due to the low number of candles created , some technical analysis can be challenging .
The WLFI token has been in a correction mode since it was listed on various exchanges .
In terms of Elliott wave theory , WLFI token seems to be completing the microwave C of the main wave Y . The corrective wave structure could be a Double Three Correction(WXY) .
I expect WLFI token to continue its decline and drop at least -10% . The Potential Reversal Zone(PRZ) and Support lines could cause the WLFI token to rise again.
First Target: $0.2043
Second Target: $0.2003
Stop Loss(SL): $0.2400(Worst)
Please respect each other's ideas and express them politely if you agree or disagree.
World Liberty Financial Analyze (WLFIUSDT), 15-minute time frame.
Be sure to follow the updated ideas.
Do not forget to put a Stop loss for your positions (For every position you want to open).
Please follow your strategy and updates; this is just my Idea, and I will gladly see your ideas in this post.
Please do not forget the ✅' like '✅ button 🙏😊 & Share it with your friends; thanks, and Trade safe.
WLFIUSDT
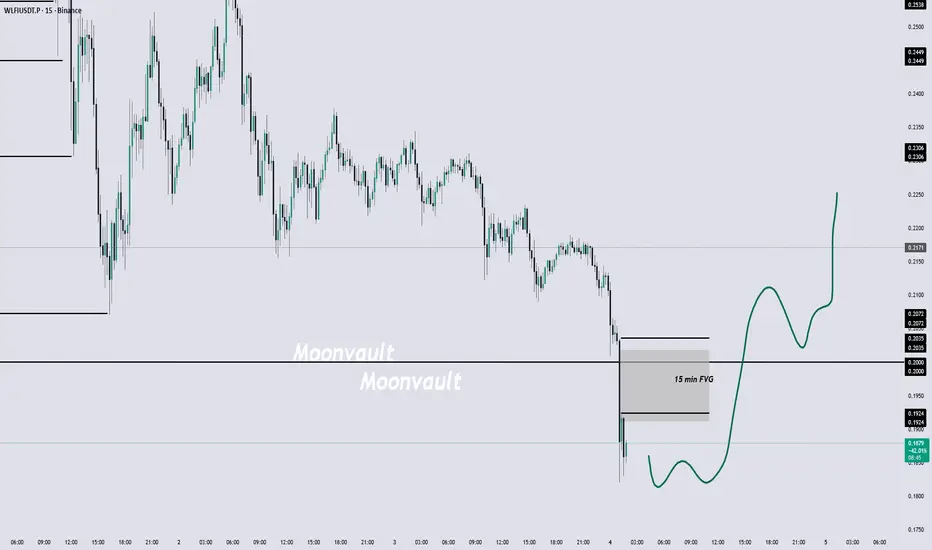
$WLFI wlfi $BTC $ETH crypto$WLFI update from last post: as we mentioned below 0.2 is a good zone to watch! Now wait for confirmation, and we can enter a good R/R trade ... set alerts, I will make an update on X too ... stay safe.
#BTC
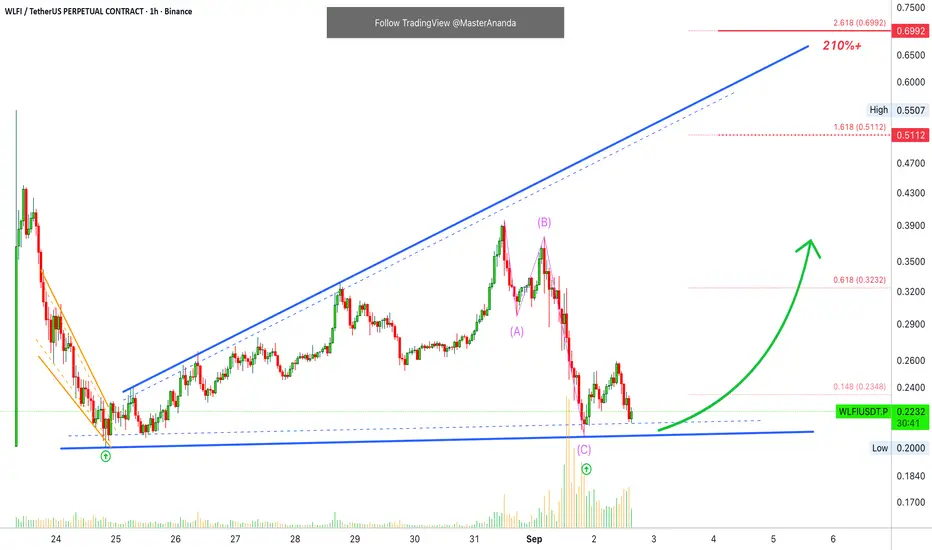
World Liberty Financial · The Bullish Impulse—200% Target MappedThis is a very wide channel but I am sure you get the picture.
WLFIUSDT recently produced a crash, very strong bearish volume and a major low. But there is good news, the low ended up as a higher low compared to 24-August, the market bottom.
We have a clear trend, specially when considering the higher highs.
The initial trading was a sure drop, easy drop, easy to see.
The remaining portion of the chart simply shows a new project starting to wake up. It is becoming alive. It is growing and will continue to grow based on the signals coming from this chart.
As you can see, even with extreme pressure the bears were not able to produce a new low.
We have a classic ABC correction. After a classic correction, we get the bullish impulse, a 1,2,3,4,5 up-wave pattern. This looks like a good chart setup, another one.
Thank you for reading.
I appreciate the fact that you keep on coming back;
I appreciate your time and energy.
Your support is highly appreciated.
Namaste.
Play the LONGTERM GAME with $WLFIPlay the LONGTERM GAME with TSXV:WLF
Remember that $TRUMP did 17x
$WLFI is going to 20usd - that's 92X
STOP SHORTING TODAY
Think LONGTERM
WLFI Launch At Ridiculous Valuation | Stablecoin ComparisonBINANCE:WLFIUSDT.P is a protocol affiliated with the Trump family and managed by Chase Herro and Zak Folkman - both with a notorious past with Herro reffering to himself as the 'scumbag of the internet'.
World Liberty Financial has a major product in USD1. As of today its the sixth larget stablecoin by supply. $2.4b circulating with increasing adoption. USD1 is the main product of WLFI.
In the video I compare WLFI and USD1 to its competitors in BINANCE:ENAUSDT and USDe, NYSE:CRCL and USDC.
With this comparison you see a massive overvaluation of WLFI at ~$23b compared to $2.4b supply of USD1. Relative to ENA at $9b with $12b USDe supply. Circle is $30b with $70b USDC.
This shows an extreme extra cost added to WLFI with no real current product to rationalise it. Not to say that there wont be new products or a major expansion of USD1.. only that its priced as if theyve already achieved it.

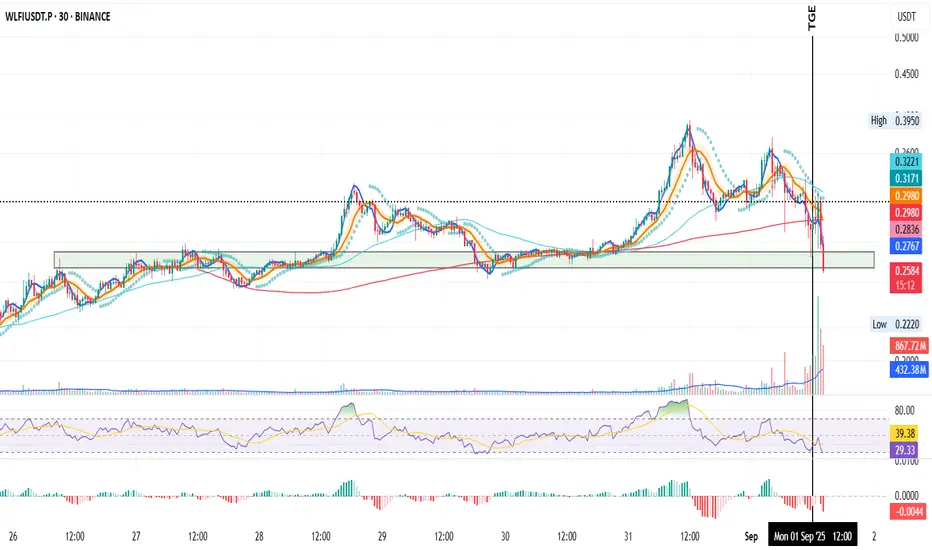
WLFI 30min 200MA Break — Trouble Ahead?WLFI on the 30min TF
Up to TGE (black vertical line), the 200MA acted as support.
Today that broke, price closed below after rejection at the previous day’s close.
MLR < SMA < BB Center and PSAR is bearish, confirming a downtrend.
RSI is just above oversold, MACD is red, and sell volume is rising.
The key now is whether the green support area can hold.
Always take profits and manage risk.
Interaction is welcome.
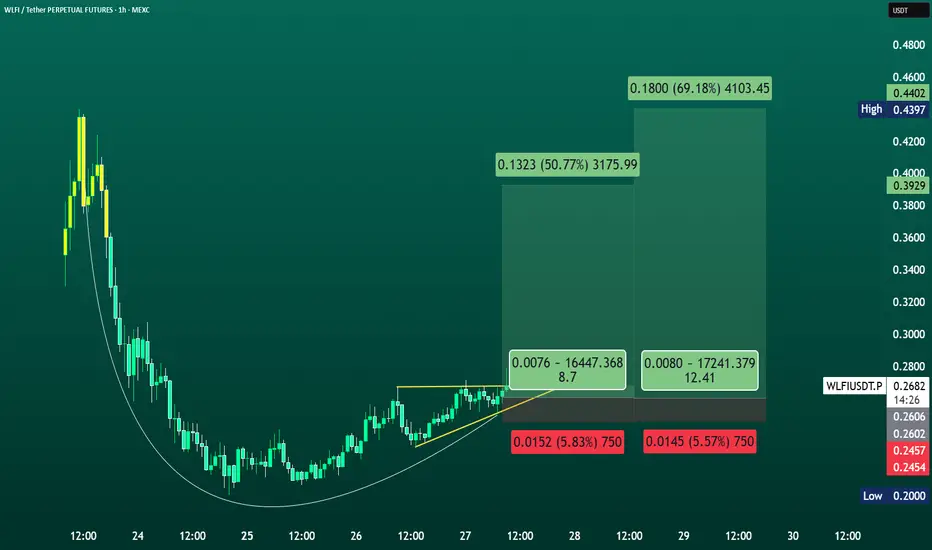
WLFI/USDT Bullish Reversal; Targeting 0.39 - 0.439Current Price: $0.2690
WLFI/USDT is showing a bullish recovery pattern on the 1H chart after bottoming near $0.245. Price has reclaimed short-term support and is pushing toward Fibonacci extension levels. A trade setup here offers a favorable risk/reward ratio (2:1 to 3:1+), with defined stop-loss support and upside targets aligning with $0.317, $0.344, and $0.392+
Support Zone: $0.2450 – $0.2600
Fibonacci Levels:
0.2911 (161.8%)
0.3164 (227.2%)
0.3446 (300%)
0.3685 (361.8%)
0.3929 (423.6%)
Upside Targets (from your chart projections):
Target 1: $0.3175 (+50.7%)
Target 2: $0.4103 (+69.1%)
Stop Loss Zone: $0.2450 – $0.2460
✅ Trade Setup
Entry: $0.268 – $0.270 (current zone)
Stop Loss: $0.245 (below key support) → ~9% downside
Take Profit 1: $0.317 (short-term Fibonacci target) → ~18% upside
Take Profit 2: $0.344 – $0.368 (medium-term fib targets)
Take Profit 3: $0.392 – $0.410 (long-term stretch target)
⚖️ Risk/Reward
R/R ratio for TP1 ≈ 2:1
R/R ratio for TP2 ≈ 3:1+
Best suited for short-term swing or breakout trade.
🚨 Note: This is not financial advice — just a trade idea based on chart. Always size positions carefully and use stop-loss discipline.
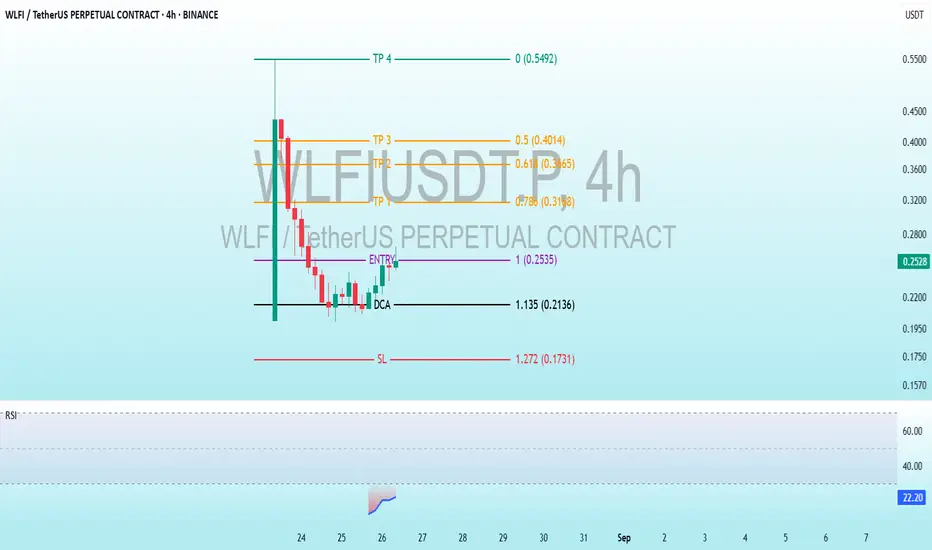
$WLFI Shocking Crash & Rebound Potential Exposed!BINANCE:WLFIUSDT.P
Entry Level: Marked at 1 0.2535 0.2560 USDT, indicating the intended entry point for a long position.
DCA (Dollar Cost Averaging): Set at 1.135 (0.2136) USDT, suggesting a level to add to the position if the price dips further.
Take Profit (TP) Levels:
TP1: 0.786 (0.3198) USDT
TP2: 0.618 (0.3665) USDT
TP3: 0.5 (0.4014) USDT
TP4: 0.0 (0.5492) USDT
Stop Loss (SL): Set at 1.272 (0.1731) USDT, above the entry to limit potential losses.
The price has dropped significantly below the entry and DCA levels, suggesting the strategy may need adjustment or that the stop loss has been triggered.
Technical Indicators
RSI (Relative Strength Index): The RSI at the bottom shows a sharp decline, moving into oversold territory below 30 (23 - 24). This indicates the price may be oversold and could see a potential reversal or consolidation soon.
Observations
The take profit levels are structured with decreasing targets, indicating a strategy to secure profits as the price moves lower from the entry.
The RSI entering oversold territory aligns with the sharp price drop, hinting at a possible bounce or stabilization if buying interest returns.
Conclusion
The chart outlines a trading strategy with a defined entry, stop loss, and multiple take profit levels for a long position in WLF/USDT perpetual futures. The significant price drop and oversold RSI suggest the price may be nearing a support level, potentially offering a buying opportunity near the current price or DCA level if bullish momentum resumes.