WTC to bounce of Support levels!!! 2/2Hello guys,
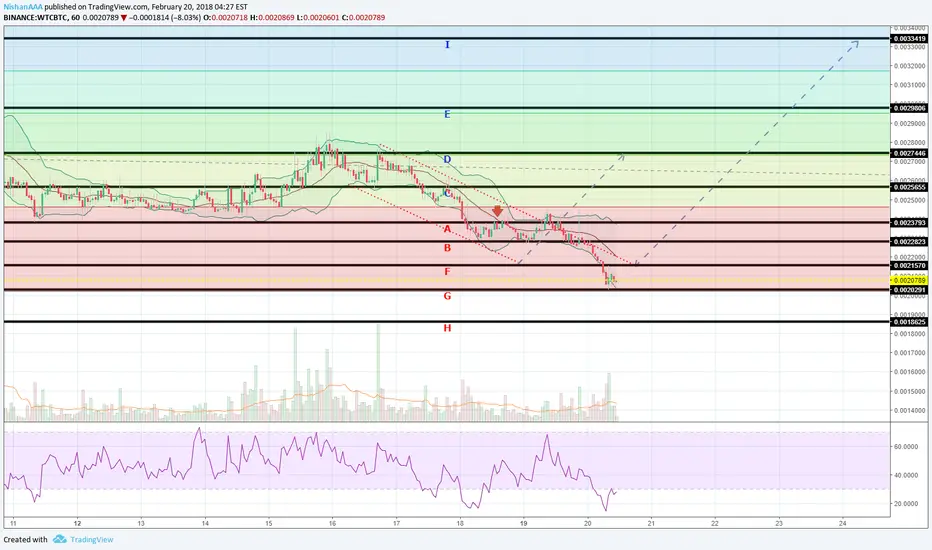
Prediction on WTC Walton of bouncing Support level "F" and start the UP-TREND wasn't successful, which means that WTC is steal flowing in a Bearish Scenario. This morning chart was pointing newer Lows, reaching Support level "G", but then we started see some slow movement Upwards. Fib showing us that we are in the bottom of the Bear market, which leads me to the conclusion, that this is last Support line we will discover, before the UP-TREND be formed and price regained.
I've marked with an Arrow where I've opened my position which is around - 0.0023893 WTC / BTC, which is one of the golden points according to FIB.
This is not a financial advise.
Happy Trading
WTCBTC
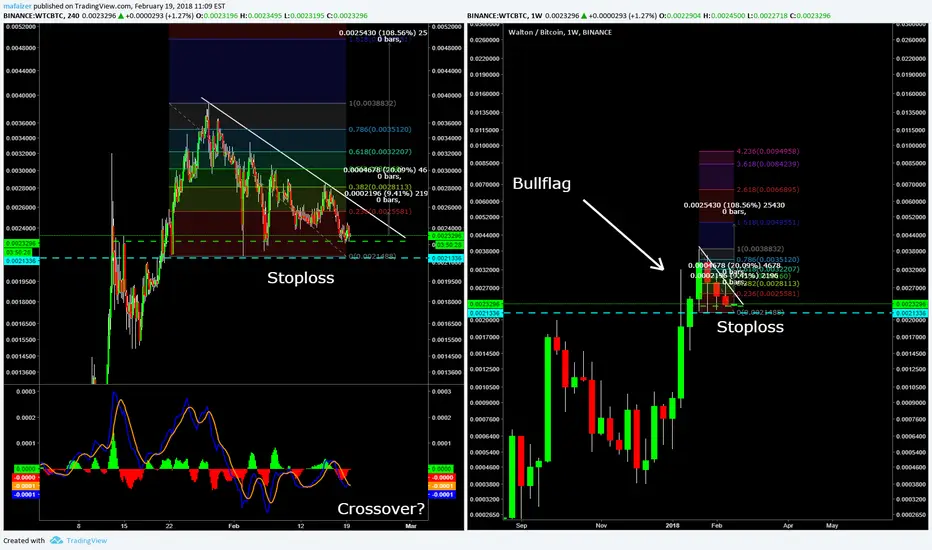
WTCBTC Binance Good Long position (Good profit potential)Walton is currently resting at support levels, which makes this a great buy opportunity with great profit potential.
If you can handle holding for a couple of weeks, we could potentially see a 100% increase in price if we follow the fibs like we did last time.
If you hold for a couple of days we will most likely see 20% or more.
Stop loss about 10% from current price, puts it behind some big sell walls.
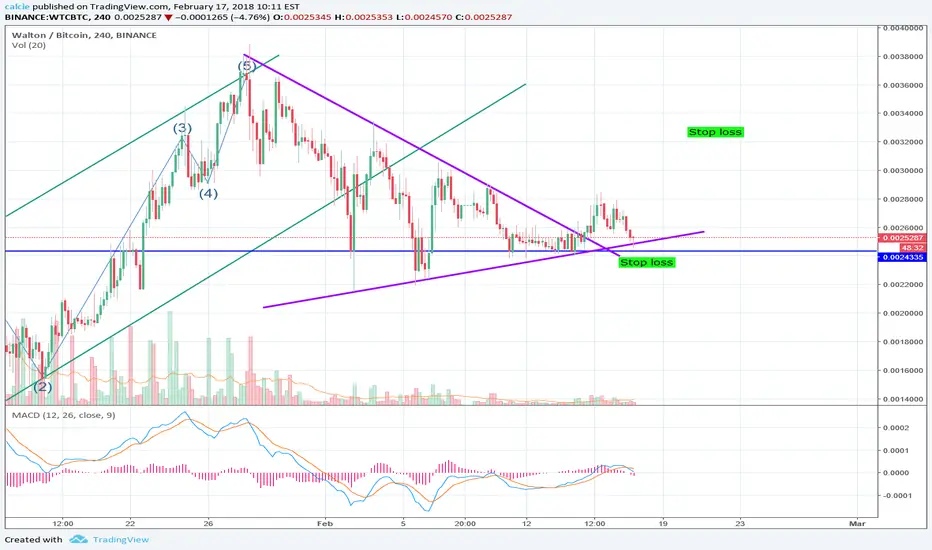
WTC long pt 2The bitcoin pump got me stopped out of my last WTC trade (link below).
Re-entering my position now as its pretty clearly at an obvious support level.
Stop-loss: 222K.
Targets: Same as previous idea :).
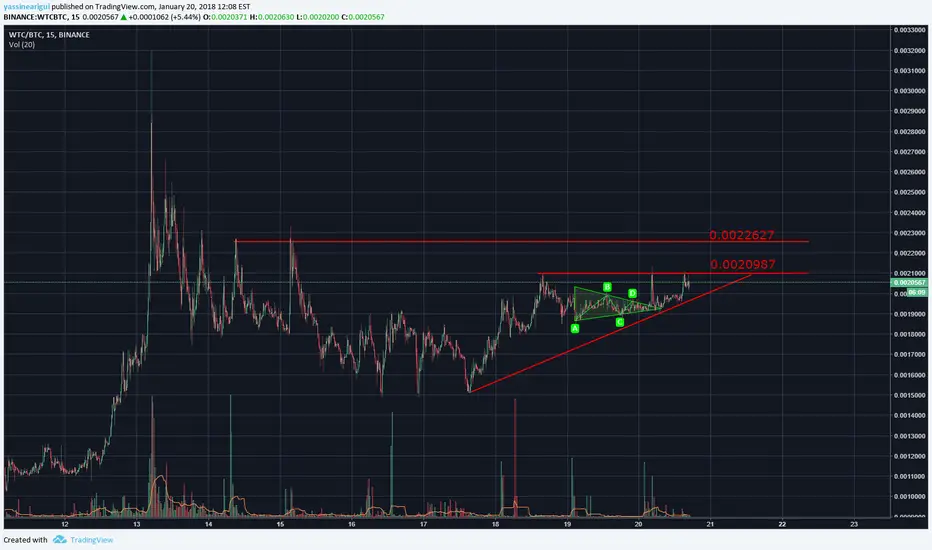
WTCBTC 8+ Risk/Reward with 10% Risk.Triangle, broke out to upside and bounced off of resistance now turned support. will buy on buy volume increase.

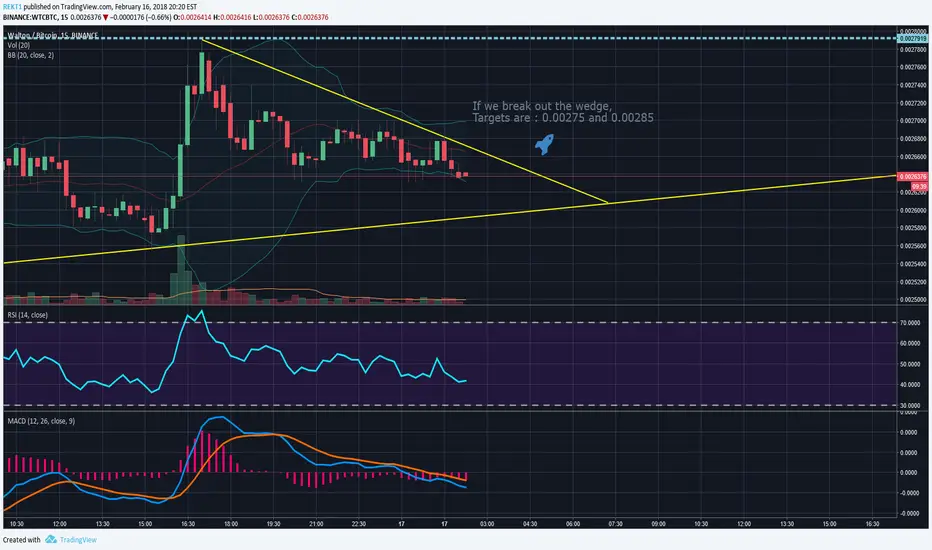
WTC - Walton - Short term, potentional Breakout.WTC is accumulating pretty hard lately and it should pop-up really soon, we are currently in the wedge and just bounced off support, you can start layering your buys and wait for a break out. Will update the targets later on.

WTC - Walton - Short term - About to break out.WTC is going to test resistance and probably potentional break out - targets are noted in the graph follow for more updates.
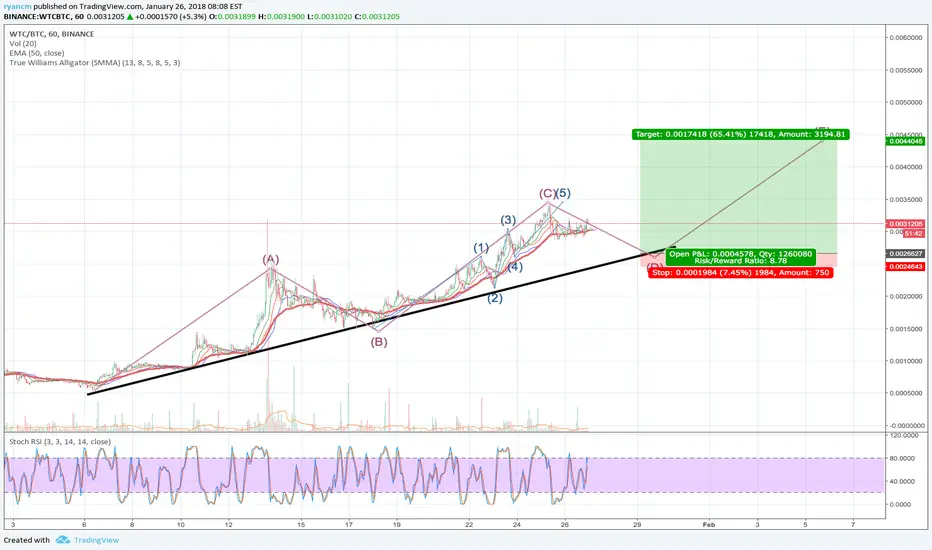
WTC ready for re-entryI want to lead this off by saying I only enter swing plays on positions I feel confident in long-term as well (never subscribing to greater-fool). WTC is a solid project and a great competitor to VEN. However, this trade is based off pure technicals.
First, let's look at WTC's recent bull run, which followed an almost textbook 5 wave pattern with a 3 wave retracement. If you zoom out even more you'll see this bull run was actually the completion of textbook "cup and handle" pattern, where the run was the break out of the handle.
Now that we have retraced back to the peak of the first wave you can see we are breaking out of the descending action and crossing several moving averages in the process. The indicators are very bullish and confirming on multiple time frames. I'm not going to go into too much detail on this, as I feel the technicals speak for themselves.
Side note, I entered aggressively this morning at approximately 272K satoshi but have been a bit too busy at my real job to post. Sorry!
Entry: break of 275K satoshi on a bullish move.
Stop: 265K satoshi
Target 1: 320K satoshi
Target 2 (if we bull through 320K satoshi): 375K satoshi
Target 3 (if you are a medium-term trader, as this will be a while): 450K satoshi

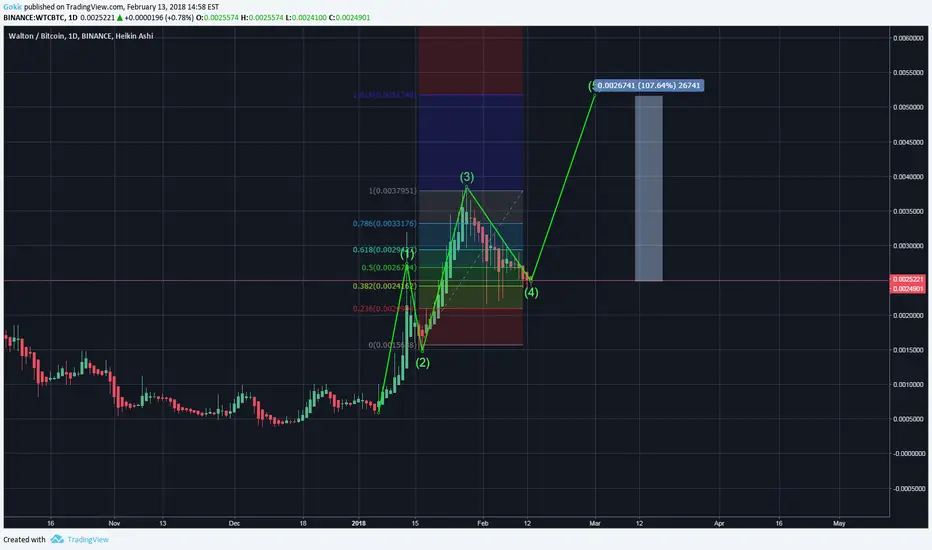
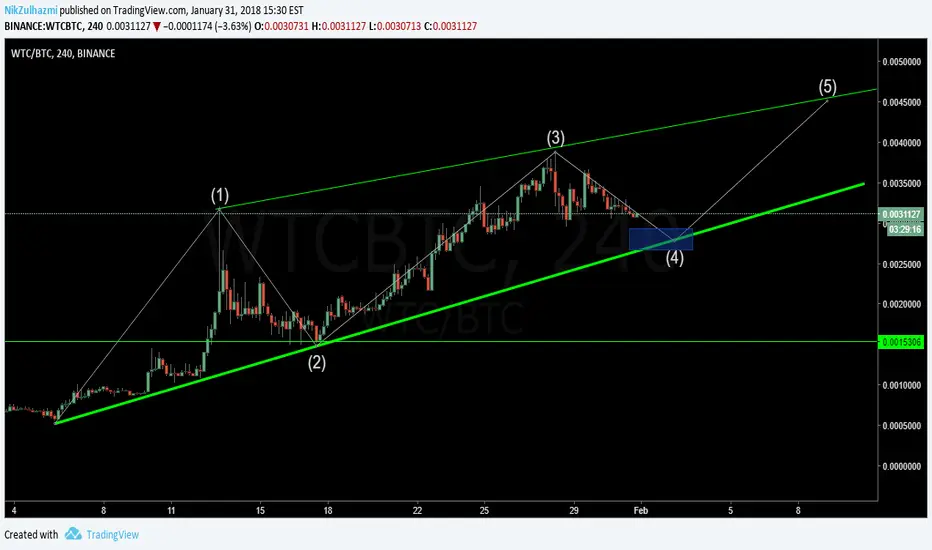
Walton - WTC - Round 3Walton ended with correction. Now in good position to go up on wave 3 with nice 107% potencial.
Entering point allready made at about 21800 satoshis.
Target 51000
WTC bullish falling wedgeWalton showing bullish falling wedge pattern.
Waiting for it to enter my buying area.
WTC - WALTON WILL HIT 0.003000000 THIS WEEKENDI presume BTC will bounce down from 9500
So,
WTC>
Buy around 265-270
Sell around 300

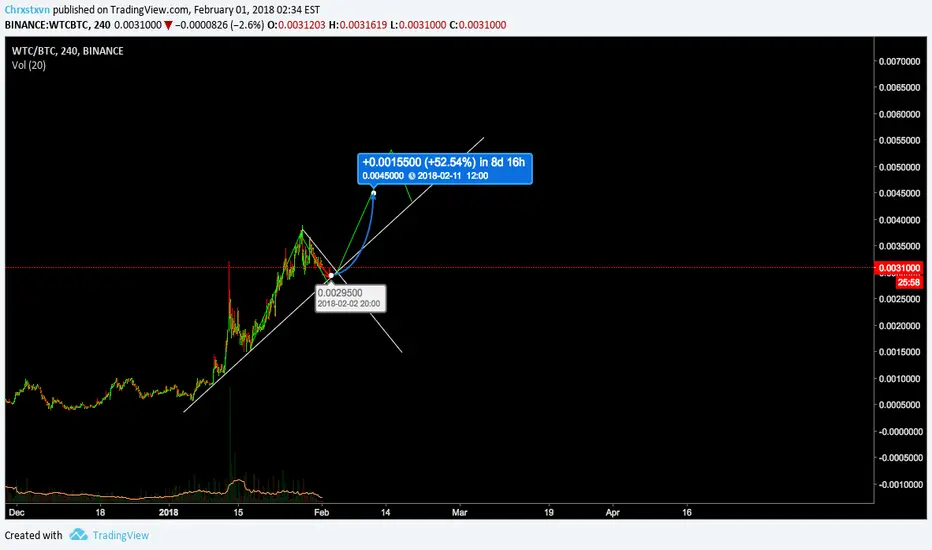
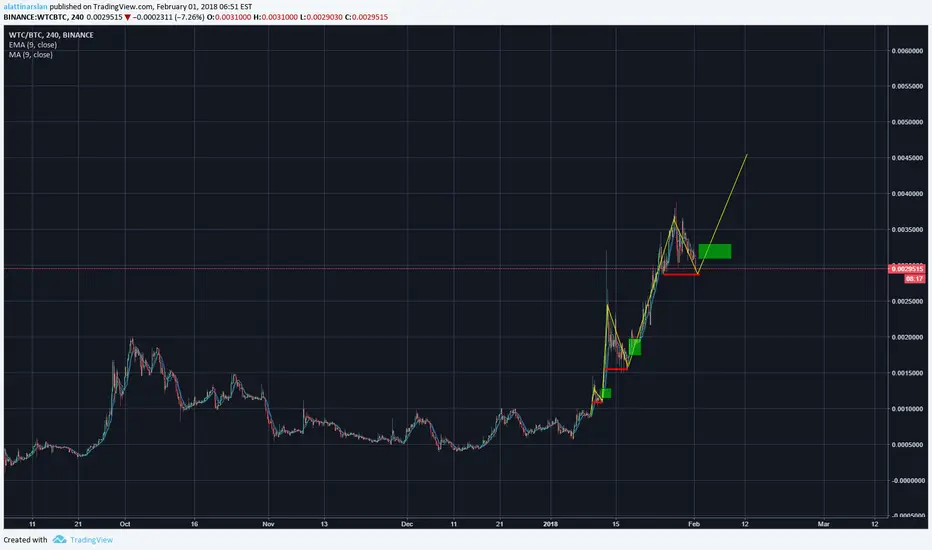
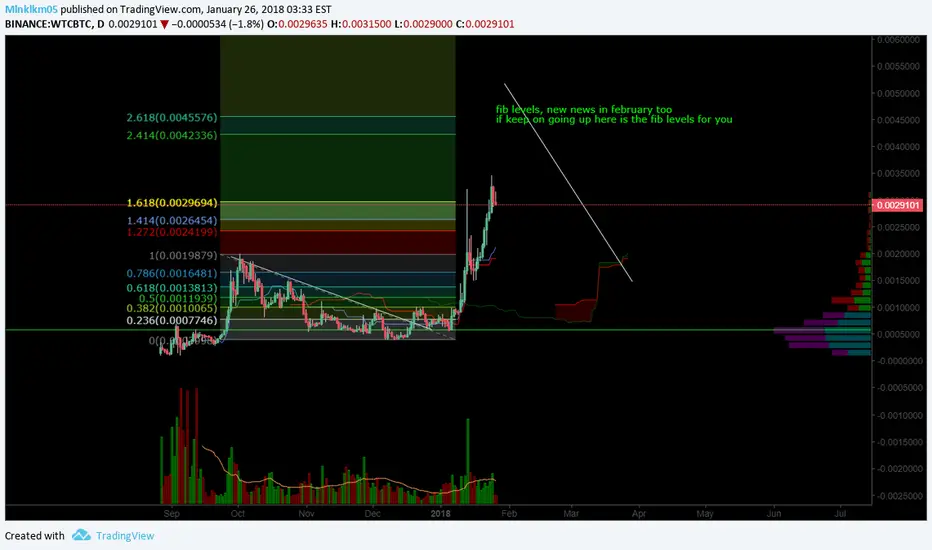
WTC Trend - Possible 50% Gain - 1 week timeframeI do not own BINANCE:WTCBTC but would like to see how this plays out. This is not trading advice - i am simply trying to analyse some trends.
$WTC has been killing it lately and is following a similar trajectory to BINANCE:VENBTC ( see my $VEN chart here) .
The masternode release should be by the end of February, and $WTC keeps releasing great partnership news which helps keep sentiment and volume in the market.
As with all of these cryptos, the king rules them all - If we see BTC dip below 9k USD I think this trend may break and could lead to a break down rather than a breakout.
I believe we will see the current retracement go to .00295 and then my target would be around 0.0045 to 0.005 before we see another retracement.
Walton Coin (WTC) Buy/Long PotentialHere we see Walton Coin or WTC's retracement are reaching a potential BUY zone. Follow this coin closely and let's hope it goes as planned.
Anyways, TAYOR (Trade at Your Own Risk) =)
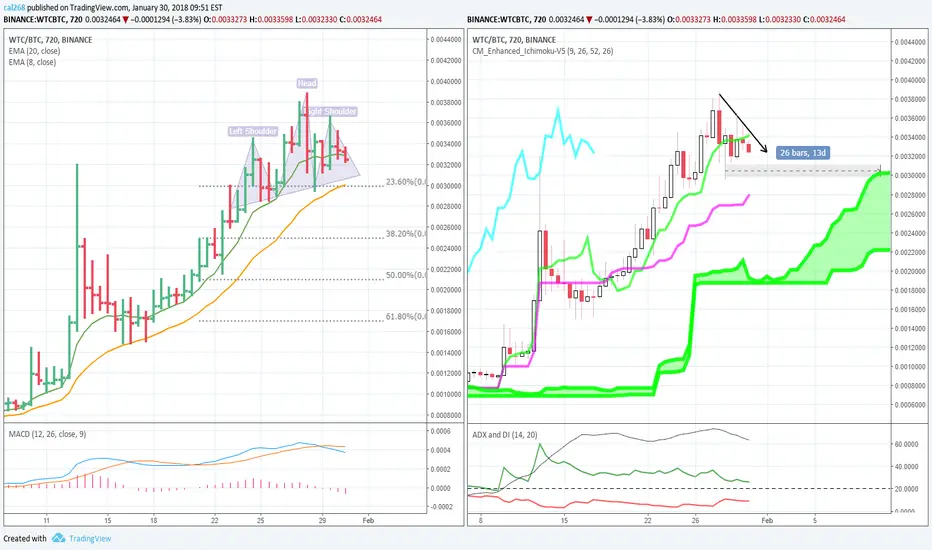
WTC/BTC H&S pattern is formingCryptocurrency Market Capitalizations Rank 35 Walton (WTC)
WTC/BTC is going to retest Fib Ret 23.6% level again due to the formation of H&S pattern at this moment.
The Fib Ret 23.6% coincidently the same support level of the green ichimoku cloud.
Therefore keep an eye if the H&S pattern breakout happens near 20 EMA.
Good Luck
WTC/BTC. Binance. Time Frame 1h.BUY:
318050 - 32223 Satoshi
SELL:
Target 1: 330435 Satoshi
Target 2: 338647 Satoshi
Target 3: 350338 Satoshi
Target 4: 365230 Satoshi
STOP-LOSS:
321063 Satoshi
It's just my Imagination. GOOD LUCK!

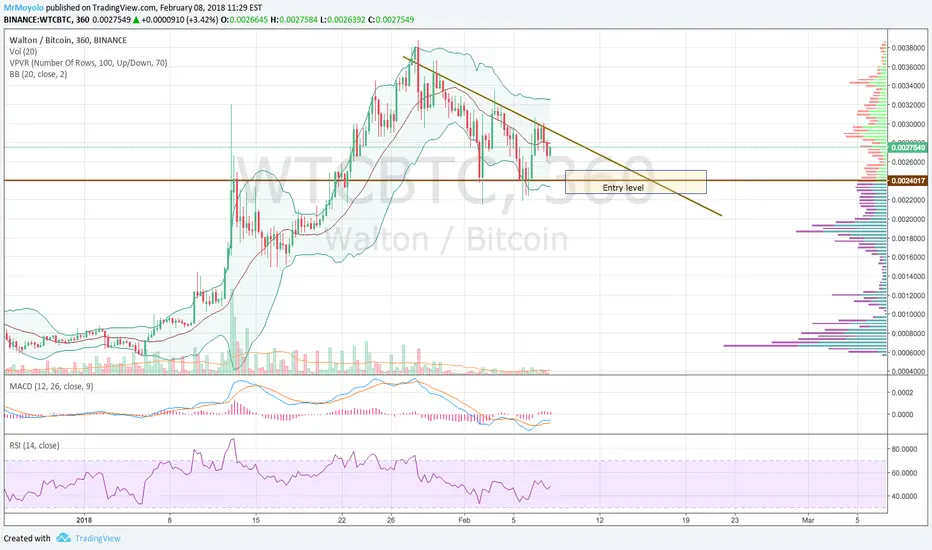
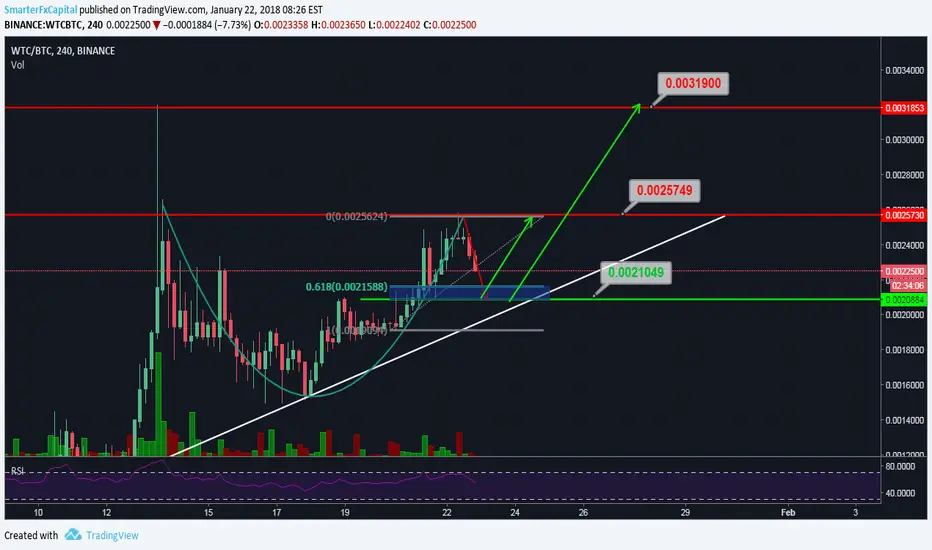
WTCBTC buying opportunityWTCBTC forming some cup and handle pattern. Technically this is a sign of a bullish movement.
Watch price around 24019sats as a good entry point where 61.8%fibs and a strong support is also present. Look for more other confirmation around on the lower timeframe.
Trade safe and dont use money you cannot afford to lose.
wtc/btc confirmed cup & handle, possible pullback aheadwtc/btc confirmed cup & handle, possible pullback ahead
Walton making a moveSo WTC has filled in a bearish broadening wedge which looks very much like the first ascent we made breaking through the first broadening wedge in what was the first wave. At current price levels we are currently touching intermediate trendline (possible entry point) and will likely bounce back into the tip of the second wave making a 162% increase from the first one if we follow the golden ratio. After which we could come back and test longer term trendline (thicker black line).
These arrows are simply the broad strokes, of what i think the midterm price action will look like. Obviously if the price breaks mid or long term trend lines it could be a reversal.
Waltcoin LongFirst idea, and fist set of TA skills applied so please leave your feedback, it'd be greatly appreciated!
Waltcoin is on the 4th leg of a 5 wave Elliot wave / cycle. It has good support from the EMA (50 days) and there is a support trend line which each wave has pushed up off. Few more days until it start going up again, maybe already?
$WTC +20% to expectBefore the big resistance, 10% profit to do
Resistance can broke very quick
After resistance, that's what the Cryptoworld call "Moon"
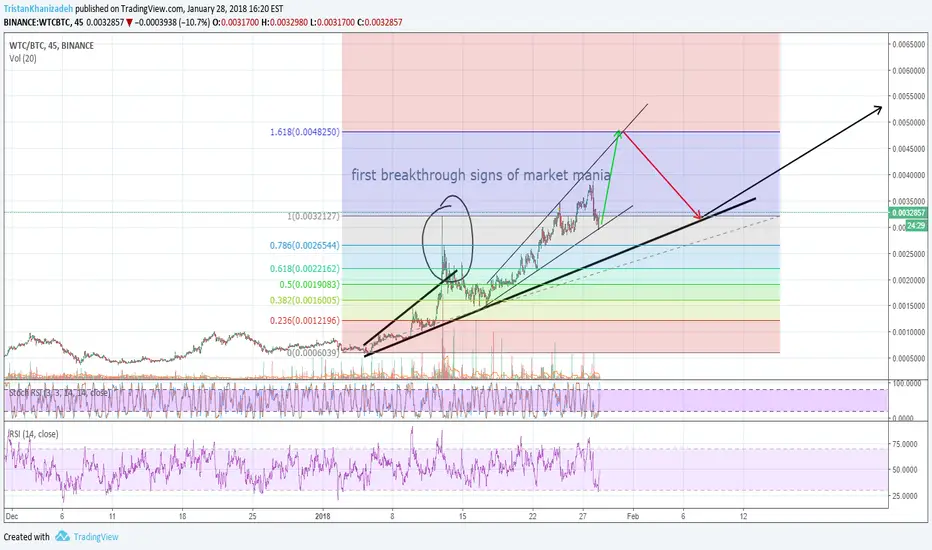
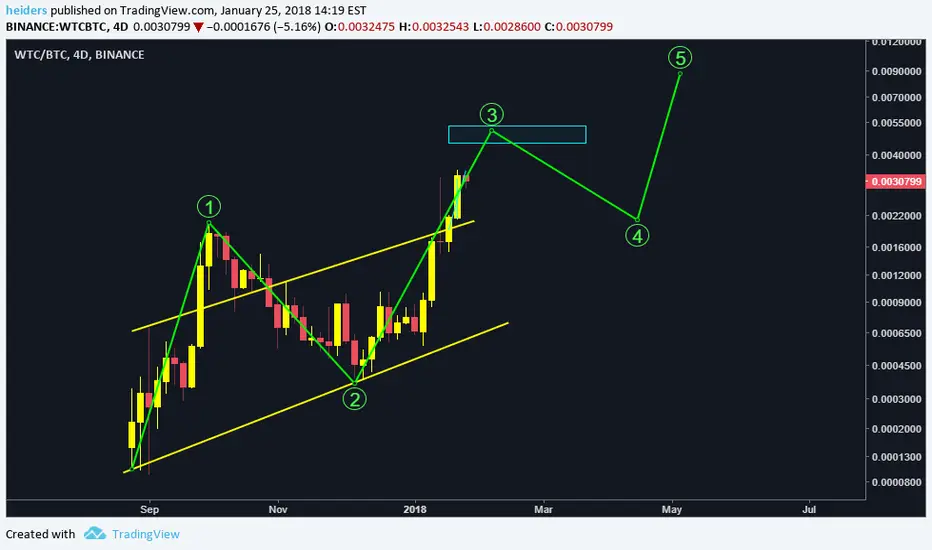
Waltonchain: The bigger pictureWaltonchain has been a longterm favorite of mine. Anyone who read my Vechain analysis knows I'm very bullish on blockchain + RFID projects and WTC is probably the first project that started in this area. I named Vechain the louder younger brother (but with great potential), making Waltonchain the wiser, older brother. The reason for this, is that WTC does not hype. They just drops bombshells of announcements in passing, without really putting any emphasis on them. Several times they just mentioned something in Slack and nobody grasped the full meaning of it, untill someone really decided to dig deeper and then found out about another great partnership. The team just did not really care about Western marketing and fully focussed on developing. And that is where Waltonchain shines.
Their fundamentals are about the strongest I have seen during my time in crypto. They developed their own RFID chips that are perfectly designed to work with the blockchain and they own around 7 patents (and more pending) about this technology. They came up with the idea of Guardian Masternodes that rewards early investors if they locked up their coins before 10 December 2017. This in fact removed a major portion of the circulating coins from the market, greatly reducing the supply, while demand increased. I could go on about the fundamentals of WTC, but please, if you are interested in RFID + blockchain do some own research about WTC and you will quickly join me. The best part is, is that they are only now starting to focus a bit more marketing on the Western world, so they are still relatively under the radar here.
Looking at the chart, we can see that WTC already made a big move in September. At that point the China FUD started and WTC corrrected quite deeply. But now we picked up the pace again and are in the middle of Leg 3 and we have made new ATHs. At this point we are consolidating a little before we have the final push up after which we might see a correction again. However, there is a lot of upcoming excitement for WTC (i.e. conference, rebranding, mainnet) so the correction to 4 might be much shorter than we have seen from 1 to 2.
After that; moon.
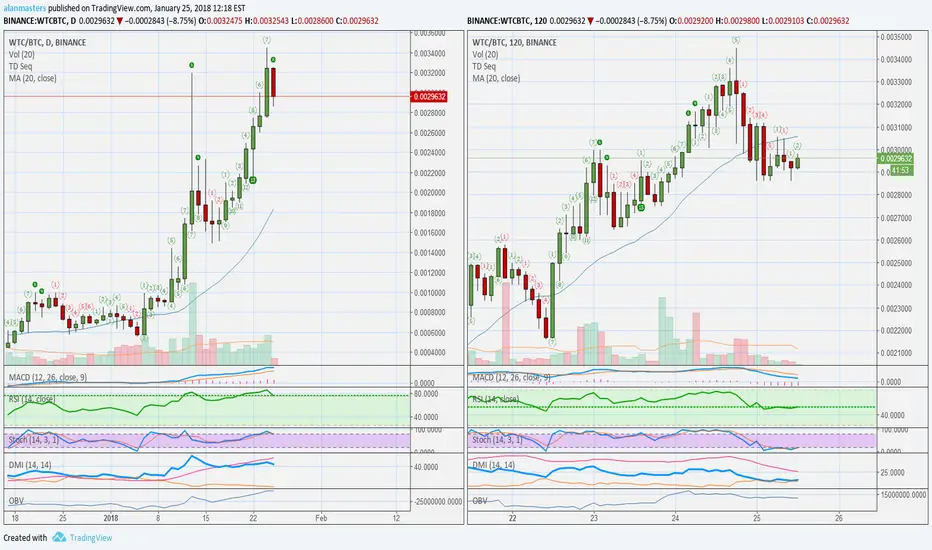
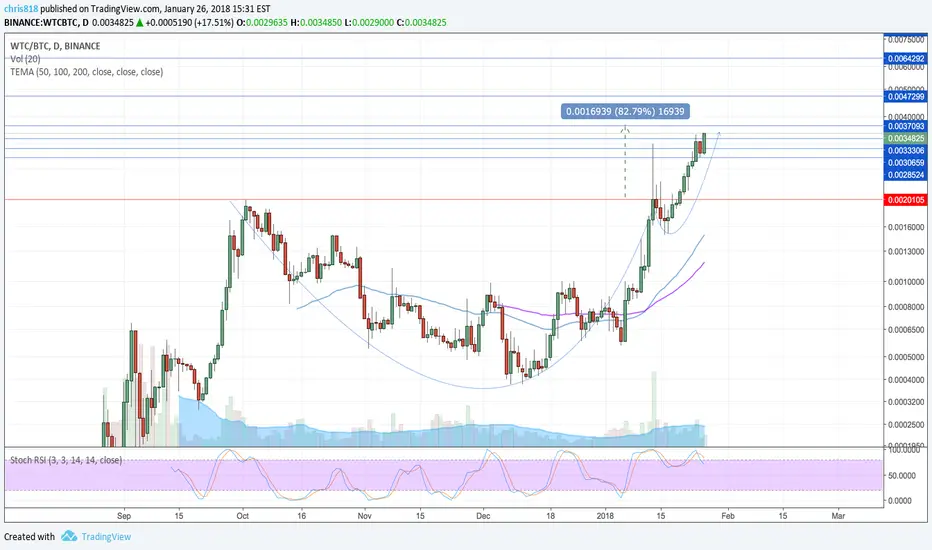
Walton (WTC) Is This The Top? (Binance coin)Walton (WTC) Chart Analysis
The daily chart looks pretty good but WTC might be running out of steam. This coin is #39 in the Top100 cryptocurrencies by market cap. A very strong coin.
Walton (WTC) reached a new all time high yesterday on Binance @ 0.00345. After reaching a new all time high we normally retrace. Let's see what the charts have to say.
>>> Analysis
- Today's candles looks like a classic retrace. To know if this will be just a small retrace or a correction we will need more time.
- The indicators are on the bullish zone but turning bearish (curving down), which is an indication of loss of momentum. This is true for the MACD, RSI, STOCH, DMI & OBV.
- On the shorter time-frames, 1h, 2h and 4h charts, the retrace is already underway, but it doesn't look like a correction, so far it looks like a retrace with a support found, where we can accumulate for another run up (another test of the last all time high). This of course can change anytime as this information is based on 1-4 hours candles, so these signals vary very often.
- The weekly chart is bullish, but the candles are telling me that some consolidation is needed. Not enough information for the indicators but things are good overall.
>>> Notes for trading WTC
If I was looking at this coin from the sidelines, I would wait to see when a strong support is found. You can look for this on the 4hours chart or any chart you enjoy for a period of several days.
If I were already in this coin, I would be selling good portions of my stack, specially depending on my buy in price. With a 500% increase in the last 20 days, a retrace is something completely normal and even expected.
Use this information to your advantage. This chart is young, right now anything is possible, so trade at your own risk.
Thanks for reading.
Namaste.
P.S. I hope you enjoy this trade idea.