Middle East Tension & Markets: My Honest Stance🌍🕊️✌️ Middle East Tension & Markets: My Honest Stance 💣 🔥 🗡️
Hi everyone,
It’s Friday, June 20th — and we face a fragile moment: the uncertainty of possible US military action against Iran. 📉📰✈️
On my charts:
Bitcoin (BTC) reached key resistance and now ranges sideways as we await clarity.
Gold (XAUUSD) remains the classic safe haven — it holds an ascending structure, but profit-taking could trigger dips if markets crash.
Silver (XAGUSD) is similar, yet needs broader industrial strength to outperform gold.
Crude Oil (WTI) could spike dramatically if bombs fall — but I choose not to profit from pain.
USDJPY & USD pairs reflect global trust in the dollar and US stability — I’ll cover this more next week.
My personal stance is simple:
💙 I never short disasters. I never profit from human suffering. I am LONG on humanity and peace. 🕊️✌️🌈
👉 I expect potential market gaps between now and Monday:
✅ Bad news (war) → gold, silver, oil likely pump
✅ Good news (diplomacy) → risk assets rebound, oil stabilizes
I am positioned carefully with small risk and clear stops. My goal: protect my capital, trade my plan, but never bet on pain. If I lose because peace prevails — I win as a human.
Stay safe, trade wisely, and never forget: sometimes the best trade is no trade at all.
One Love,
The FXPROFESSOR 💙
Disclosure: I am happy to be part of the Trade Nation's Influencer program and receive a monthly fee for using their TradingView charts in my analysis. Awesome broker, where the trader really comes first! 🌟🤝📈
WTI-OIL

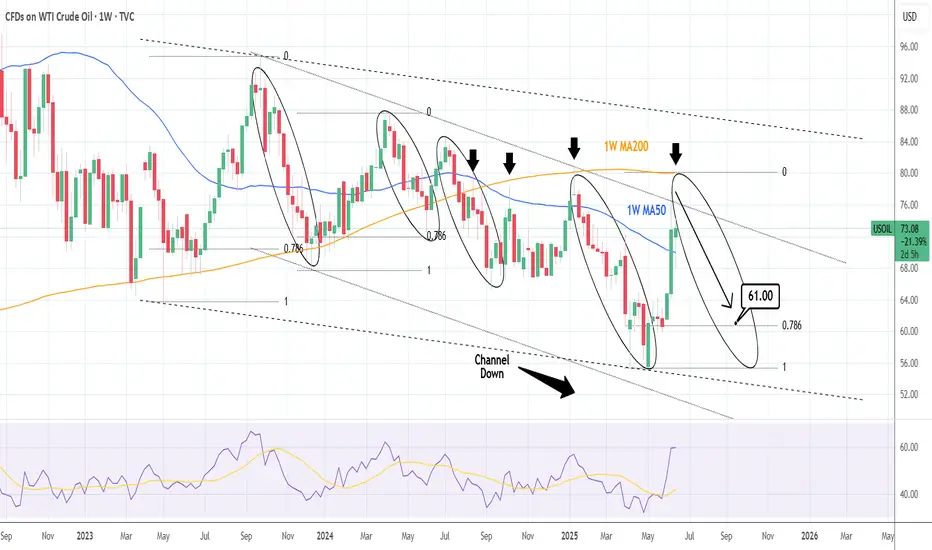
WTI CRUDE OIL: There is no better time to sell that this.WTI Crude Oil has turned overbought on its 1D technical outlook (RSI = 71.048, MACD = 2.830, ADX = 41.529) and this is technically the most efficient level to sell on the long term. Not only is that the top of the dotted Channel Down but last week the price got very close to the 1W MA200, which has produced the last 3 major rejections since the week of August 12th 2024. Technically the market still has some room to move upwards and test it but since it rose purely on the latest Middle East conflict, it is more likely than not to see an equally quick price deflation and rebalancing. The earlier bearish waves (September 2023 onwards), initially targeted the 0.786 Fibonacci level and then bounced. That translates to TP = 61.00 (at least) towards the end of the year.
See how our prior idea has worked out:
## If you like our free content follow our profile to get more daily ideas. ##
## Comments and likes are greatly appreciated. ##
Israel creates a risk-off environmentThe current geopolitical tensions continue to escalate and this is creating a risk-off environment, forcing investors to worry. Let's dig in.
MARKETSCOM:OIL
TVC:USOIL
Let us know what you think in the comments below.
Thank you.
77.3% of retail investor accounts lose money when trading CFDs with this provider. You should consider whether you understand how CFDs work and whether you can afford to take the high risk of losing your money. Past performance is not necessarily indicative of future results. The value of investments may fall as well as rise and the investor may not get back the amount initially invested. This content is not intended for nor applicable to residents of the UK. Cryptocurrency CFDs and spread bets are restricted in the UK for all retail clients.

Slowing Global Economy and Output Hikes Weigh on Brent OilBrent crude oil is holding steady around the $60 level, even after OPEC announced another 411,000 barrels per day increase in output, following similar hikes in May, June and smaller one in April. This latest adjustment comes at a time when global economic slowdown concerns are rising, making the decision a risky one. Although the main reason points to non-compliance from Kazakhstan and Iraq, some believe the United States may have played a role, possibly through pressure from Trump aimed at controlling inflation during the ongoing tariff hikes.
With several consecutive production increases now in place, a growing surplus is likely to develop over the second half of 2025. This would maintain downward pressure on oil prices if demand fails to keep pace. At the same time, the broader economic outlook is weakening. Recent manufacturing activity data from China, the United States, the European Union, and the United Kingdom all came in below 50, suggesting a faster rate of contraction. The presence of widespread tariffs is expected to continue weighing on business sentiment and consumer demand, potentially leading to rising unemployment and slowing growth.
In this environment, any short-term spikes in Brent and WTI prices are likely to remain opportunities to sell, unless there is a meaningful shift in underlying fundamentals. For a more detailed view of economic trends, please refer to the latest monthly report.
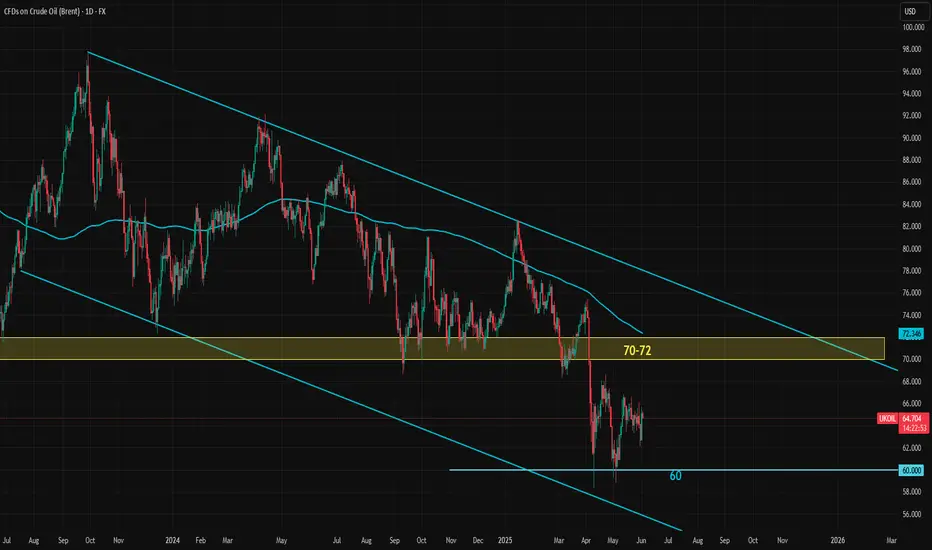
Brent crude has been in a steady downtrend since March of last year. While the price movement doesn't follow a perfect trend channel, the structure has generally held well. At the moment, Brent is hovering near the middle of this declining channel.
The former long-term support zone around $70 to $72. If prices move up toward this zone, it could present a fresh selling opportunity as long as the resistance holds. On the downside, the $60 level and the area just below it have formed a solid medium-term support, which has held up so far.
Still, oil bulls should be cautious around the $60 mark. Even though support looks strong for now, the overall direction of the trend and the broader fundamental backdrop suggest that this level could eventually break. Any long positions taken near current levels should factor in the potential for renewed downside pressure.
What to expect from WTI oil in the near term?We are currently not doing anything with WTI oil, but monitoring it very closely.
Let's dig in!
TVC:USOIL
MARKETSCOM:OIL
Let us know what you think in the comments below.
Thank you.
77.3% of retail investor accounts lose money when trading CFDs with this provider. You should consider whether you understand how CFDs work and whether you can afford to take the high risk of losing your money. Past performance is not necessarily indicative of future results. The value of investments may fall as well as rise and the investor may not get back the amount initially invested. This content is not intended for nor applicable to residents of the UK. Cryptocurrency CFDs and spread bets are restricted in the UK for all retail clients.

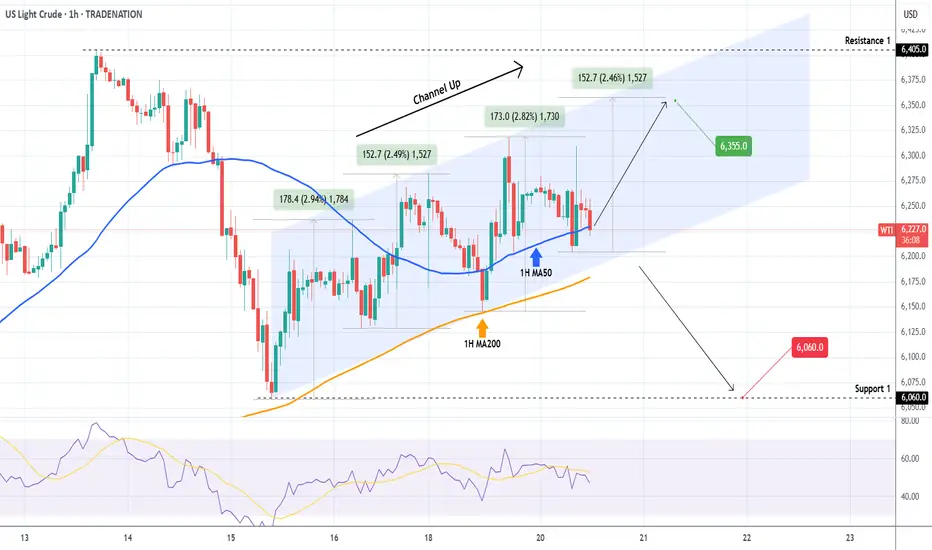
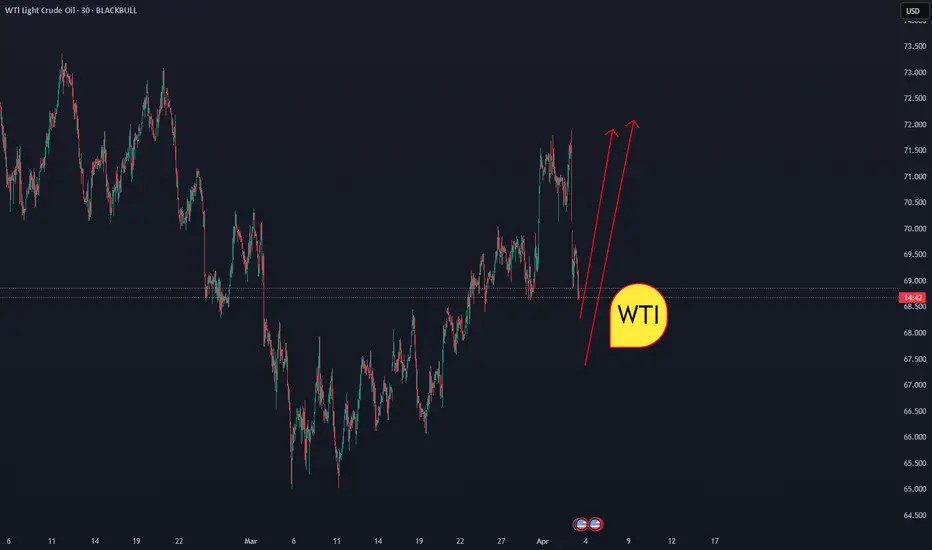
WTI OIL 1H Channel Up make or break Targets.WTI Oil (USOIL) has been trading within a Channel Up on the 1H time-frame that is supported by the 1H MA200 (orange trend-line). As long as this holds, we expect another +2.50% Bullish Leg (at least), which gives a Target of $63.55.
If the price breaks below the 1H MA200 though, we will take this small loss on the long and go short instead, targeting Support 1 at $60.60.
-------------------------------------------------------------------------------
** Please LIKE 👍, FOLLOW ✅, SHARE 🙌 and COMMENT ✍ if you enjoy this idea! Also share your ideas and charts in the comments section below! This is best way to keep it relevant, support us, keep the content here free and allow the idea to reach as many people as possible. **
-------------------------------------------------------------------------------
Disclosure: I am part of Trade Nation's Influencer program and receive a monthly fee for using their TradingView charts in my analysis.
💸💸💸💸💸💸
👇 👇 👇 👇 👇 👇
TA on WTI Oil - 2025.05.14Quick technical analysis on WTI oil.
Let us know what you think in the comments below.
Thank you.
77.3% of retail investor accounts lose money when trading CFDs with this provider. You should consider whether you understand how CFDs work and whether you can afford to take the high risk of losing your money. Past performance is not necessarily indicative of future results. The value of investments may fall as well as rise and the investor may not get back the amount initially invested. This content is not intended for nor applicable to residents of the UK. Cryptocurrency CFDs and spread bets are restricted in the UK for all retail clients.

WTI - Technical Setup Points to April HighsThe US Light Crude chart is displaying promising bullish momentum after establishing a significant double bottom at the $56 support zone. Following a sharp recovery from recent lows, the price has broken above key resistance levels and is currently trading around $61,27 with the green arrow indicating potential continuation to the upside. Technical patterns suggest there is a higher probability that crude oil prices will extend this rally toward the local top formed on April 23rd near $65, completing a broader recovery pattern. With strengthening momentum indicators and improved market sentiment, this upward move appears well-supported, especially if crude can maintain position above the current consolidation range and continue forming higher lows on the daily timeframe.
Disclosure: I am part of Trade Nation's Influencer program and receive a monthly fee for using their TradingView charts in my analysis.

Hellena | Oil (4H): SHORT to support area of 54.00.Friends, what do we see after the recent downward movement? Most likely we see a continuation of the downward movement in a combined correction.
The hardest thing about compound corrections is to understand where the wave ends and begins.
I believe that the price is now in the middle wave “C” and will continue the downward movement to the target of 53.991.
Wave “B” is likely to reach the 60.00 area, but I do not recommend long positions. Work with pending limit orders.
Manage your capital correctly and competently! Only enter trades based on reliable patterns!

Hellena | Oil (4H): SHORT to support area of 55.204.Colleagues, I believe that the price will continue its downward movement. At the moment we are observing a combined correction. I expect the completion of wave “Y”. Even if it is already completed, the price is still waiting for a downward correction to the support area of 55.204. Therefore, I think that 55.204 is the 1st minimum target.
There are two possible ways to enter the position:
1) Market entry
2) Pending Limit orders.
Manage your capital correctly and competently! Only enter trades based on reliable patterns!

OPEC Cuts Oil Demand Forecast While Increasing SupplyOil prices are feeling bearish pressure. OPEC was unable to increase production significantly last year to stabilize prices. High interest rates have kept global economies cool enough. However, starting in May, OPEC will begin unwinding its voluntary production cuts. The timing of this decision is questionable. Tariffs are expected to hit global economies hard, while the Fed is likely to hold rates steady for a few more months. Recession risks in the world’s two largest economies, the U.S. and China are rising.
OPEC has acknowledged this trend by lowering its oil demand forecast for 2025 and 2026 by nearly 10%.
If summarized:
Oil demand is expected to fall 10%, possibly more if the U.S. and/or China enter recession.
Trump is expected to boost U.S. drilling, increasing supply.
OPEC will start to unwind supply cuts, increasing supply.
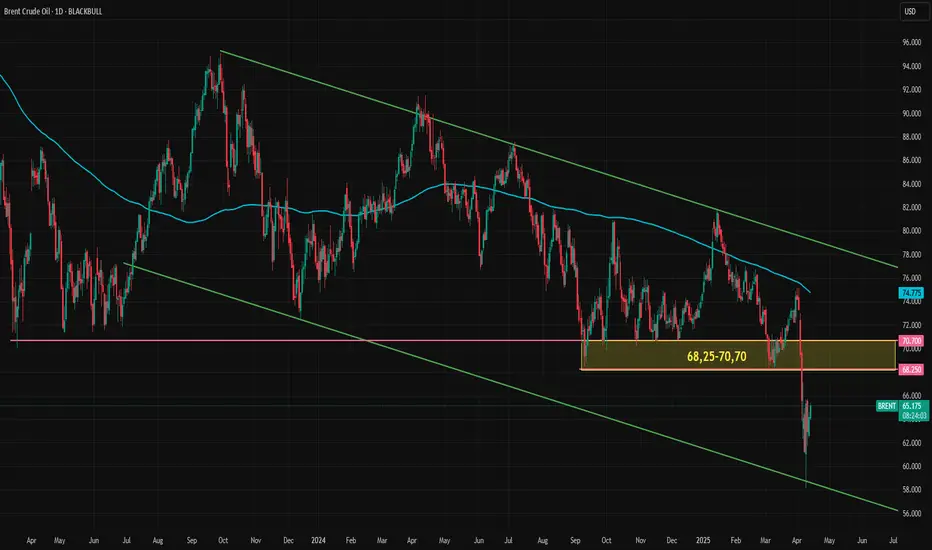
Brent is likely to remain under bearish pressure throughout the year because of rising supply and falling demand. As long as the current fundamental outlook remains unchanged, upward moves should be viewed as selling opportunities. A downtrend channel has formed since mid-2023, with the lower boundary recently tested. There is now an upward reaction. If this continues toward the 68.25–70.70 zone—previously a demand zone, now a potential supply zone—traders may look for short entry setups, provided this zone holds, with nearby stop-loss levels.
WTI gets a boost, but is this really enough?We saw yesterday the positive reaction due to the pausing of tariffs. However, because of the economic uncertainties and OPEC+ production increases, the price of TVC:USOIL may see more downside.
Let's dig in.
MARKETSCOM:OIL
Let us know what you think in the comments below.
Thank you.
77.3% of retail investor accounts lose money when trading CFDs with this provider. You should consider whether you understand how CFDs work and whether you can afford to take the high risk of losing your money. Past performance is not necessarily indicative of future results. The value of investments may fall as well as rise and the investor may not get back the amount initially invested. This content is not intended for nor applicable to residents of the UK. Cryptocurrency CFDs and spread bets are restricted in the UK for all retail clients.

WTI / OIL PoV - Break Point 65$ / 62$ / 47$ LONG The price of oil has recently undergone a significant retracement, dropping to its lowest levels in the last three months. This decline has been influenced by several factors, including trade tariff policies and decisions made by OPEC+.
In March 2025, the price of Brent crude fell below $70, touching a low of $69.76, its lowest since September. In New York, West Texas Intermediate (WTI) lost 1.64%, reaching $67.24. New tariffs imposed by the Trump administration on imports from Canada and Mexico have fueled uncertainty about international trade, raising concerns that global economic slowdown might cause oil demand to fall behind supply.
Additionally, OPEC+ decided to increase production by 138,000 barrels per day in April, with the goal of reaching a production level of 2.2 million barrels per day by 2026. This decision contributed to an oversupply that could negatively affect prices, especially if economic growth slows.
Trade tariffs have had a direct impact on the oil market. In February 2025, China imposed a 10% tariff on U.S. crude oil in response to U.S. tariffs, contributing to the drop in oil prices to their lowest levels of the year. Additionally, U.S. crude oil inventories increased beyond expectations, indicating further weakness in demand.
Geopolitical tensions, such as the U.S. proposals to take control of Gaza and the intention to strengthen sanctions on Iran, have added further uncertainty to the market, affecting consumer and investor confidence.
Regarding the price levels you’ve identified for potential purchases, it's important to note that the oil market is influenced by a combination of geopolitical, economic, and supply factors. The support levels at $65, $62, and $57 that you've pointed out may represent significant technical levels, but it’s crucial to monitor geopolitical developments and trade policies that can affect price volatility. It is advisable to consult up-to-date sources and market analysis before making investment decisions.
WTI OIL Ultimate long-term guide.WTI Oil (USOIL) has a tendency, like a number of key traditional assets, to follow long-term Cycles. Market psychology more times than not makes investors and the market behave in similar ways (euphoria buying, panic selling) given the same market conditions. Fundamentals and catalysts can often be used as reasons and excuses to confirm the technical trends and long-term Cycles.
Oil is no different and on this 1M time-frame analysis we see why. The dominant multi-year pattern is a Channel Down and it has started on the July 2008 All Time High (ATH). Right now it appears that we are inside a Wedge pattern similar to 2011 - 2014 and more specifically on the final Bullish Leg towards the top.
The 1M RSI sequence among those two fractals is identical so based on all these parameters we believe WTI will test $90.00 by late 2025 - early 2026 and if rejected, start a brutal long-term sell-off towards the bottom of the Channel Down and the 35.00 - 30.00 range by late 2026 as the Time Cycles suggest.
-------------------------------------------------------------------------------
** Please LIKE 👍, FOLLOW ✅, SHARE 🙌 and COMMENT ✍ if you enjoy this idea! Also share your ideas and charts in the comments section below! This is best way to keep it relevant, support us, keep the content here free and allow the idea to reach as many people as possible. **
-------------------------------------------------------------------------------
💸💸💸💸💸💸
👇 👇 👇 👇 👇 👇

WTI - Positioning for Upside After Anticipated CorrectionThe US Light Crude 4-hour chart shows price action currently oscillating near the $68,60 level after recovering from early March lows. The recent price structure suggests we may see a short-term pullback before a stronger upward move develops. The chart indicates a potential bullish scenario with price expected to eventually rally toward the blue reaction zone (around $69,00-$69,50) after a possible retracement. This anticipated upside move is supported by the higher lows forming since mid-March and the overall recovery pattern from the $65,67 support level (marked by the red line). A prudent approach would be monitoring for reversal signs at lower levels before positioning for the higher probability move toward the blue reaction zone, with the orange resistance at $70,77 serving as the ultimate target if bullish momentum accelerates.
Disclosure: I am part of Trade Nation's Influencer program and receive a monthly fee for using their TradingView charts in my analysis.

WTI OIL turned the 4H MA50 into Support and aiming higher.WTI Oil (USOIL) has broken above the bearish trend of the former Lower Highs and a Channel Up emerged. The 4H MA50 (blue trend-line) broke for the first time in almost a month and has now been turned into Support.
As long as this holds, we expect Oil to target the 4H MA200 (orange trend-line) at $70.
-------------------------------------------------------------------------------
** Please LIKE 👍, FOLLOW ✅, SHARE 🙌 and COMMENT ✍ if you enjoy this idea! Also share your ideas and charts in the comments section below! This is best way to keep it relevant, support us, keep the content here free and allow the idea to reach as many people as possible. **
-------------------------------------------------------------------------------
Disclosure: I am part of Trade Nation's Influencer program and receive a monthly fee for using their TradingView charts in my analysis.
💸💸💸💸💸💸
👇 👇 👇 👇 👇 👇

WTI OIL Massive 4-year Support hit. Bullish reversal ahead??WTI Oil (USOIL) hit on last week's 1W candle the 1M MA100 (red trend-line), a massive long-term Support level that has been holding since the week of April 26 2021, i.e. almost 4 years.
At the same time, the price entered the 2-year Support Zone, which has produced all major Bullish Phases (green Rectangles) during this time span. The last one got rejected twice on the 1W MA200 (orange trend-line).
Given the fact that this most recent rejection formed the current 2-month Bearish Phase (red Rectangle), which even based on 1W RSI terms, is similar to all previous Bearish Phases that found Support on the 2-year Support Zone, we have a massive long-term Support Cluster in front of us.
Naturally, until the 1W MA200 breaks, that should be the first Target of any buy attempts. As a result, we expect $80.00 to be tested by June 2025 the earliest.
-------------------------------------------------------------------------------
** Please LIKE 👍, FOLLOW ✅, SHARE 🙌 and COMMENT ✍ if you enjoy this idea! Also share your ideas and charts in the comments section below! This is best way to keep it relevant, support us, keep the content here free and allow the idea to reach as many people as possible. **
-------------------------------------------------------------------------------
Disclosure: I am part of Trade Nation's Influencer program and receive a monthly fee for using their TradingView charts in my analysis.
💸💸💸💸💸💸
👇 👇 👇 👇 👇 👇

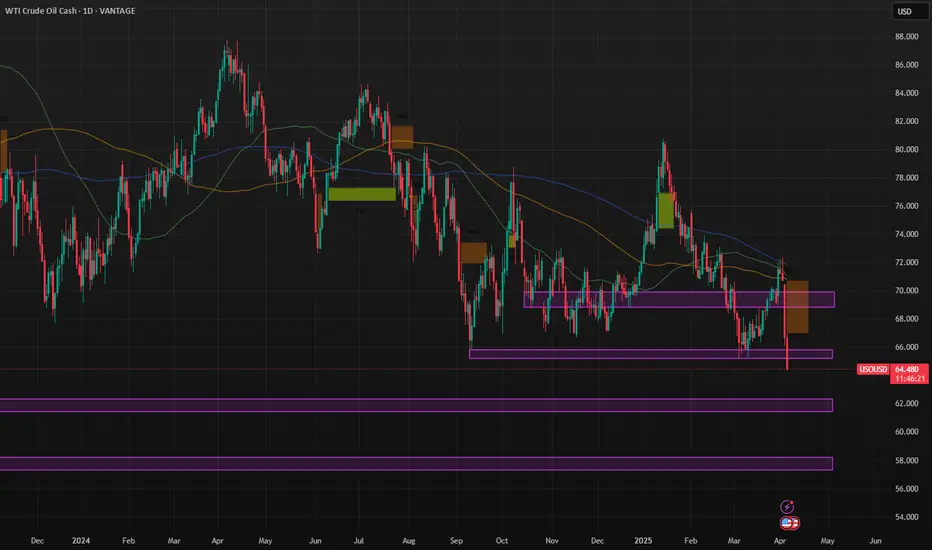
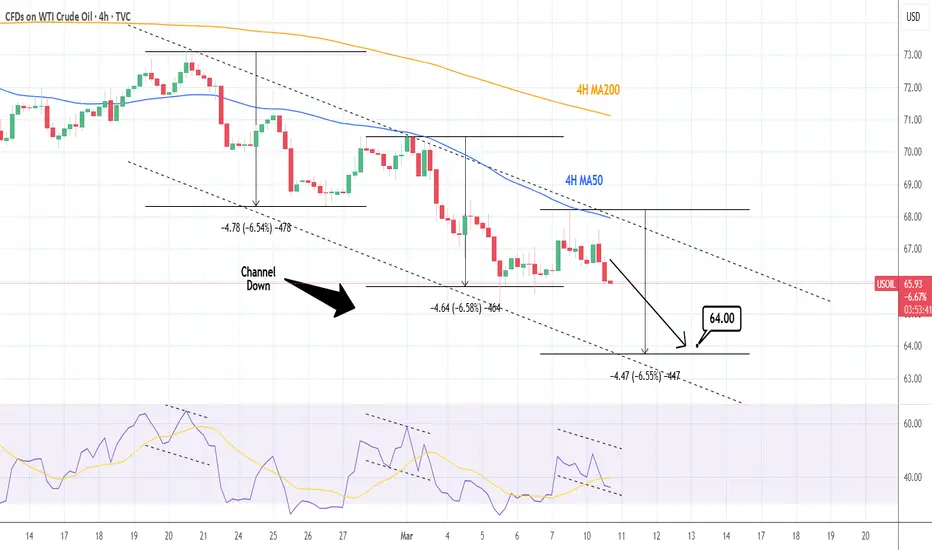
WTI CRUDE OIL: 4H Channel Down targeting 64.00WTI Crude Oil is almost oversold on its 1D technical outlook (RSI = 33.014, MACD = -1.680, ADX = 27.887) but on the lower 4h timeframe its formed a Channel Down that just completed a peak formation. This indicates that it is ready for its next bearish wave, with the previous two registering -6.55% declines. The trade is short, TP = 64.00.
## If you like our free content follow our profile to get more daily ideas. ##
## Comments and likes are greatly appreciated. ##
So far, so good... WTI oil price continues to please the bears. So far, the our stance is unchanged, we remain somewhat bearish on the price of MARKETSCOM:OIL in the near-term. That said, certain criteria still need to be met for us to get comfortable with further declines, especially from the technical side. Let's dig in!
TVC:USOIL
Let us know what you think in the comments below.
Thank you.
74.2% of retail investor accounts lose money when trading CFDs with this provider. You should consider whether you understand how CFDs work and whether you can afford to take the high risk of losing your money. Past performance is not necessarily indicative of future results. The value of investments may fall as well as rise and the investor may not get back the amount initially invested. This content is not intended for nor applicable to residents of the UK. Cryptocurrency CFDs and spread bets are restricted in the UK for all retail clients.

Crude Oil - The Manipulation of Trend LinesIn this example on Crude Oil I give some insight into how trendlines and traditional support & resistance theories may be used by "smart money" for the purposes of facilitating their positions via inducing liquidity.
Basically, trendlines are drawn along the highs or lows of price movements and help to identify the direction and strength of a trend. They serve as visual guidelines for traders, highlighting potential turning points or continuation patterns. Support and resistance levels are areas where the price historically finds a floor or ceiling, leading many market participants to place their entry and exit orders around these zones. Because these levels are based on historical price action, they hold significant psychological value among retail traders.
The Mechanism of Liquidity Manipulation
Liquidity Pools and Stop Loss Clusters:
Retail traders often cluster their stop losses near prominent support or resistance levels. Smart money is aware of these liquidity pools and can engineer price moves to trigger these stops. For example, by intentionally nudging the price through a known support level, institutional players can trigger a cascade of stop-loss orders. This “stop run” injects a burst of liquidity into the market, which can then be absorbed as positions are liquidated at less favorable prices for retail traders.
False Breakouts and Reversals:
Another common tactic involves creating false breakouts. A price move that breaks above a resistance level (or below a support level) might initially appear to signal a new trend. However, smart money can deliberately drive prices just past these technical barriers to trigger stop-loss orders and entry orders. Once sufficient liquidity is collected from the triggered orders, they may reverse the move. This reversal traps traders who anticipated a sustained breakout, leaving them with positions that quickly turn against them.
Exploiting Herd Behavior and Market Sentiment:
The widespread reliance on technical analysis means that many traders have similar expectations about where price will reverse or accelerate. This collective mindset, or herd behavior, creates predictable zones of liquidity. Smart money can capitalize on these self-fulfilling prophecies by anticipating the mass reaction around key trendlines and support/resistance levels. They use this insight to position themselves ahead of the crowd, executing large trades that move the market in their favor.
Strategic Benefits for Smart Money
By manipulating these common technical levels, smart money participants can:
Maximize Efficiency: Accumulate or distribute large positions with minimal market impact by tapping into pre-existing liquidity pools.
Control Market Direction: Influence short-term price movements to create advantageous conditions for larger trades.
Enhance Risk-Reward Profiles: Trigger stop losses at critical junctures, effectively reducing their own risk while capitalizing on forced exits from retail traders.
Conclusion
While trendlines and support/resistance are invaluable tools for assessing market structure and potential price movements, they also serve as instruments for liquidity manipulation by experienced market participants. The predictable nature of stop-loss placements and entry orders around these levels creates opportunities for smart money to trigger cascades of orders, generating liquidity in their favor. As a result, retail traders must be aware of these dynamics and consider them when planning their trades, acknowledging that what appears to be a genuine breakout may, in fact, be a carefully orchestrated move to capture liquidity.
This nuanced understanding highlights the double-edged nature of technical analysis tools in modern trading. By appreciating both their utility and potential for manipulation, traders can better navigate the complex interplay between market psychology and institutional strategy.

WTI - Will oil return to the upward trajectory?!WTI oil is located between EMA200 and EMA50 on the 4-hour timeframe and is moving in its medium-term descending channel. In case of a downward correction towards the support area, the next opportunity to buy oil with a reward at a reasonable risk will be provided to us. A valid break of the drawn downtrend line will pave the way for oil to reach the drawn areas.
Goldman Sachs has stated that even if hostilities in Ukraine cease and sanctions are eased, Russia’s oil exports are unlikely to see a significant increase. The bank believes that Russia’s crude oil production will remain capped at 9 million barrels per day, not primarily due to sanctions, but rather because of the country’s commitments under the OPEC+ agreement.
OPEC+, which is responsible for nearly half of the world’s oil production, has decided to delay its planned production increase, which was originally scheduled between April and July. Meanwhile, Trump has announced that additional negotiations with Russia are set to take place in an effort to bring an end to the war in Ukraine—an event that could impact the outlook of global energy markets.
Russia remains one of the key oil suppliers worldwide and plays a significant role in price fluctuations. Goldman Sachs predicts that the price of Brent crude will rise to $79 per barrel by the end of this month, while it is currently trading at around $76 per barrel.
Ukrainian President Volodymyr Zelensky stated that the United States has, in some ways, helped Vladimir Putin break out of his isolation. He emphasized that Trump’s team must gain a better understanding of Ukraine’s actual situation and made it clear that he has no intention of “selling” his country. Zelensky also highlighted the strength and resilience of the Ukrainian military and added that Trump’s envoy should ask ordinary Ukrainians how they perceive him following his recent statements.
Meanwhile, Vladimir Putin announced that the rapid reconstruction of the Caspian Pipeline is not feasible. He explained that Western-made equipment used in the Caspian Pipeline Consortium has sustained severe damage due to recent attacks.
Putin emphasized that the restoration of this pipeline would not be completed swiftly, as critical components rely on Western technology and have been significantly impaired.
The pipeline, which transports Kazakh oil to global markets, has experienced a 30-40% reduction in oil flow following a drone attack on one of its pumping stations in southern Russia. This reduction equates to approximately 380,000 barrels per day (bpd). This development was not entirely unexpected, as Russian Deputy Prime Minister Alexander Novak had previously stated that repairs to the pipeline could take several months.

WTI OIL on a Bearish Leg but short-term rebound expected.WTI Oil (USOIL) has been trading within a Channel Up pattern that is unfolding its latest Bearish Leg. This Leg just hit the Higher Lows trend-line from the last bottom, which is so far no different than what took place during the previous Bearish Leg on October 18 2024.
The 4H MACD sequences among the two fractals are very similar so, as the October price action did, we expect a marginal breach of the Higher Lows followed by an instant rebound above the 4H MA50 (blue trend-line) and towards the 0.382 Fibonacci retracement level. As a result our short-term Target is $74.80.
-------------------------------------------------------------------------------
** Please LIKE 👍, FOLLOW ✅, SHARE 🙌 and COMMENT ✍ if you enjoy this idea! Also share your ideas and charts in the comments section below! This is best way to keep it relevant, support us, keep the content here free and allow the idea to reach as many people as possible. **
-------------------------------------------------------------------------------
💸💸💸💸💸💸
👇 👇 👇 👇 👇 👇
