IEA trimmed oil demand for 2019By Andria Pichidi - June 14, 2019
The IEA has cut its 2019 estimate for oil demand in its latest monthly report, blaming trade tensions and the associated consequences on the outlook for global growth. The agency stated that the worsening trade outlook is “a common theme across all regions,” and that “the consequences for oil demand are becoming apparent.”
USOIL prices are presently down 0.3% on the day, at $52.12. Crude prices rallied yesterday following news that two oil tankers had been attacked in the Gulf of Oman, which the US has blamed on Iran. Developments on this front warrant close scrutiny, though for now crude looks to be remaining in the grip of an overall bear trend.
The WTI benchmark (USOIL) prices are down 3.6% w/w and by over 16% from month-ago levels. The IEA stated that US sanctions on Iranian and Venezuelan supply, and OPEC-led output quotas, along with disrupted Libyan supply, are only having a limited impact on supply, while surging US supply and increased production from Brazil, Canada and Norway would add to an increase in non-OPEC supply, estimated to be 1.9 mln bpd this year and 2.3 mln bpd in 2020.
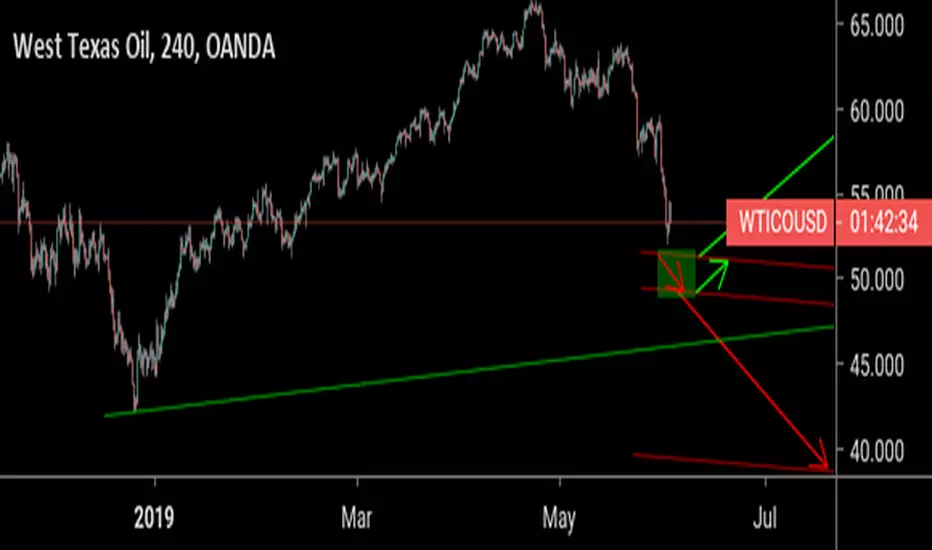
Currently in the commodity markets, USOIL is traded at the low $52 area, with lack of direction so far today but also June in general, as it bounces between $50.50-$54 range. Despite the 2-week consolidation within the range, the asset is forming lower highs this week, supporting USOIL weakness. Hence the medium term outlook remains bearish since mid April, while the upcoming week could be key for the future performance of oil, even though fundamentals are bearish as well.
From the technical perspective, MACD is negatively configured well below neutral zone, while RSI has improved slightly but remains trapped in the oversold zone. Therefore USOIL needs to present a sufficient rally (more than $57) for the negative outlook to change.
Yesterday’s high at $54.43 is the immediate Resistance for the asset. However the Key Resistance and Support levels for USOIL are $54.80 and its 2-week low at $50.15 respectively. A break below the latter could open the doors towards 2018 lows, while a break above Resistance could retest the 38.2% Fibonacci retracement at $56.60 and the round $57.00 level.
Andria Pichidi
Market Analyst
Disclaimer: This material is provided as a general marketing communication for information purposes only and does not constitute an independent investment research. Nothing in this communication contains, or should be considered as containing, an investment advice or an investment recommendation or a solicitation for the purpose of buying or selling of any financial instrument. All information provided is gathered from reputable sources and any information containing an indication of past performance is not a guarantee or reliable indicator of future performance. Users acknowledge that any investment in Leveraged Products is characterized by a certain degree of uncertainty and that any investment of this nature involves a high level of risk for which the users are solely responsible and liable. We assume no liability for any loss arising from any investment made based on the information provided in this communication. This communication must not be reproduced or further distributed without our prior written permission.
WTI-OIL

USOIL Keep shortPrices are still being held down by a downward trend line,
Investors are advised to stay short.
If prices break above the trend line,
we can go long again.
Sell Limit 54.40
TP 51.30
Follow me !
Show U The Money !
---------------------------- - 2019.06.11 uk

USOIL Keep ShortPrices are still being held down by a downward trend line,
Investors are advised to stay short.
If prices break above the trend line,
we can go long again.
Sell Limit 54.40
TP 51.30
Follow me !
Show U The Money !
---------------------------- - 2019.06.11

Still holding on to negatives projectionsOil is still looking south on the prices. Between 48.48 and 36.04
There doesn't appear (this week any how) to be any effort of a rally.
The pricing returned to its core averages after a run off early away from them.
WTI , considering a short daytrade position considering a short daytrade position , target around 54 to 52
Long on OIL, max 58.60Taking the Oil drop as a long - for Brent to correct WTI. Max 58.60
If it drops below the 57.30, I am out of OIL until 55.45

OIL WTI ShortDopo le forti speculazioni sulle notizie Iran, il petrolio potrebbe effettuare una correzione in area 57.40
WHY SO MANY SHORTS I would love to ramble about geopolitics, but that aside, the real deal I see is bear overreacting party here.
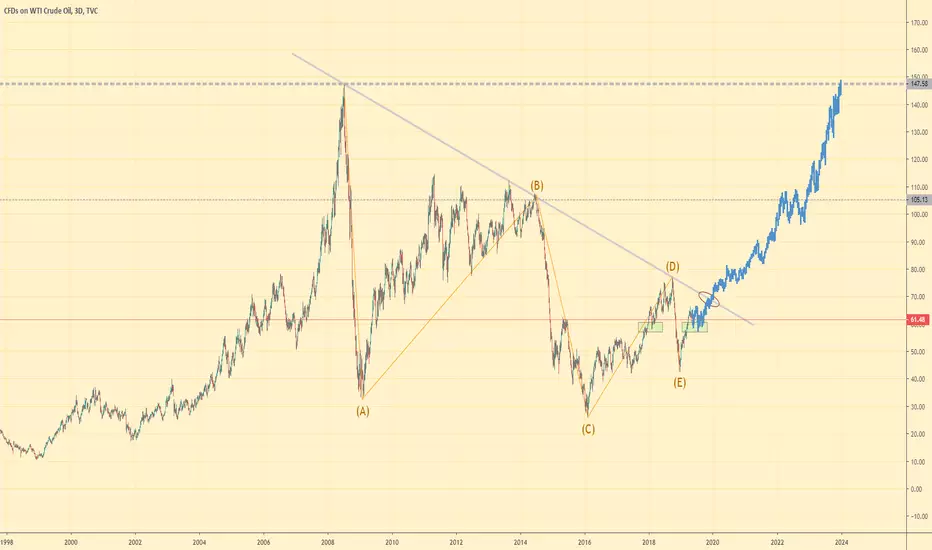
Elliott wave approach:
ABC corrective wave is completed. It's time for a bull run.
Trend line approach:
3 times tested channels is having a fourth try.
Others:
Daily Exponential Moving Average +SMA 50/100/200 are showing 4 supports and 2 resistances.

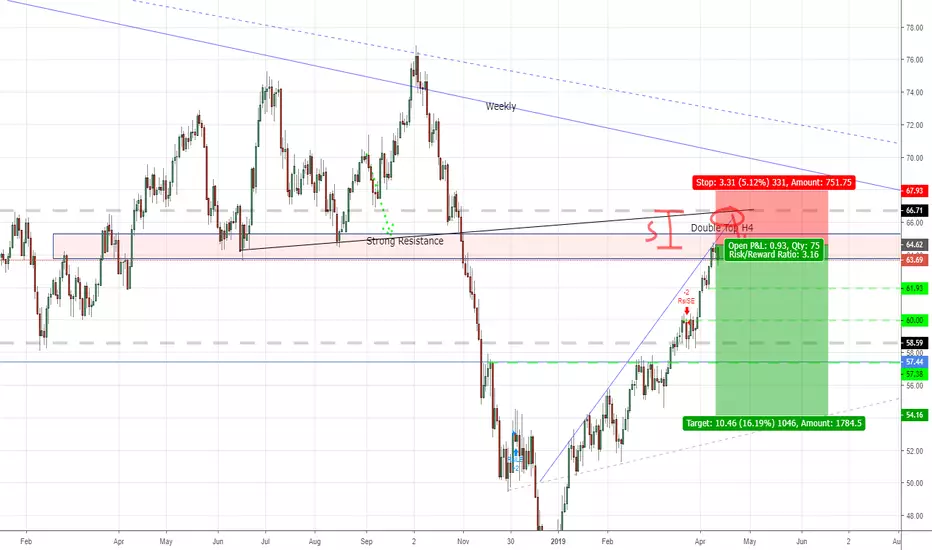
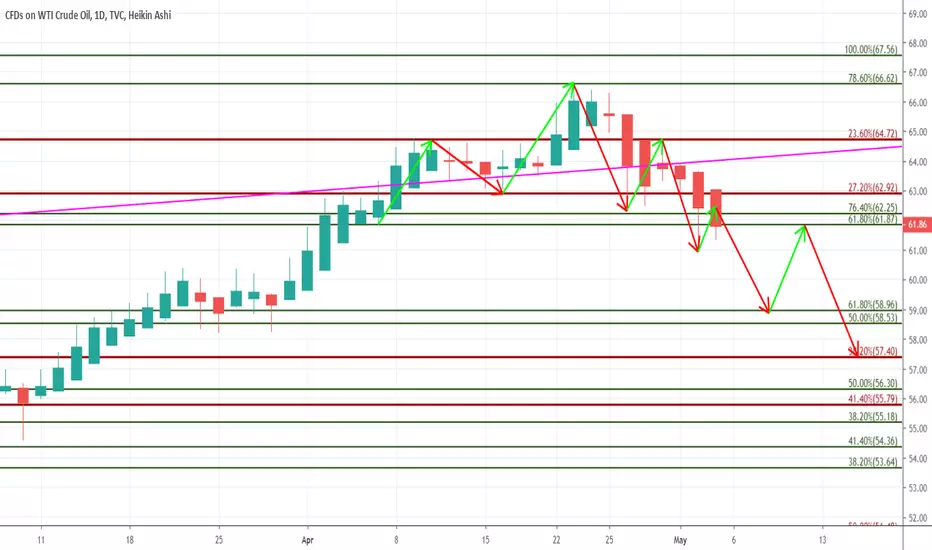
Short Bias Trade Setup - WTI Oil
Looking to short WTI Oil as it forms a new downtrend channel after breaking an uptrend channel last April.
Currently, the stochastic is showing potential buy signal for a short term upswing, however, we are looking to short on a better position at higher price around $61.22.


WTI OilLittle too early to make a call, will update through the week but we do have an entry zone... just have to see what happens.. let me know what you think


USOIL High-ShortThe bear market is further opened up,
In the future to maintain the High-Short trading ideas.
Or Sell Limit 61.50
TP1 59.50
TP2 58.70
SL 62.80
Follow Me!
Show U The Money!
--------------------------------Ronnie 2019.05.06 uk

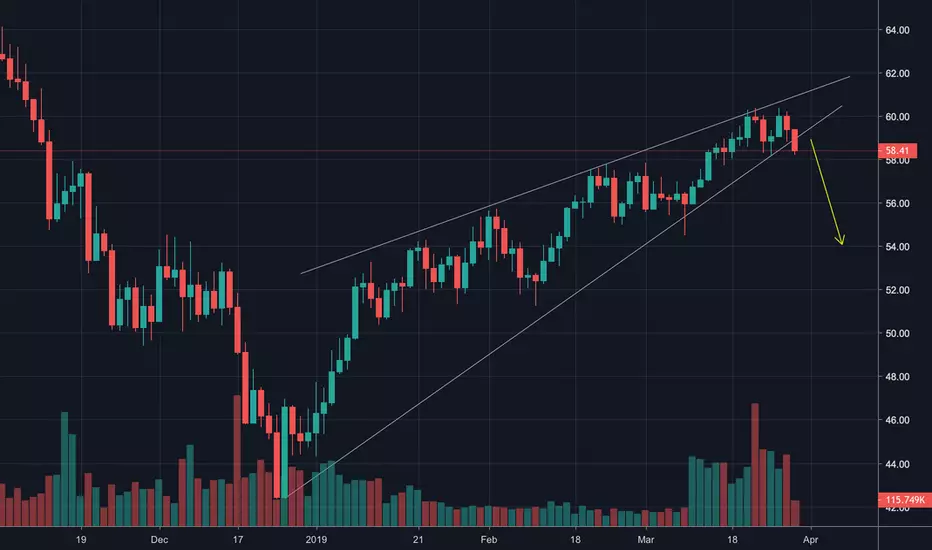
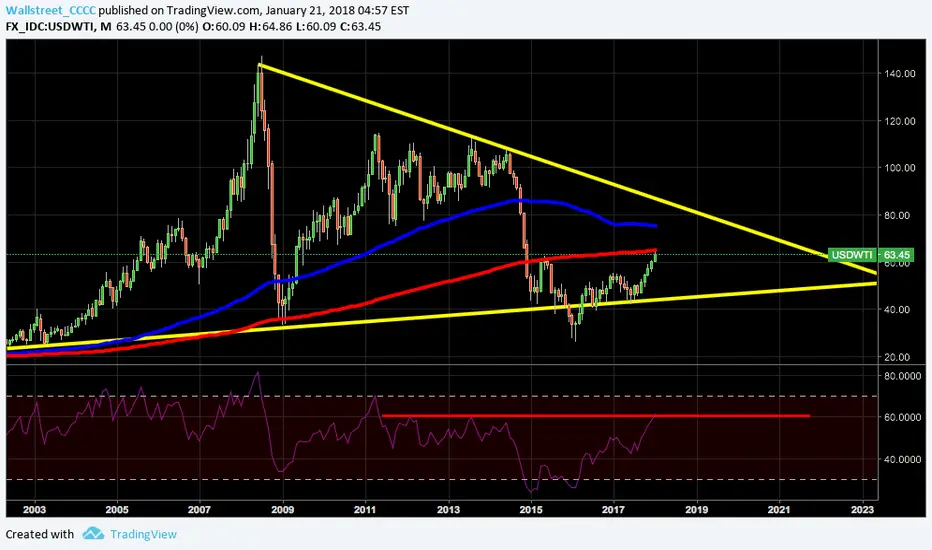
A NEW ERA FOR $WTI BULLS IS ON THE HORIZONWe're in the last few month of accumulation prior to an Elliot Wave Triangle breakout.
USOIL/WTI SHORTI understand there is a lot of talk around getting into USOIL/WTI buys. However, looking at the bigger picture is important.
As you can see on my below chart, the daily structure suggests taking a short on this commodity.
I also like this current consolidation that is making higher highs on the 15 minute chart, as it tells me that my daily structure will be followed.
A move higher to my 15 minutes chart is possible but I will remain bearish on this pair until my daily structure has a clean break.
Trade safe and good luck!

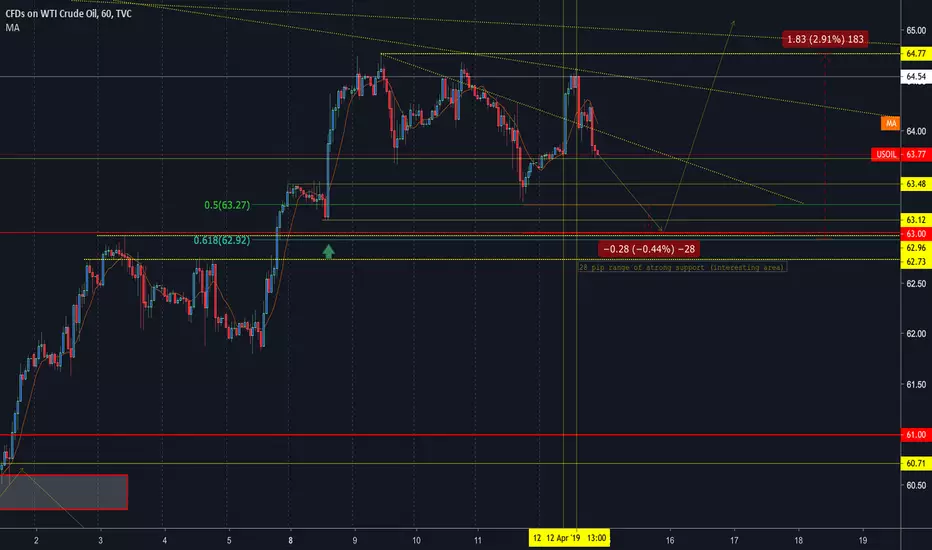
"Starting the week on USOIL” Multi timeframe view by TAvisionThis is our “Every-Monday” report on USOIL with a full vision over 3 timeframes.
4H CHART EXPLANATION:
- Price is on a confluence level (Pullback to TL + Resistance Zone).
- Bearish Divergence on MACD.
- if price breaks the ascending channel (63.60), it has potential to move down towards the support zone (62.2)
- We will be looking for sell setups on lower timeframes.
Updates coming soon!
MULTI TIMEFRAME VISION:
Weekly:
Daily:

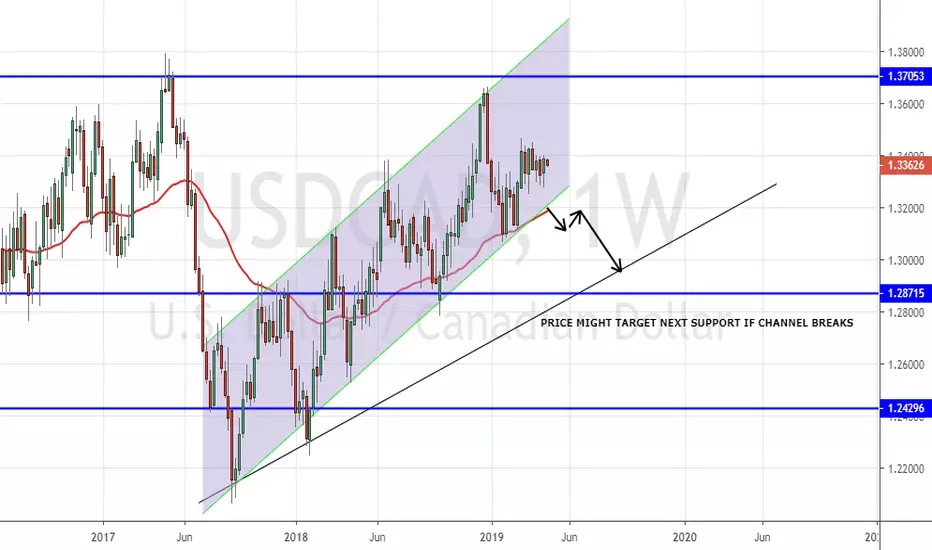
OIL Rally Could Break USDCAD Channel & Target 1.29000!With broad USD strength evident as the US-SINO Trade deal nears, we might see OIL prices gain strength as well as global slowdown fears slowly subside. Moreover, OPEC and The US controlling the production of OIL by imposing sanctions and other measures we could see the demand for OIL increase soon.
Here in the main chart, we could see the price on the weekly chart confined in an ascending channel supported by the weekly 50 EMA as dynamic support. Should the weekly candle close below the weekly 50 EMA and breach the lower end of the channel we could see the price head for the next support that lies in the region of 1.29000 supported by another ascending trendline!
Should the criteria meet, i will post the trade details in a new post. This just represents my outlook on this pair. If you find the analysis useful please drop a LIKE and FOLLOW me for future posts. cheers
US OIl Wanting a test of 65 next week, after a small pull back.
We have seen Oil continue to keep driving back towards the highs after the fall in summer. Daily is still showing room to the upside. With a high a chance of pulling back before continuing, I have found an area of value and will be looking for longs from the 63 area, if it fails to hold. Then I will not be holding. Oil is VERY aggressive and could easily take a 200 pip turn on any day it feels like. But, looking through all Tf's and how price has been reacting to previous levels. I like more upside. Lets see!