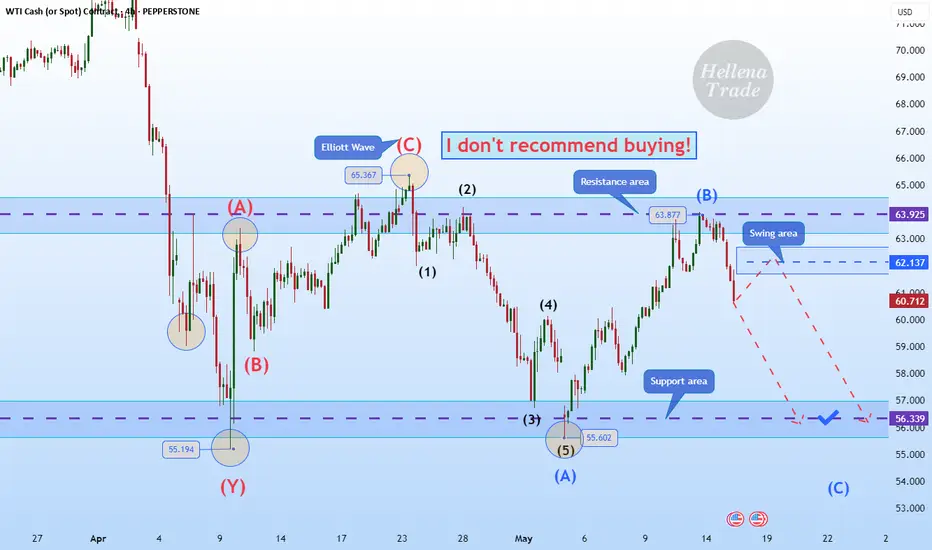
Hellena | Oil (4H): SHORT to support area of 56,339.Colleagues, I was watching the price and was expecting a pattern for a reversal downtrend. I still expect a downward movement and believe that the price is in a combined correction.
This means that wave “B” has been formed and I expect wave “C” to reach at least the 56,339 area.
Manage your capital correctly and competently! Only enter trades based on reliable patterns!
WTI
WTI Oil H4 | Potential bullish bounceWTI oil (USOIL) is falling towards an overlap support and could potentially bounce off this level to climb higher.
Buy entry is at 60.44 which is an overlap support that aligns with the 38.2% Fibonacci retracement.
Stop loss is at 57.60 which is a level that lies underneath a swing-low support and the 61.8% Fibonacci retracement.
Take profit is at 63.68 which is a multi-swing-high resistance.
High Risk Investment Warning
Trading Forex/CFDs on margin carries a high level of risk and may not be suitable for all investors. Leverage can work against you.
Stratos Markets Limited (tradu.com):
CFDs are complex instruments and come with a high risk of losing money rapidly due to leverage. 63% of retail investor accounts lose money when trading CFDs with this provider. You should consider whether you understand how CFDs work and whether you can afford to take the high risk of losing your money.
Stratos Europe Ltd (tradu.com):
CFDs are complex instruments and come with a high risk of losing money rapidly due to leverage. 63% of retail investor accounts lose money when trading CFDs with this provider. You should consider whether you understand how CFDs work and whether you can afford to take the high risk of losing your money.
Stratos Global LLC (tradu.com):
Losses can exceed deposits.
Please be advised that the information presented on TradingView is provided to Tradu (‘Company’, ‘we’) by a third-party provider (‘TFA Global Pte Ltd’). Please be reminded that you are solely responsible for the trading decisions on your account. There is a very high degree of risk involved in trading. Any information and/or content is intended entirely for research, educational and informational purposes only and does not constitute investment or consultation advice or investment strategy. The information is not tailored to the investment needs of any specific person and therefore does not involve a consideration of any of the investment objectives, financial situation or needs of any viewer that may receive it. Kindly also note that past performance is not a reliable indicator of future results. Actual results may differ materially from those anticipated in forward-looking or past performance statements. We assume no liability as to the accuracy or completeness of any of the information and/or content provided herein and the Company cannot be held responsible for any omission, mistake nor for any loss or damage including without limitation to any loss of profit which may arise from reliance on any information supplied by TFA Global Pte Ltd.
The speaker(s) is neither an employee, agent nor representative of Tradu and is therefore acting independently. The opinions given are their own, constitute general market commentary, and do not constitute the opinion or advice of Tradu or any form of personal or investment advice. Tradu neither endorses nor guarantees offerings of third-party speakers, nor is Tradu responsible for the content, veracity or opinions of third-party speakers, presenters or participants.

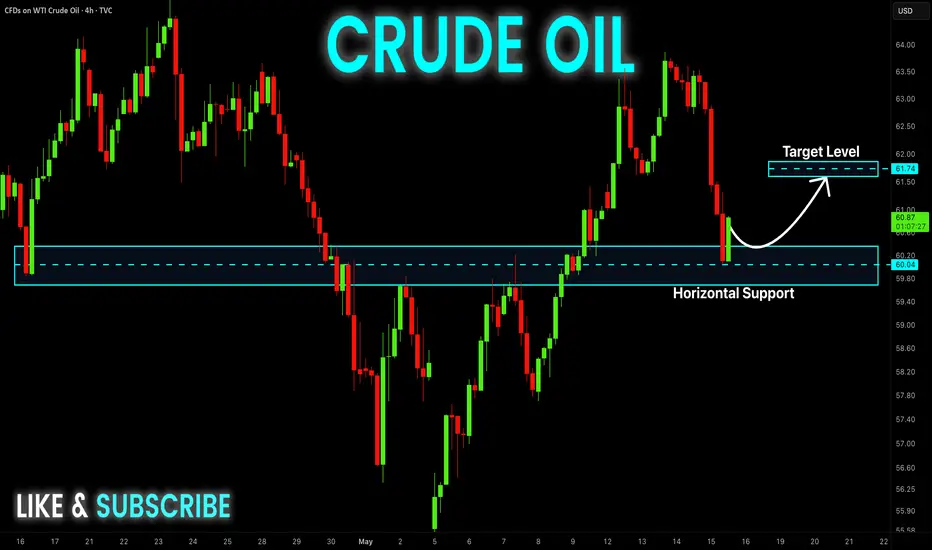
USOIL RISKY SHORT|
✅CRUDE OIL is going up to retest
A horizontal resistance of 62.00$
Which makes me locally bearish biased
And I think that we will see a pullback
And a move down from the level
Towards the target below at 60.62$
SHORT🔥
✅Like and subscribe to never miss a new idea!✅
Disclosure: I am part of Trade Nation's Influencer program and receive a monthly fee for using their TradingView charts in my analysis.

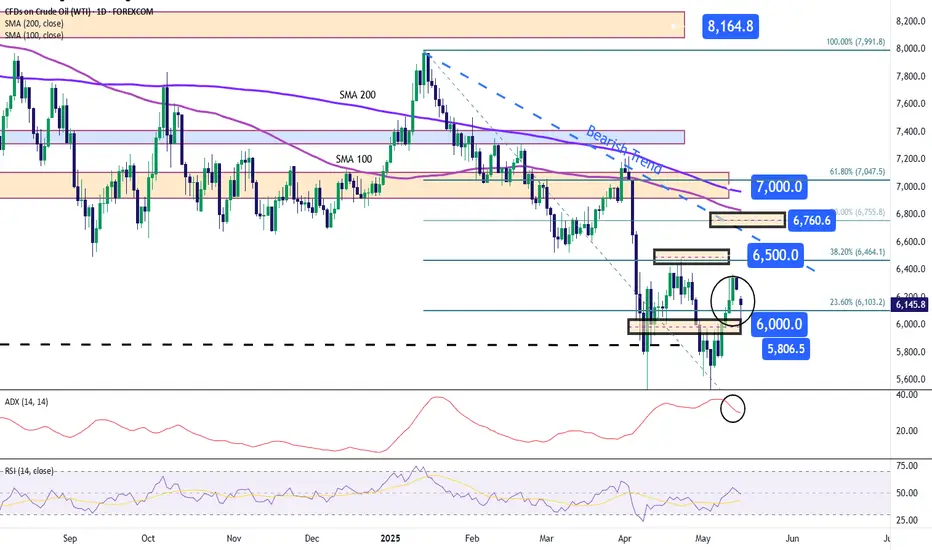
WTI Crude Returns to the $60 ZoneWTI crude oil has posted a drop of more than 4% in recent sessions as the market digests new announcements from OPEC+. The organization stated that current economic conditions could support growth in oil demand throughout 2025 and 2026. However, it remains firm in its decision to increase production starting in May and June, with monthly increments of 411,000 barrels per day, and has also announced another increase in July.
This stance has sparked concerns in the market about a potential short-term oversupply. If this strategy persists, selling pressure could return to WTI price action in the coming sessions.
Bearish Trend
Since January 20, a clear bearish trend has been forming, pushing the barrel’s price below the $60 mark. While a notable upward move is currently underway, it remains insufficient to break the prevailing bearish formation, which continues to be the dominant technical structure in the short term.
ADX
The ADX line was previously hovering around the 40 level, reflecting high volatility in price movements. However, it has begun to flatten, and if this continues, it could suggest a loss of directional strength, paving the way for a more neutral price behavior.
RSI
The behavior of the RSI mirrors that of the ADX. It is currently oscillating around the 50 level, indicating a balance between buying and selling pressure, and reinforcing the potential for a neutral phase in the short term.
Key Levels:
$65 – Current Resistance: Aligns with the 38.2% Fibonacci retracement and acts as a key psychological level. A breakout above this level could extend the current bullish bias over the coming sessions.
$67 – Distant Resistance: Matches the 50% Fibonacci retracement and a sideways zone observed in March. Sustained moves above this area could challenge the existing bearish structure on the chart.
$60 – Crucial Support: Represents a consistent area of indecision in recent months. If the price returns to this level, the previous bearish structure could regain strength in the short term.
Written by Julian Pineda, CFA – Market Analyst
CRUDE OIL Local Long! Buy!
Hello,Traders!
USOIL has retested a
Nice round horizontal
Support level of 60$
And we are predictably
Seeing a bullish reaction
From the level which we
Believe will take the price
A bit higher still
Buy!
Comment and subscribe to help us grow!
Check out other forecasts below too!
Disclosure: I am part of Trade Nation's Influencer program and receive a monthly fee for using their TradingView charts in my analysis.
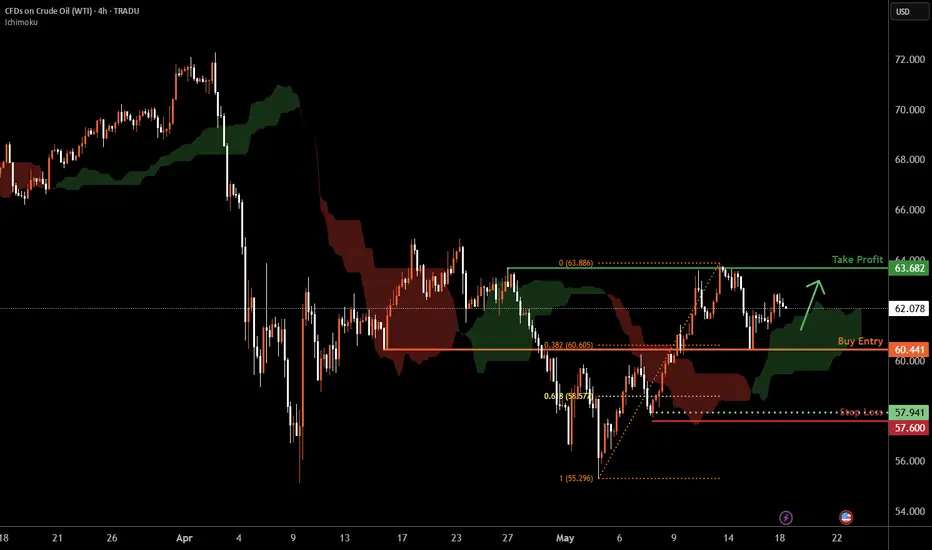
WTI Oil H4 | Falling toward an overlap supportWTI oil (USOIL) is falling towards an overlap support and could potentially bounce off this level to climb higher.
Buy entry is at 60.44 which is an overlap support that aligns with the 38.2% Fibonacci retracement.
Stop loss is at 57.60 which is a level that lies underneath a swing-low support and the 61.8% Fibonacci retracement.
Take profit is at 63.68 which is a multi-swing-high resistance.
High Risk Investment Warning
Trading Forex/CFDs on margin carries a high level of risk and may not be suitable for all investors. Leverage can work against you.
Stratos Markets Limited (tradu.com):
CFDs are complex instruments and come with a high risk of losing money rapidly due to leverage. 63% of retail investor accounts lose money when trading CFDs with this provider. You should consider whether you understand how CFDs work and whether you can afford to take the high risk of losing your money.
Stratos Europe Ltd (tradu.com):
CFDs are complex instruments and come with a high risk of losing money rapidly due to leverage. 63% of retail investor accounts lose money when trading CFDs with this provider. You should consider whether you understand how CFDs work and whether you can afford to take the high risk of losing your money.
Stratos Global LLC (tradu.com):
Losses can exceed deposits.
Please be advised that the information presented on TradingView is provided to Tradu (‘Company’, ‘we’) by a third-party provider (‘TFA Global Pte Ltd’). Please be reminded that you are solely responsible for the trading decisions on your account. There is a very high degree of risk involved in trading. Any information and/or content is intended entirely for research, educational and informational purposes only and does not constitute investment or consultation advice or investment strategy. The information is not tailored to the investment needs of any specific person and therefore does not involve a consideration of any of the investment objectives, financial situation or needs of any viewer that may receive it. Kindly also note that past performance is not a reliable indicator of future results. Actual results may differ materially from those anticipated in forward-looking or past performance statements. We assume no liability as to the accuracy or completeness of any of the information and/or content provided herein and the Company cannot be held responsible for any omission, mistake nor for any loss or damage including without limitation to any loss of profit which may arise from reliance on any information supplied by TFA Global Pte Ltd.
The speaker(s) is neither an employee, agent nor representative of Tradu and is therefore acting independently. The opinions given are their own, constitute general market commentary, and do not constitute the opinion or advice of Tradu or any form of personal or investment advice. Tradu neither endorses nor guarantees offerings of third-party speakers, nor is Tradu responsible for the content, veracity or opinions of third-party speakers, presenters or participants.

TA on WTI Oil - 2025.05.14Quick technical analysis on WTI oil.
Let us know what you think in the comments below.
Thank you.
77.3% of retail investor accounts lose money when trading CFDs with this provider. You should consider whether you understand how CFDs work and whether you can afford to take the high risk of losing your money. Past performance is not necessarily indicative of future results. The value of investments may fall as well as rise and the investor may not get back the amount initially invested. This content is not intended for nor applicable to residents of the UK. Cryptocurrency CFDs and spread bets are restricted in the UK for all retail clients.

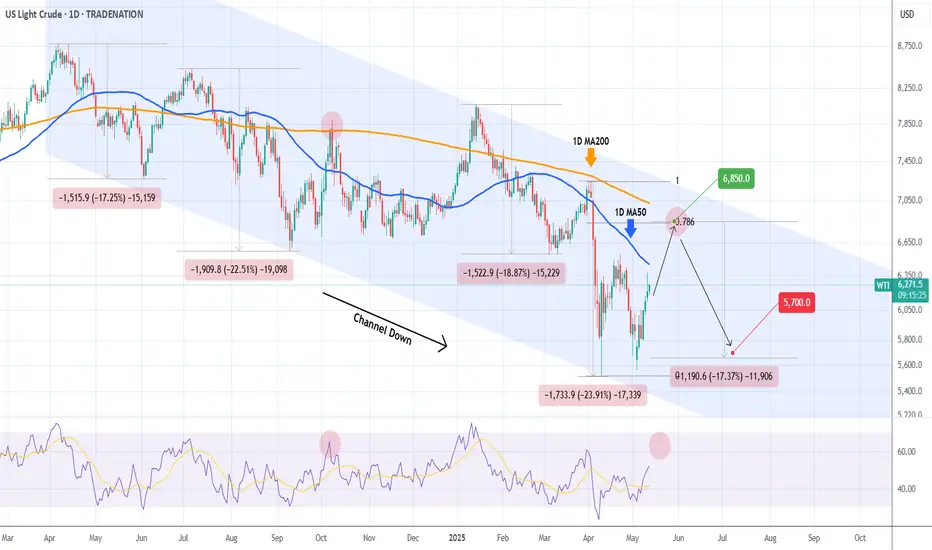
WTI OIL Buy and sell levels within its Channel Down.WTI Oil (USOIL) has been trading within a Channel Down pattern on the 1D time-frame. The price is now rising having priced its most recent technical Lower Low. Every Lower High rejection happened either on or above the 1D MA200 (orange trend-line).
With the current rebound looking similar to September - October 2024, we expect a 0.786 Fib and 1D MA200 test at $68.50 (buy) and then reversal to a minimum -17.30% decline to $57.00 (sell).
-------------------------------------------------------------------------------
** Please LIKE 👍, FOLLOW ✅, SHARE 🙌 and COMMENT ✍ if you enjoy this idea! Also share your ideas and charts in the comments section below! This is best way to keep it relevant, support us, keep the content here free and allow the idea to reach as many people as possible. **
-------------------------------------------------------------------------------
Disclosure: I am part of Trade Nation's Influencer program and receive a monthly fee for using their TradingView charts in my analysis.
💸💸💸💸💸💸
👇 👇 👇 👇 👇 👇
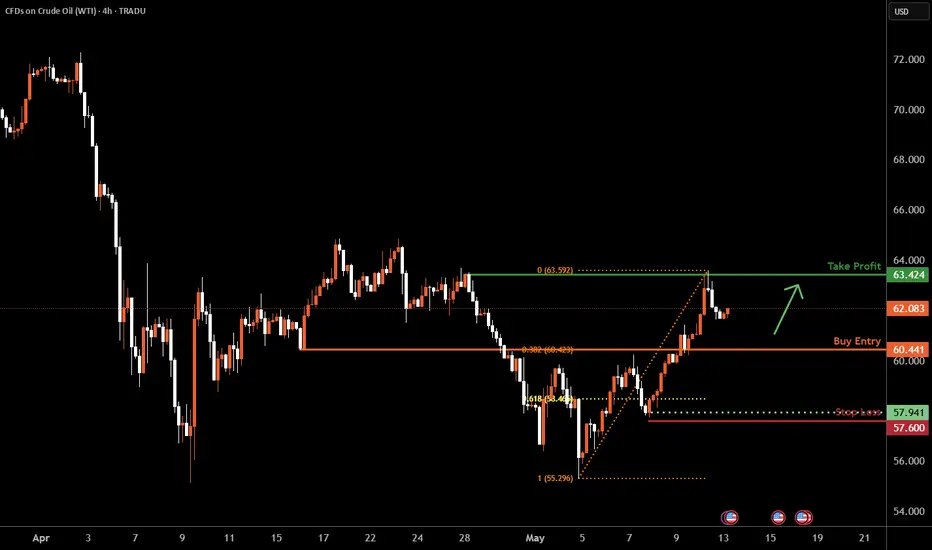
WTI Oil H4 | An overlap support at 38.2% Fibonacci retracementWTI oil (USOIL) could fall towards an overlap support and potentially bounce off this level to climb higher.
Buy entry is at 60.44 which is an overlap support that aligns with the 38.2% Fibonacci retracement.
Stop loss is at 57.60 which is a level that lies underneath a swing-low support and the 61.8% Fibonacci retracement.
Take profit is at 63.42 which is a multi-swing-high resistance.
High Risk Investment Warning
Trading Forex/CFDs on margin carries a high level of risk and may not be suitable for all investors. Leverage can work against you.
Stratos Markets Limited (tradu.com):
CFDs are complex instruments and come with a high risk of losing money rapidly due to leverage. 63% of retail investor accounts lose money when trading CFDs with this provider. You should consider whether you understand how CFDs work and whether you can afford to take the high risk of losing your money.
Stratos Europe Ltd (tradu.com):
CFDs are complex instruments and come with a high risk of losing money rapidly due to leverage. 63% of retail investor accounts lose money when trading CFDs with this provider. You should consider whether you understand how CFDs work and whether you can afford to take the high risk of losing your money.
Stratos Global LLC (tradu.com):
Losses can exceed deposits.
Please be advised that the information presented on TradingView is provided to Tradu (‘Company’, ‘we’) by a third-party provider (‘TFA Global Pte Ltd’). Please be reminded that you are solely responsible for the trading decisions on your account. There is a very high degree of risk involved in trading. Any information and/or content is intended entirely for research, educational and informational purposes only and does not constitute investment or consultation advice or investment strategy. The information is not tailored to the investment needs of any specific person and therefore does not involve a consideration of any of the investment objectives, financial situation or needs of any viewer that may receive it. Kindly also note that past performance is not a reliable indicator of future results. Actual results may differ materially from those anticipated in forward-looking or past performance statements. We assume no liability as to the accuracy or completeness of any of the information and/or content provided herein and the Company cannot be held responsible for any omission, mistake nor for any loss or damage including without limitation to any loss of profit which may arise from reliance on any information supplied by TFA Global Pte Ltd.
The speaker(s) is neither an employee, agent nor representative of Tradu and is therefore acting independently. The opinions given are their own, constitute general market commentary, and do not constitute the opinion or advice of Tradu or any form of personal or investment advice. Tradu neither endorses nor guarantees offerings of third-party speakers, nor is Tradu responsible for the content, veracity or opinions of third-party speakers, presenters or participants.
Oil Price Reversal? Why I’m Bullish on WTI Right Now! 🛢️ WTI crude oil is showing renewed bullish momentum. This move is backed by a shift in sentiment following the recent U.S.–China tariff truce and positive trade headlines. While OPEC+ supply increases and elevated inventories remain headwinds, surprise U.S. crude draws and strong jet fuel demand are tightening the market. I’m watching the current retrace. As always, keep risk tight—oil can turn fast! 🚀🛢️📈

Crude oil gains could be limited. Here's whyAlong with other risk assets, crude oil has had a positive day, albeit a much quieter one compared to the major indices. It has been held back in part by the dollar also finding good support. So, I think a large part of the rally today in WTI is just a function of the market pricing in higher demand because of lower tariffs. Thus, it is the removal of a bearish factor driving prices higher, which could be factor for a while yet as market finds a new equilibrium. The underlying issue of an oversupplied market is what will ultimately determine oil prices. On that front, you have the OPEC ready to release more withheld supplies as it doesn’t want to lose more market share to non-OPEC producers. Thus, the upside linked to a brighter demand outlook should be capped. So, while I do think prices may rise a little further, I don’t think that we will see significantly higher prices with the current state of supply picture. I wouldn’t be surprised if $70 turns into resistance now on Brent, or if WTI holds this shaded yellow resistance range you can see on this chart around $65 area.
By Fawad Razaqzada, market analyst with FOREX.com
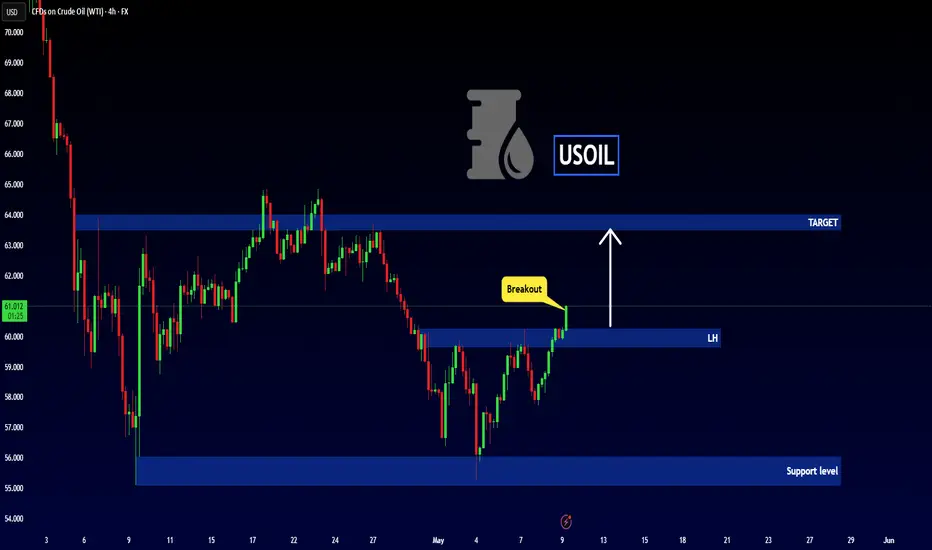
USOIL - Important Breakout !Hello Traders !
The USOIL failed to break the support level (56.047 - 55.102).
Currently, The lower high is broken (Change of Character).
So, I expect a bullish move🚀
________________
TARGET: 63.500🎯
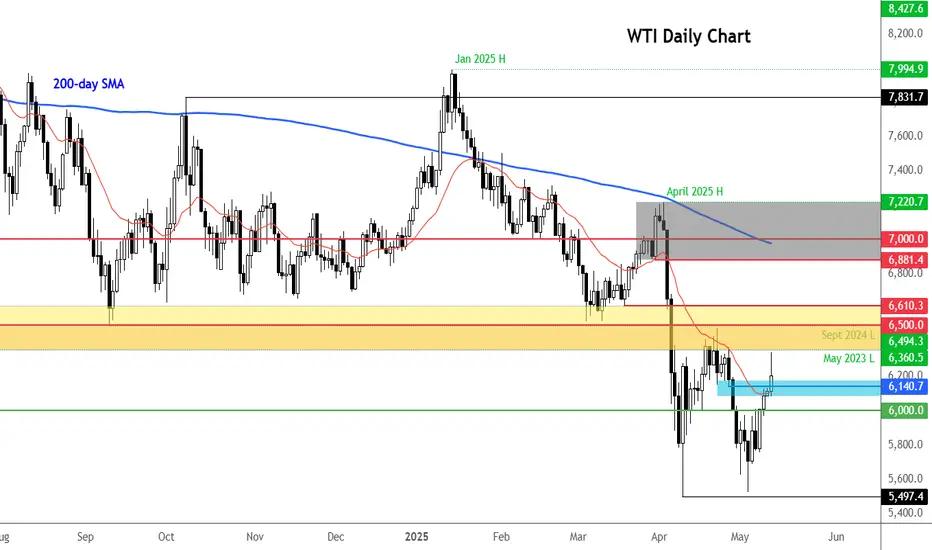
WTI - Technical Setup Points to April HighsThe US Light Crude chart is displaying promising bullish momentum after establishing a significant double bottom at the $56 support zone. Following a sharp recovery from recent lows, the price has broken above key resistance levels and is currently trading around $61,27 with the green arrow indicating potential continuation to the upside. Technical patterns suggest there is a higher probability that crude oil prices will extend this rally toward the local top formed on April 23rd near $65, completing a broader recovery pattern. With strengthening momentum indicators and improved market sentiment, this upward move appears well-supported, especially if crude can maintain position above the current consolidation range and continue forming higher lows on the daily timeframe.
Disclosure: I am part of Trade Nation's Influencer program and receive a monthly fee for using their TradingView charts in my analysis.

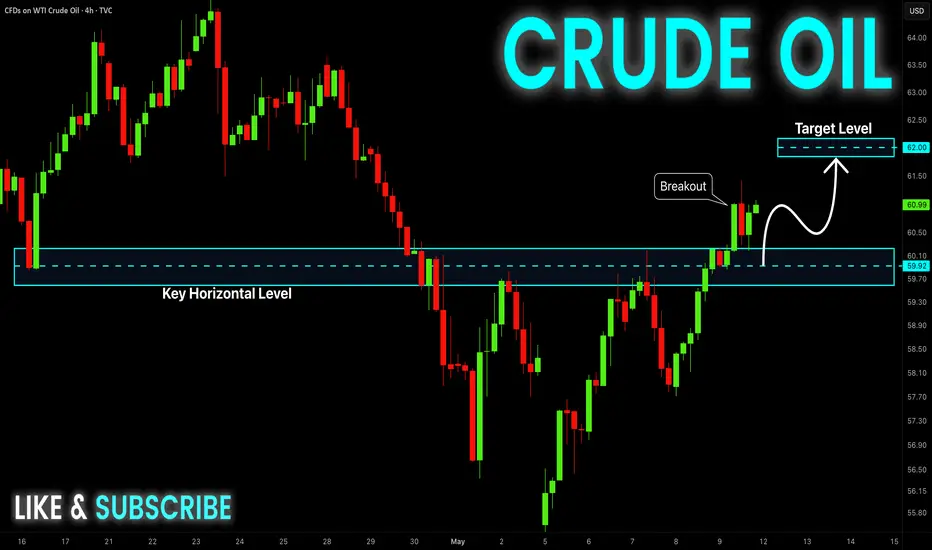
USOIL GROWTH AHEAD|LONG|
✅CRUDE OIL made a bullish
Breakout of the key horizontal
Level around 60.00$ and the
Breakout is confirmed so we
Are bullish biased and we
Will be expecting a further
Bullish continuation
LONG🚀
✅Like and subscribe to never miss a new idea!✅
Disclosure: I am part of Trade Nation's Influencer program and receive a monthly fee for using their TradingView charts in my analysis.

WTI on high time frame
"Hello traders, focusing on WTI, the price is currently at a critical level of $62.
Candle formations on high time frames indicate a higher probability of the price declining to $53.
Given the influence of political and geopolitical news, there may be increased volatility in the price. This analysis will be updated accordingly."
If you have any more details to add or need further assistance, please feel free to let me know!

CRUDE OIL Bullish Breakout! Buy!
Hello,Traders!
CRUDE OIL is making a bullish
Correction from the lows and
The price made a bullish
Breakout of the key horizontal
Level of 60.10$ then made a
Retest and a rebound so we
Are bullish biased and we will
Be expecting a further bullish
Continuation on Monday
Buy!
Comment and subscribe to help us grow!
Check out other forecasts below too!
Disclosure: I am part of Trade Nation's Influencer program and receive a monthly fee for using their TradingView charts in my analysis.
Oil Analysis: WTI Approaches the $60 Level AgainOver the past two trading sessions, oil has gained more than 4.5%, and is once again approaching the psychological barrier of $60 per barrel. This recent bullish movement persists despite OPEC+’s clear stance on increasing supply in June and the International Energy Agency’s (IEA) cautious outlook on global oil demand for the remainder of the year. As such, it appears that oil prices are currently benefiting from improving market sentiment, particularly as investors await the outcome of the upcoming U.S.–China trade negotiations.
Persistent Bearish Trend
Since mid-January, oil has maintained a steady downtrend, and so far, minor bullish retracements have not been strong enough to signal a meaningful reversal. Therefore, this downward technical formation remains the dominant structure to monitor in upcoming trading sessions.
RSI
The Relative Strength Index (RSI) continues to hover around the 50 level, indicating a sustained balance between bullish and bearish momentum. As long as this equilibrium remains, a neutral bias could dominate short-term price movements.
ADX
The Average Directional Index (ADX) remains close to the 40 mark, though the line has recently begun to flatten. This could be interpreted as a sign of weakening trend strength in the short term, likely due to the price currently testing a significant resistance zone.
Key Levels to Watch:
$60 – Nearby resistance: A short-term psychological level. A break above this zone could reactivate a bullish bias and potentially lead to the formation of a new short-term uptrend.
$63 – Main resistance: Aligned with the 50-period moving average. Sustained price action above this level could challenge the prevailing long-term bearish structure.
$57 – Nearby support: A zone that matches recent multi-week lows. A drop below this level could reinforce bearish momentum and provide more room for the current downtrend to extend.
Written by Julian Pineda, CFA – Market Analyst

WTI Oil H4 | Heading into resistanceWTI oil (USOIL) is rising towards a pullback resistance and could potentially reverse off this level to drop lower.
Sell entry is at 60.44 which is a pullback resistance that aligns close to the 50.0% Fibonacci retracement.
Stop loss is at 63.80 which is a level that sits above the 78.6% Fibonacci retracement and a swing-high resistance.
Take profit is at 56.05 which is a multi-swing-low support.
High Risk Investment Warning
Trading Forex/CFDs on margin carries a high level of risk and may not be suitable for all investors. Leverage can work against you.
Stratos Markets Limited (tradu.com):
CFDs are complex instruments and come with a high risk of losing money rapidly due to leverage. 63% of retail investor accounts lose money when trading CFDs with this provider. You should consider whether you understand how CFDs work and whether you can afford to take the high risk of losing your money.
Stratos Europe Ltd (tradu.com):
CFDs are complex instruments and come with a high risk of losing money rapidly due to leverage. 63% of retail investor accounts lose money when trading CFDs with this provider. You should consider whether you understand how CFDs work and whether you can afford to take the high risk of losing your money.
Stratos Global LLC (tradu.com):
Losses can exceed deposits.
Please be advised that the information presented on TradingView is provided to Tradu (‘Company’, ‘we’) by a third-party provider (‘TFA Global Pte Ltd’). Please be reminded that you are solely responsible for the trading decisions on your account. There is a very high degree of risk involved in trading. Any information and/or content is intended entirely for research, educational and informational purposes only and does not constitute investment or consultation advice or investment strategy. The information is not tailored to the investment needs of any specific person and therefore does not involve a consideration of any of the investment objectives, financial situation or needs of any viewer that may receive it. Kindly also note that past performance is not a reliable indicator of future results. Actual results may differ materially from those anticipated in forward-looking or past performance statements. We assume no liability as to the accuracy or completeness of any of the information and/or content provided herein and the Company cannot be held responsible for any omission, mistake nor for any loss or damage including without limitation to any loss of profit which may arise from reliance on any information supplied by TFA Global Pte Ltd.
The speaker(s) is neither an employee, agent nor representative of Tradu and is therefore acting independently. The opinions given are their own, constitute general market commentary, and do not constitute the opinion or advice of Tradu or any form of personal or investment advice. Tradu neither endorses nor guarantees offerings of third-party speakers, nor is Tradu responsible for the content, veracity or opinions of third-party speakers, presenters or participants.

WTI - Will Oil Return to the Uptrend?!WTI oil is below the EMA200 and EMA50 on the 4-hour timeframe and is moving within its medium-term descending channel. If the downward trend continues towards the zone, the next opportunity to buy oil at a good price will be presented to us. A break of the drawn downtrend line will also be another confirmation to enter the oil buying process.
Goldman Sachs anticipates that the Federal Open Market Committee will maintain its pause on interest rate hikes. According to the bank’s asset management division, the continued strength of the labor market remains a crucial factor influencing the Federal Reserve’s decisions, prompting the central bank to adopt a cautious stance.
In a recent note, Goldman Sachs stated: “The Federal Reserve is currently in a holding pattern, waiting for economic uncertainties to diminish.” Although recent employment data have exceeded expectations, the bank believes that initiating a rate-cutting cycle would require clear signs of labor market weakening—a development that could take several months to materialize. The note further stated: “Since the labor market has yet to exhibit any significant softening, the likelihood of another hold decision in the next meeting is high.”
Meanwhile, U.S. President Donald Trump, ahead of his upcoming trip to Saudi Arabia, Qatar, and the United Arab Emirates, responded to a question about the potential renaming of the “Persian Gulf” to the “Arabian Gulf” in official U.S. documents. He stated that a decision would be made following his trip and a related discussion.
Trump acknowledged the sensitivities surrounding the issue, saying he does not wish to offend anyone. He also referenced his prior executive order to rename the “Gulf of Mexico” as the “Gulf of America,” which he described as a necessary move. He concluded by noting that a final decision regarding the name of the Persian Gulf would be made after the scheduled discussions.Additionally, the RIA Novosti news agency reported on Thursday that Chinese President Xi Jinping and Russian President Vladimir Putin had officially begun talks at the Kremlin. Prior to the discussions, Putin expressed his intention to engage with President Xi on “a broad range of bilateral relations,” emphasizing that the Russia-China partnership is mutually beneficial. He also expressed his willingness to visit Beijing for a celebration marking China’s victory over Japan.
According to the report, the two leaders are expected to issue joint statements and address the media following their talks. A correspondent from the TASS news agency reported that the agenda for the Xi-Putin discussions is likely to include bilateral cooperation in various sectors, such as energy, the conflict in Ukraine, and the development of the “Power of Siberia 2” gas pipeline project.

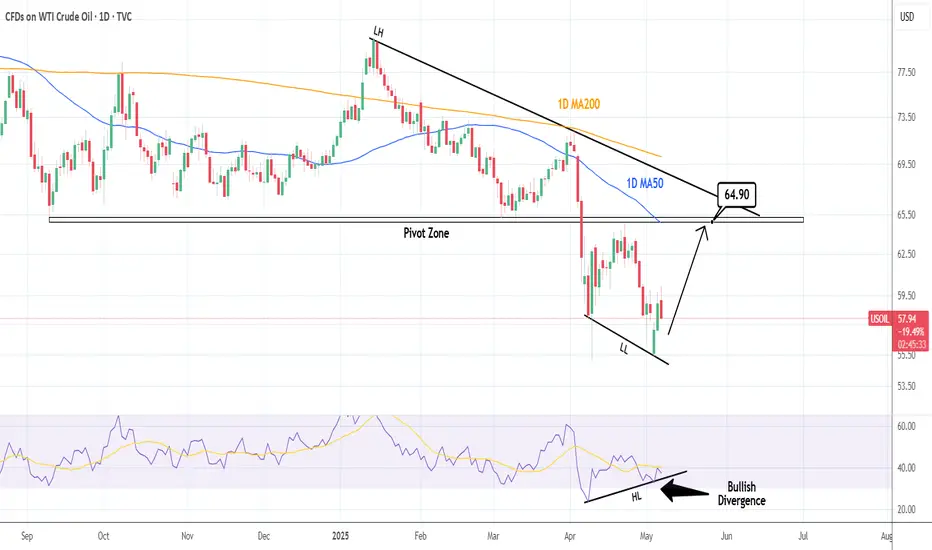
WTI CRUDE OIL: Short term rebound on RSI Bullish DivergenceWTI Crude Oil is bearish on its 1D technical outlook (RSI = 38.958, MACD = -2.110, ADX = 28.985) as it remains on a multi-month Low. The 1D RSI however displays a HL Bullish Divergence and this can cause a short term price rebound. The Resistance is the Pivot Zone and short term the LH trendline is what maintains the downtrend. Consequently, we are now bullish, TP = 64.90.
## If you like our free content follow our profile to get more daily ideas. ##
## Comments and likes are greatly appreciated. ##
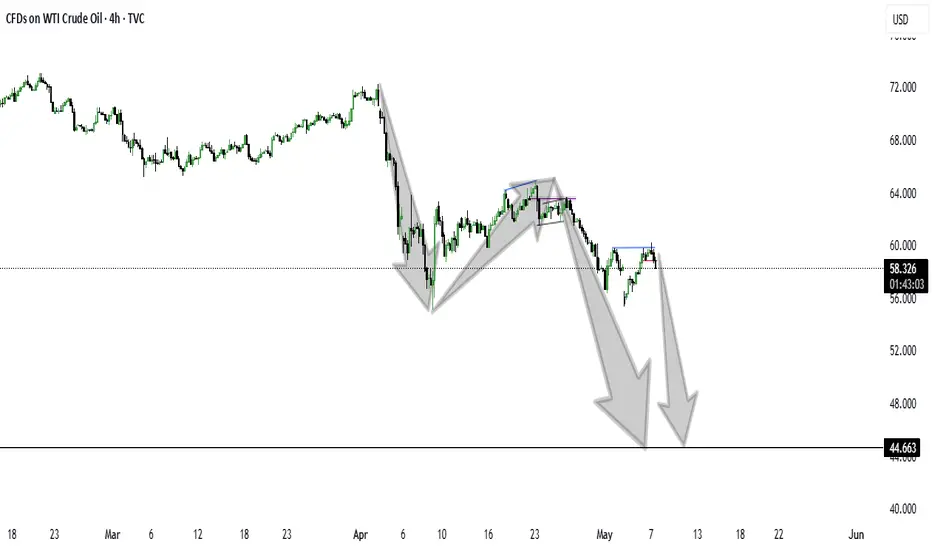
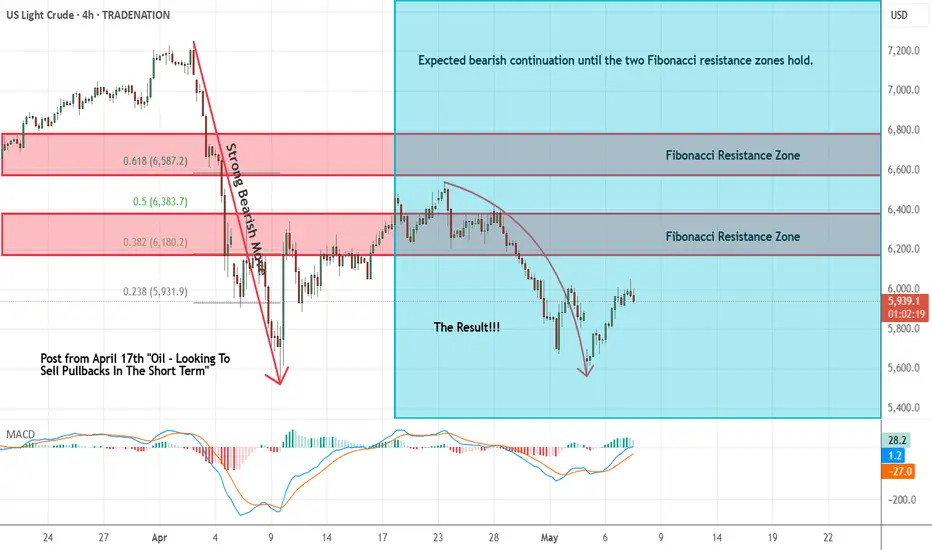
Oil - Short Term Sell Trade Update!!!Hi Traders, on April 17th I shared this idea "Oil - Looking To Sell Pullbacks In The Short Term"
I expected to see bearish continuation until the two Fibonacci resistance zones hold. You can read the full post using the link above.
Price moved lower as per the plan here!!!
Price respected the first Fibonacci resistance zone, created a false break of it and moved lower as expected!!!
If you enjoy this idea, don’t forget to LIKE 👍, FOLLOW ✅, SHARE 🙌, and COMMENT ✍! Drop your thoughts and charts below to keep the discussion going. Your support helps keep this content free and reach more people! 🚀
-------------------------------------------------------------------------------------------------------------------
Disclosure: I am part of Trade Nation's Influencer program and receive a monthly fee for using their TradingView charts in my analysis.