USOIL REACHED THE 6,900.00 SUPPORT LEVEL. WHAT'S NEXT?USOIL REACHED THE 6,900.00 SUPPORT LEVEL. WHAT'S NEXT?
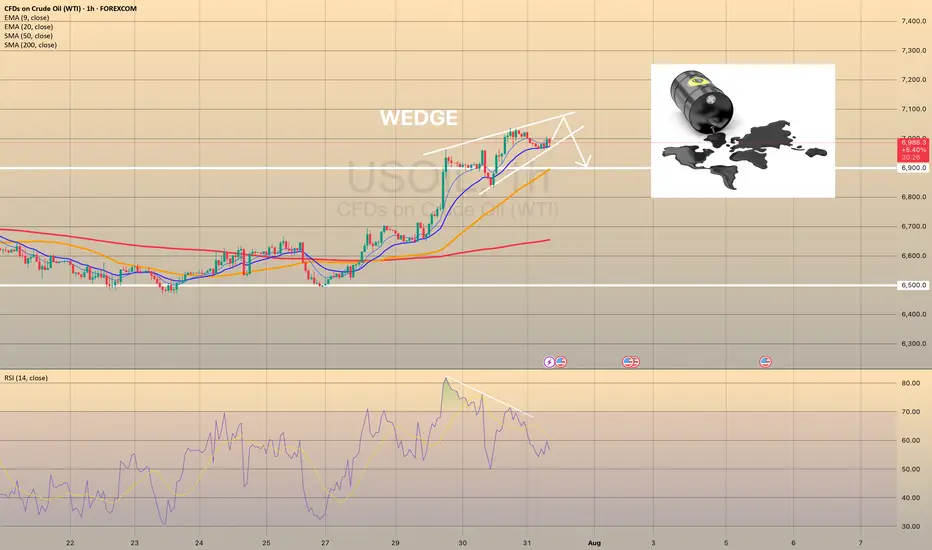
As we told July 31, the price got reversed towards first support level of 6,900.00. Market participants are waiting for the OPEC+ meeting this week, expecting a significant output hike. Currently, the price sits slightly above the support level. Although, the asset trades above this level, considering the current weakness of the asset, further decline is expected. The 6,800.00 support level is the next target here.
Wtianalysis
USOIL IS GOING BULLISH. FOR HOW LONG?USOIL IS GOING BULLISH. FOR HOW LONG?
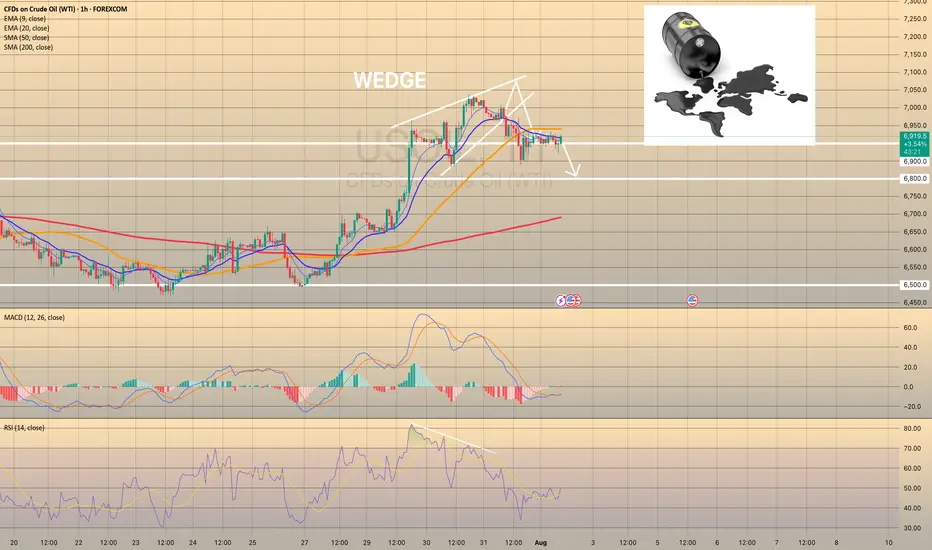
Brent has started this week with a strong bullish momentum and holds near 6-week high on supply fears. President Trump announced plans to impose tariffs on Indian exports and penalize its Russian oil imports. In a parallel move, the US introduced its most extensive sanctions on Iran in seven years. The United States has even offered its oil to the world in exchange for Iranian and Russian oil, but there is evidence that the US production capacity is now at historic highs and is unlikely to grow in the near future.
However, technically oil shows us bearish divergence on RSI and bearish wedge here. The price may reverse towards 6,900.00 as a first target. EIA data showed US crude inventories jumped by 7.7 million barrels last week—the largest increase in six months and defying forecasts for a decline. Market participants are waiting for the OPEC+ meeting this week, expecting a significant output hike.
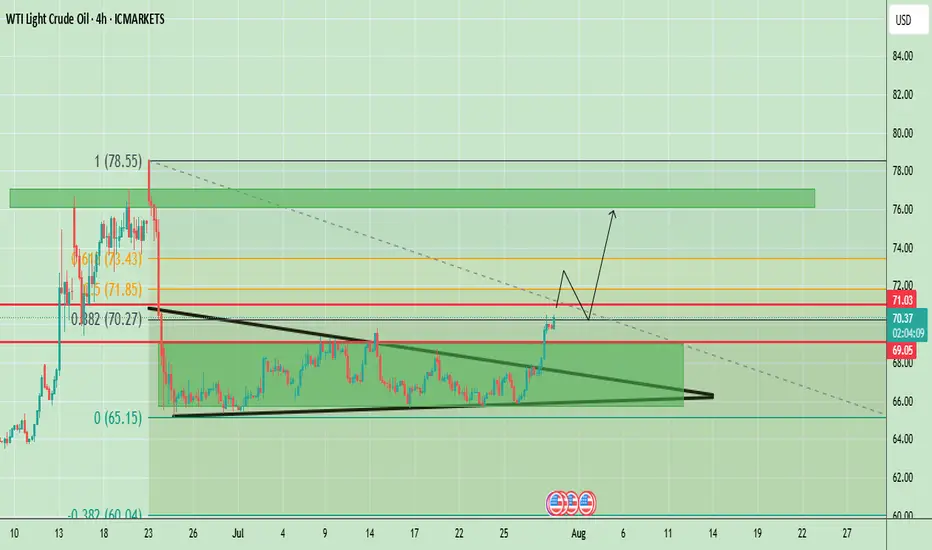
WTI Crude Oil Breaks Out of Symmetrical Triangle, $73-$76 ZoneThe WTI Crude Oil chart shows a strong breakout from the symmetrical triangle pattern that was forming for several weeks. Price has decisively broken above the descending resistance trendline and is now testing the $70–$71 area, which aligns with the 0.382 Fibonacci retracement level (around $70.27) and an important horizontal resistance ($71.03). This breakout indicates strong bullish momentum, supported by the recent series of higher lows and a sharp upward move in recent sessions.
If price sustains above $69.05 (previous breakout zone), we could see a bullish continuation towards $73.40 (0.118 Fibonacci) and potentially to $76.00–$76.50, which is the upper resistance block marked on the chart. However, if the price fails to hold above $69.00, there could be a pullback to retest the broken triangle resistance around $67–$68 before any next bullish leg.
Weekly Chart
The weekly chart of WTI Crude Oil is showing a long-term downtrend channel, where price has been consistently making lower highs and lower lows since mid-2023. Currently, oil is trading around $69.96, showing a sharp bullish push of 6.13% for the week. However, the price is still inside the broader descending channel, which keeps the long-term trend bearish unless a confirmed breakout occurs.
Key Resistance Levels:
- $70.27, $71.03, $73.43
Support Levels:
- $69.05 (previous breakout zone)
- $67.00–$68.00 (triangle retest area)
Trend Outlook:
- Short-Term: Bullish momentum; pullbacks likely to hold above $69.05.
- Medium-Term: If $71.85 breaks, price may target $76.00–$76.50 resistance.
Note
Please risk management in trading is a Key so use your money accordingly. If you like the idea then please like and boost. Thank you and Good Luck!
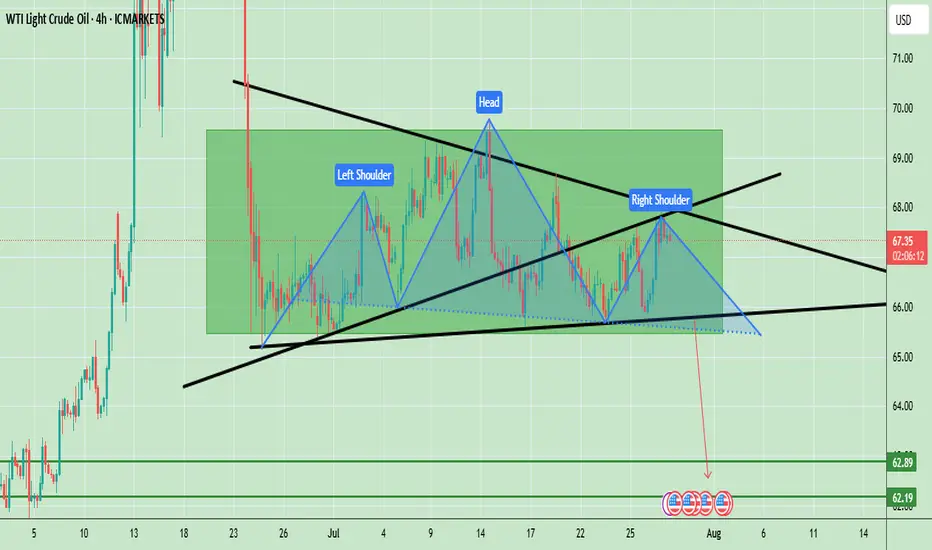
Oil Prices Form Bearish Head & Shoulders – Key Neckline in FocusWTI crude oil is showing a clear Head and Shoulders (H&S) pattern, which is a strong bearish reversal signal. The left shoulder formed in early July, followed by a higher peak forming the head in mid-July, and finally the right shoulder near the current levels, which is lower than the head. The neckline is positioned around $66.00, acting as a key support level. Currently, the price is trading at $67.34, hovering slightly above this neckline, indicating that the market is at a critical decision point. A confirmed break below the neckline could accelerate bearish momentum, targeting the $62.20 – $62.80 zone based on the pattern’s measured move. However, if the neckline holds, a possible bounce toward $68.50 – $69.00 could occur, but overall bias remains bearish unless the price can break and sustain above $69.00.
Key Price Levels:
- Resistance: $68.50 – $69.00
- Neckline Support: $66.00
- Bearish Target (if confirmed): $62.20 – $62.80
Note
Please risk management in trading is a Key so use your money accordingly. If you like the idea then please like and boost. Thank you and Good Luck!
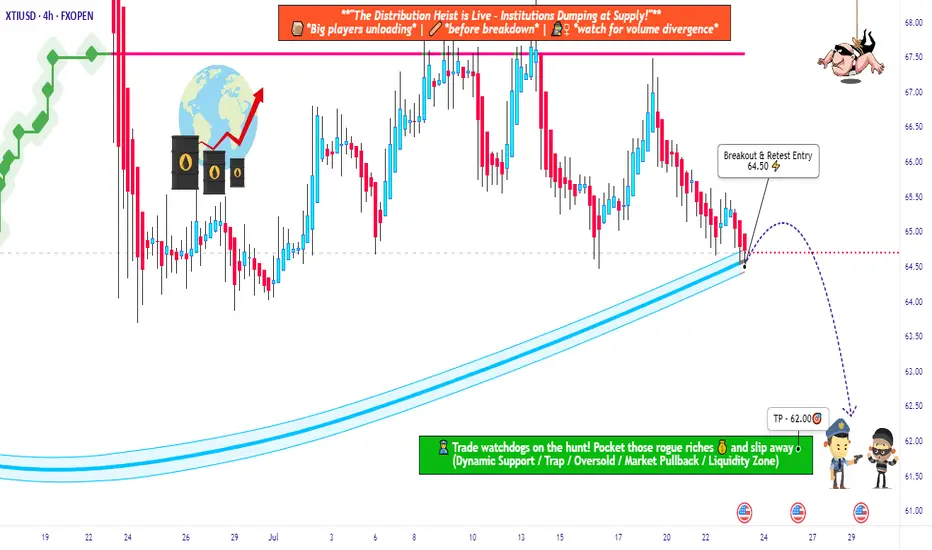
USOIL Robbery Alert! Smart Entry Plan Below Key MA Level🔐💥 “WTI Energy Heist: Thief Trader’s Bearish Master Plan” 💥🔐
The Official Robbery Blueprint for Smart Traders
🌟 Hi! Hola! Ola! Bonjour! Hallo! Marhaba! 🌟
💸 Welcome, Money Makers & Market Robbers! 💸
🚨 Get ready to break into the "US Oil Spot/WTI" market with precision-crafted bearish strategy from the one and only — Thief Trader Style!
📉💣 THE HEIST IS ON: SHORT PLAN LOADED! 💣📉
We’ve analyzed the charts using Thief Technicals + Fundamental Lockpick Tools and spotted a high-risk GREEN zone – a consolidation trap where greedy bulls usually get caught. This is where we strike.
🔑 ENTRY:
"Wait for the Neutral Moving Average to Break — Then Make Your Move!"
🎯 Focus zone: 64.50
☠️ Wait for the breakout – do NOT enter before it happens.
✅ Use sell stop orders above the MA line or place sell limit orders on the pullback after the breakout (target within the 15–30 min candle near swing high/low).
🧠 Thief Tip: Layer in entries using the DCA (layered attack strategy) to catch price on its way down. Set a chart alert so you don’t miss the strike moment.
🛑 STOP LOSS:
"Set it smart or don’t set it at all — you choose the fire you want to play with!"
📍 SL only gets placed AFTER breakout.
🎯 Recommended SL at 66.00 on the 4H swing level.
☠️ DO NOT place any orders or SL before confirmation breakout.
📊 Your SL depends on your risk %, lot size, and number of entries stacked.
🎯 TARGET ZONE: 62.50
💸 Lock profits before the bulls wake up. This level is based on market exhaustion zones and historical bounce areas.
🧠 WHY WE'RE SHORTING THIS?
This isn’t just a chart move — it’s backed by full-scale robbery research:
📰 COT Reports
📈 Macro & Seasonal Trends
🛢️ Crude Oil Inventories
💹 Sentiment & Intermarket Correlation
📉 Supply-Demand Dynamics
📚 Before pulling the trigger, educate yourself with the fundamentals. Dive into COT, Seasonal, and Macro reports. Don’t rob blindly — rob smart.
⚠️ Risk Management Alert:
Major news releases? Step back.
Trailing stops? Lock it in.
Position sizing? Know your risk.
Trade like a professional robber, not a street pickpocket.
💥💖 SUPPORT THE ROBBERY PLAN 💖💥
🧨 Smash that BOOST button to support this trading style and help more traders rob the market clean. Every like, every boost makes this community stronger.
💬 Drop a comment, share your entry levels, or post your winning trades.
This is a trading crew – we rob together, we profit together.
🔔 Stay tuned — more heist plans dropping soon.
Until then... Rob Smart. Trade Hard. Take Profits. 💰💪🎯
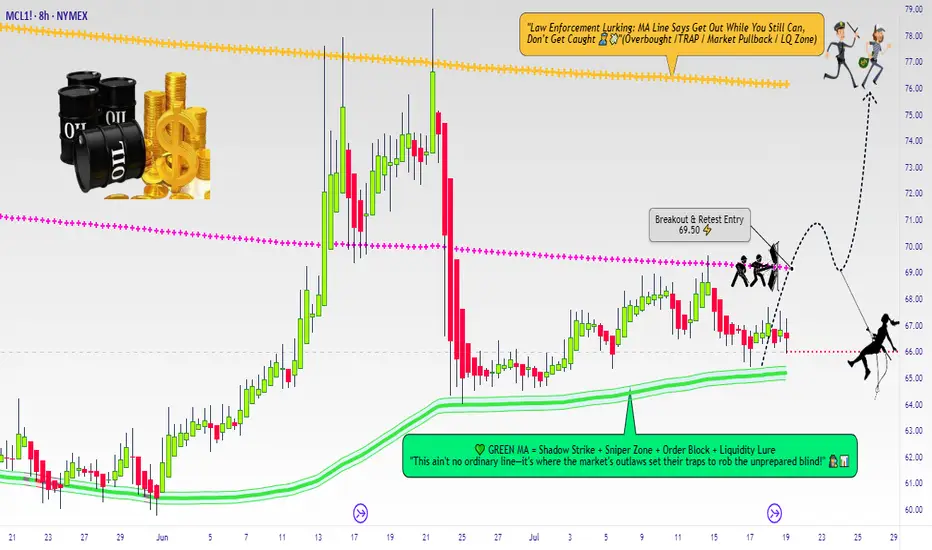
Micro WTI Swing Breakout Setup – Robbing Liquidity the Smart Way🛢️ "Crude Ops: The WTI Energy Vault Breakout Plan" 🛢️
(A Thief Trader Swing Setup | MA Breakout Trap Heist 💰💥)
🌍 Hola! Bonjour! Marhaba! Hallo! Hello Robbers & Market Movers! 🌟
Welcome to another high-voltage heist mission straight from the Thief Trading Den. This ain’t just a chart—this is an Energy Market Extraction Plan based on real smart money footprints 🔎.
🔥 Master Robbery Setup: MICRO WTI CRUDE OIL FUTURES 🎯
We got a bullish breakout alert from the shadows! This is not a drill.
💣 ENTRY STRATEGY
💼 "The Heist Begins Above 68.50"
Watch the Moving Average (MA) zone closely—this is where weak hands get trapped and we slide in with stealth limit or breakout orders:
🛠️ Plan of Entry:
Buy Stop Order: Just above 68.500 (after confirmation of breakout ✅).
Buy Limit Layering (DCA): On pullbacks around 15m/30m swing lows for precision entries.
🧠 Pro Tip: Use alerts to catch the exact entry ignition spark—don't chase, trap with patience like a true thief.
🛑 STOP LOSS (SL)
⚠️ "No SL? That’s a rookie mistake."
SL should only be placed post-breakout using the 8H wick-based swing low (around 66.50).
💡 SL is your personal vault door—set it according to:
Lot size
Risk appetite
Layered entry strategy
📌 Reminder: No SL or order placement before breakout. Let the market show its hand first.
🎯 TARGET ZONE (Take Profit)
Primary Target: 76.00 🏁
But hey... the smartest robbers escape before alarms ring — so trail that stop, secure your profits, and vanish like smoke 🥷.
💥 FUNDAMENTAL & SENTIMENT CATALYSTS
🔥 Current bullish energy comes from:
📉 USD weakness
🏭 Crude inventory drawdowns
⚖️ Geopolitical supply shocks
🐂 Hedge funds scaling long per latest COT data
📊 Intermarket cues from risk-on assets
🧠 Do your diligence: Go check fundamentals, COTs, and macro narratives before entering. Info = Edge.
📢 RISK MANAGEMENT NOTE
🚨 Don't go wild. Market is volatile, especially around:
News drops 📉
Fed or OPEC speeches 🎙️
Crude inventory reports 🛢️
Pause entries during news events. Use trailing SLs to lock the vault behind you.
❤️ SUPPORT THE ROBBERY MISSION
💣 Smash that BOOST button if this plan hits your nerve.
Let’s keep robbing liquidity zones together and growing the Thief Trader Brotherhood 🕵️♂️💰.
📡 Stay tuned for the next stealth heist drop. We rob the market with class. 💎🚀
WTI(20250613)Today's AnalysisMarket news:
The number of initial jobless claims in the United States for the week ending June 7 was 248,000, higher than the expected 240,000, the highest since the week of October 5, 2024. The monthly rate of the core PPI in the United States in May was 0.1%, lower than the expected 0.30%. Traders once again fully priced in the Fed's two interest rate cuts this year.
Technical analysis:
Today's buying and selling boundaries:
66.96
Support and resistance levels:
69.10
68.30
67.78
66.13
65.61
64.81
Trading strategy:
If the price breaks through 67.78, consider buying in, and the first target price is 68.30
If the price breaks through 66.96, consider selling in, and the first target price is 66.13

Oil Price Reversal? Why I’m Bullish on WTI Right Now! 🛢️ WTI crude oil is showing renewed bullish momentum. This move is backed by a shift in sentiment following the recent U.S.–China tariff truce and positive trade headlines. While OPEC+ supply increases and elevated inventories remain headwinds, surprise U.S. crude draws and strong jet fuel demand are tightening the market. I’m watching the current retrace. As always, keep risk tight—oil can turn fast! 🚀🛢️📈

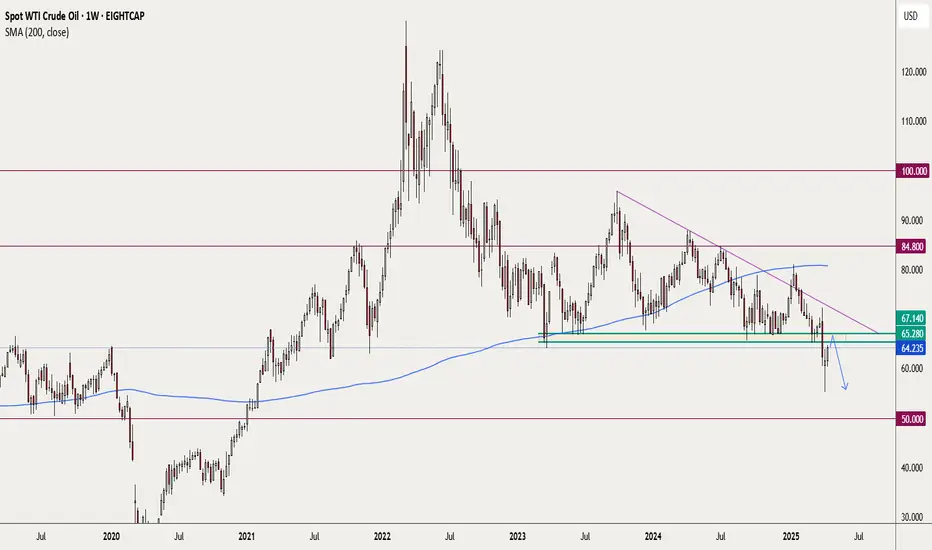
USOUSD (WTI crude) breakout-pullback-bearish continuation?Oil has been bearish for several months now and making mostly lower highs while the area between 67.140 and 65.280 has provided solid support. About 3 weeks ago a breakout below occurred and a pullback to the support zone is now in progress.
I will be monitoring PA closely next week to see if there is any evidence of bearish continuation. If bearish price action does resume, IMO, we could well see the round number 50.00 be achieved.
This is not a trade recommendation; it’s merely my own analysis. Trading carries a high level of risk, so only trade with money you can afford to lose and carefully manage your capital and risk. If you like my idea, please give a “boost” and follow me to get even more. Please comment and share your thoughts too!!
It’s not whether you are right or wrong, but how much money you make when you are right and how much you lose when you are wrong – George Soros
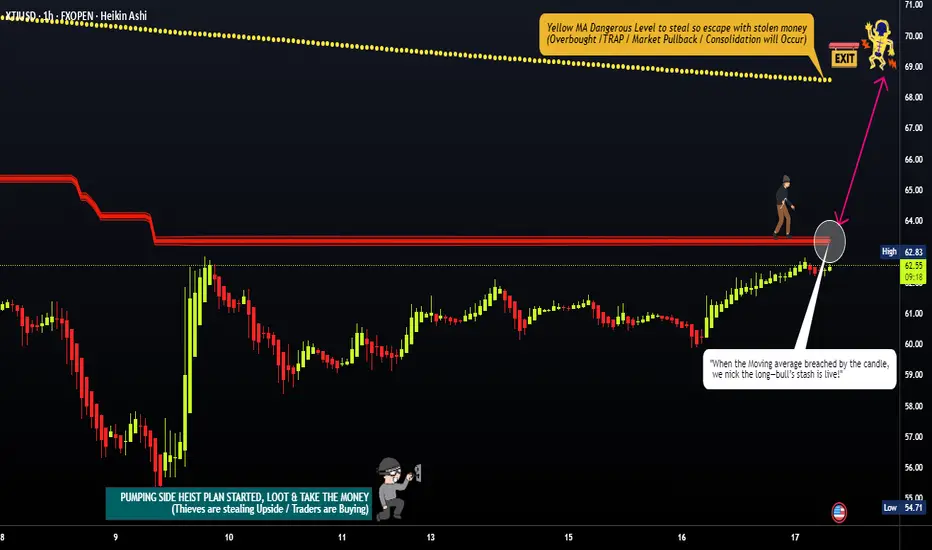
XTI/USD "WTI LIGHT CRUDE OIL" Heist Plan (Scalping/Day Trade)🌟Hi! Hola! Ola! Bonjour! Hallo! Marhaba!🌟
Dear Money Makers & Robbers, 🤑 💰💸✈️
Based on 🔥Thief Trading style technical and fundamental analysis🔥, here is our master plan to heist the XTI/USD "WTI LIGHT CRUDE OIL" Energy market. Please adhere to the strategy I've outlined in the chart, which emphasizes long entry. Our aim is to escape near the high-risk MA Zone. Risky level, overbought market, consolidation, trend reversal, trap at the level where traders and bearish robbers are stronger. 🏆💸"Take profit and treat yourself, traders. You deserve it!💪🏆🎉
Entry 📈 : "The heist is on! Wait for the MA breakout (64.00) then make your move - Bullish profits await!"
however I advise to Place Buy stop orders above the Moving average (or) Place buy limit orders within a 15 or 30 minute timeframe most recent or swing, low or high level for Pullback entries.
📌I strongly advise you to set an "alert (Alarm)" on your chart so you can see when the breakout entry occurs.
Stop Loss 🛑: "🔊 Yo, listen up! 🗣️ If you're lookin' to get in on a buy stop order, don't even think about settin' that stop loss till after the breakout 🚀. You feel me? Now, if you're smart, you'll place that stop loss where I told you to 📍, but if you're a rebel, you can put it wherever you like 🤪 - just don't say I didn't warn you ⚠️. You're playin' with fire 🔥, and it's your risk, not mine 👊."
📍 Thief SL placed at the recent/swing low level Using the 1H timeframe (59.00) Day trade basis.
📍 SL is based on your risk of the trade, lot size and how many multiple orders you have to take.
🏴☠️Target 🎯: 68.70
🧲Scalpers, take note 👀 : only scalp on the Long side. If you have a lot of money, you can go straight away; if not, you can join swing traders and carry out the robbery plan. Use trailing SL to safeguard your money 💰.
🛢️ XTI/USD "WTI LIGHT CRUDE OIL" Energy Market Heist Plan (Scalping/Day) is currently experiencing a bullishness,., driven by several key factors. ☝☝☝
📰🗞️Get & Read the Fundamental, Macro Economics, COT Report, Seasonal Factors, Intermarket Analysis, Inventory and Storage Analysis, Sentimental Outlook, Future trend targets and Overall outlook score..., Go ahead to check 👉👉👉🔗
⚠️Trading Alert : News Releases and Position Management 📰 🗞️ 🚫🚏
As a reminder, news releases can have a significant impact on market prices and volatility. To minimize potential losses and protect your running positions,
we recommend the following:
Avoid taking new trades during news releases
Use trailing stop-loss orders to protect your running positions and lock in profits
💖Supporting our robbery plan 💥Hit the Boost Button💥 will enable us to effortlessly make and steal money 💰💵. Boost the strength of our robbery team. Every day in this market make money with ease by using the Thief Trading Style.🏆💪🤝❤️🎉🚀
I'll see you soon with another heist plan, so stay tuned 🤑🐱👤🤗🤩
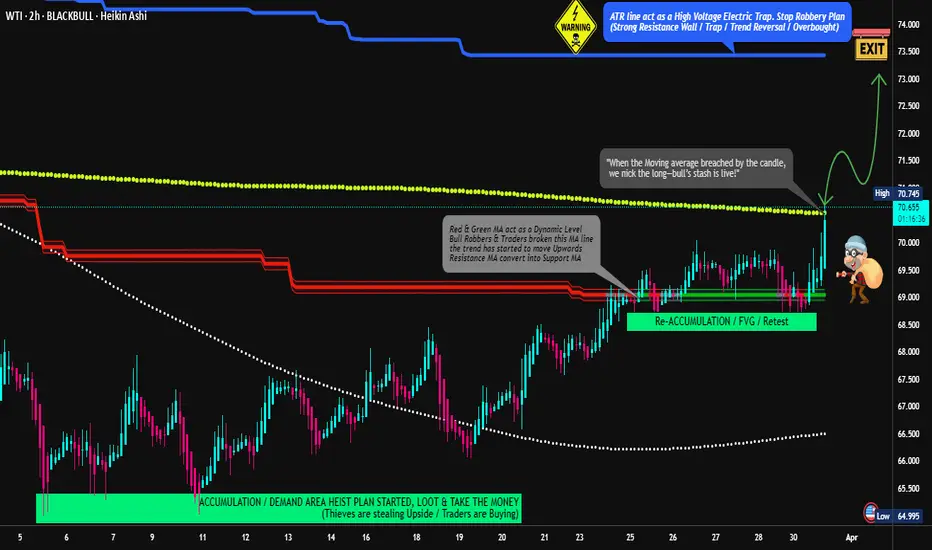
XTI/USD "WTI Crude Oil" Energy Market Heist Plan (Scalping/Day)🌟Hi! Hola! Ola! Bonjour! Hallo! Marhaba!🌟
Dear Money Makers & Robbers, 🤑 💰💸✈️
Based on 🔥Thief Trading style technical and fundamental analysis🔥, here is our master plan to heist the XTI/USD "WTI Light Crude Oil" Energy Market. Please adhere to the strategy I've outlined in the chart, which emphasizes long entry. Our aim is the high-risk ATR Zone. Risky level, overbought market, consolidation, trend reversal, trap at the level where traders and bearish robbers are stronger. 🏆💸"Take profit and treat yourself, traders. You deserve it!💪🏆🎉
Entry 📈 : "The heist is on! Wait for the MA breakout (71.000) then make your move - Bullish profits await!"
however I advise to Place Buy stop orders above the Moving average (or) Place buy limit orders within a 15 or 30 minute timeframe most recent or swing, low or high level.
📌I strongly advise you to set an "alert (Alarm)" on your chart so you can see when the breakout entry occurs.
Stop Loss 🛑:
Thief SL placed at the recent/swing low level Using the 1H timeframe (68.500) Day / scalping trade basis.
SL is based on your risk of the trade, lot size and how many multiple orders you have to take.
🏴☠️Target 🎯: 73.500 (or) Escape Before the Target
🧲Scalpers, take note 👀 : only scalp on the Long side. If you have a lot of money, you can go straight away; if not, you can join swing traders and carry out the robbery plan. Use trailing SL to safeguard your money 💰.
🛢🔥XTI/USD "WTI Light Crude Oil" Energy Market Heist Plan (Day/Scalping Trade) is currently experiencing a bullishness,., driven by several key factors.
📰🗞️Get & Read the Fundamental, Macro, COT Report, Inventory and Storage Analysis, Seasonal Factors, Sentimental Outlook, Intermarket Analysis, Future trend targets.. go ahead to check 👉👉👉🔗
⚠️Trading Alert : News Releases and Position Management 📰 🗞️ 🚫🚏
As a reminder, news releases can have a significant impact on market prices and volatility. To minimize potential losses and protect your running positions,
we recommend the following:
Avoid taking new trades during news releases
Use trailing stop-loss orders to protect your running positions and lock in profits
💖Supporting our robbery plan 💥Hit the Boost Button💥 will enable us to effortlessly make and steal money 💰💵. Boost the strength of our robbery team. Every day in this market make money with ease by using the Thief Trading Style.🏆💪🤝❤️🎉🚀
I'll see you soon with another heist plan, so stay tuned 🤑🐱👤🤗🤩
USOil Key Resistance Hit: Is WTI Crude Due for a Correction?WTI crude oil appears overextended after a strong bullish rally, trading into a key resistance level amid heightened geopolitical tensions and market volatility. The current price action suggests a potential retracement, with equilibrium around the 50% Fibonacci level being a likely target for correction 📉. Given the reactionary nature of the market, traders should remain cautious as political developments could drive further instability ⚠️. While the technical setup supports a pullback, external factors may disrupt this scenario, so risk management is essential. 📊
Disclaimer: This analysis is for informational purposes only and does not constitute financial advice. Always conduct your own research before making trading decisions.

Market Analysis: WTI Crude Oil Face HurdlesMarket Analysis: WTI Crude Oil Face Hurdles
Crude oil is attempting a recovery wave but upsides could be limited.
Important Takeaways for WTI Crude Oil Price Analysis Today
- WTI Crude oil prices started a recovery wave from the $66.00 support zone.
- There is a key bullish trend line forming with support at $67.50 on the hourly chart of XTI/USD at FXOpen.
WTI Crude Oil Price Technical Analysis
On the hourly chart of WTI Crude Oil at FXOpen, the price remained in a bearish zone below the $70.00 level against the US Dollar. The price started a fresh decline below the $68.00 support.
The price even dipped below the $67.50 level and the 50-hour simple moving average. Finally, the bulls appeared near $66.00 and the price started a recovery wave. The price recovered above $67.50 and tested the $68.50 zone.
The price is now consolidating gains below the 23.6% Fib retracement level of the upward move from the $66.54 swing low to the $68.48 high. There is also a key bullish trend line forming with support at $67.50.
If there is a fresh increase, it could face resistance near the $68.30 level. The first major resistance is near the $68.50 level. Any more gains might send the price toward the $69.20 level.
The main resistance could be near the $70.00 level. Conversely, the price might continue to move down and revisit the $67.50 support and the 50% Fib retracement level of the upward move from the $66.54 swing low to the $68.48 high. The next major support on the WTI crude oil chart is $67.00.
If there is a downside break, the price might decline toward $66.55. Any more losses may perhaps open the doors for a move toward the $66.10 support zone.
This article represents the opinion of the Companies operating under the FXOpen brand only. It is not to be construed as an offer, solicitation, or recommendation with respect to products and services provided by the Companies operating under the FXOpen brand, nor is it to be considered financial advice.
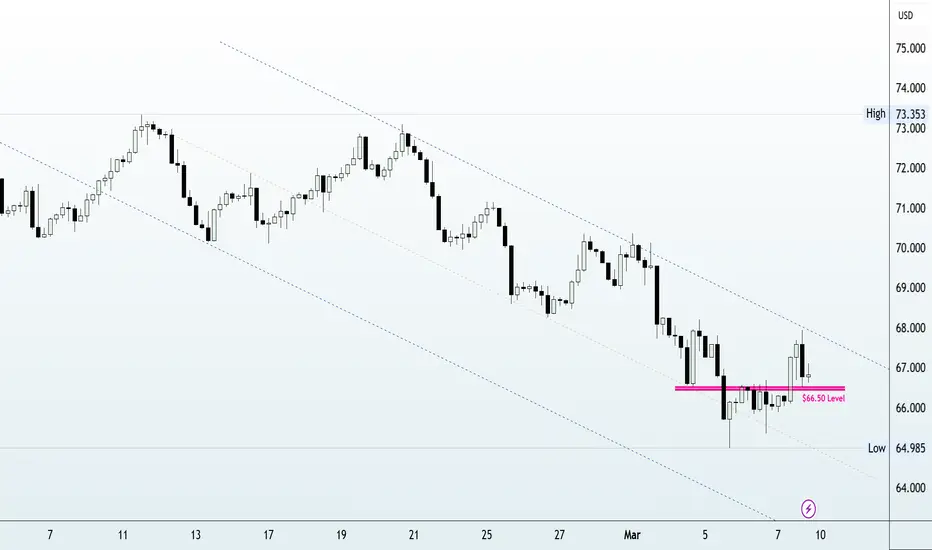
WTI Price Analysis: Key Insights for Next Week Trading DecisionMarket Overview:
📉 WTI at $66.00: Trading defensively near a three-year low amid tariff concerns and OPEC+ output hikes.
📊 Inventory Build: A larger-than-expected US crude inventory build (up by 3.614M barrels vs. a forecasted decline) is adding pressure on prices.
⚖️ Tariff Uncertainty: Despite Trump's recent executive order exempting goods from Canada and Mexico under USMCA, overall tariff uncertainty remains a key concern.
🔺 OPEC+ Output Increase: For the first time since 2022, OPEC+ has ramped up production, weighing further on WTI.
Technical Insights:
📉 Descending Channel: The 4H chart shows a clear descending channel. Watch for the potential break of the channel's resistance line to the upside.
🎯 Key Level: Next week, the critical level to monitor is $66.50 – consider a buy if prices break above, and sell if they remain below.
Upcoming Catalysts:
⏰ US Employment Data: Keep an eye on the Consumer Price Index, Producer Price Index, Michigan Consumer Sentiment Index, EIA and API report. A weaker-than-expected report could lift the USD and boost oil prices.
Stay Tuned:
I'll provide a detailed update at the beginning of next week. Follow along for more insights and actionable trading strategies!
#WTI #CrudeOil #OilTrading #OilMarket #CommodityTrading #EnergyMarket #OilPrice #MarketAnalysis #TradingInsights #OPEC
Happy trading!
Disclaimer:
Forex and other market trading involve high risk and may not be for everyone. This content is educational only—not financial advice. Always assess your situation and consult a professional before investing. Past performance doesn’t guarantee future results.
WTI Oil Trade IdeaWTI oil has reached a key support zone and appears overextended on the four-hour chart. I'm considering a counter-trend scalp, as demonstrated in the video. This is not financial advice.

WTI Oil Short: Bearish Setup After Sharp RallyOil prices have surged impressively, fueled by recent fundamental-driven market moves. However, this swift upside has led WTI crude to my point of interest, offering a prime opportunity to short against the trend. My trade strategy includes taking partials at the $74 price zone. Here’s why this setup is supported by bearish fundamentals:
1. Rising U.S. Fuel Inventories
Recent data shows significant growth in U.S. gasoline and distillate stockpiles, hinting at a potential oversupply in the market.
2. Strengthening U.S. Dollar
A stronger dollar makes oil more expensive for holders of other currencies, reducing global demand and weighing on prices.
3. Increased Non-OPEC Supply
With rising production levels from non-OPEC countries, analysts expect an oversupplied market in 2025, adding further pressure on oil prices.
4. Weakening Global Demand
Economic growth concerns in major markets like China and Germany are fostering expectations of reduced oil demand, reinforcing a bearish outlook.
These combined factors strongly support a short position on WTI crude oil. Stay strategic, take profits along the way, and manage your risk carefully in this volatile environment!
Note: Please remember to adjust this trade idea according to your individual trading conditions, including position size, broker-specific price variations, and any relevant external factors. Every trader’s situation is unique, so it’s crucial to tailor your approach to your own risk tolerance and market environment.
WTI Breakdown: Bearish Structure & Possible Trade Opportunity 👀 👉 Analyzing the WTI chart, we can observe a lower high and a lower low, indicating a bearish break in structure. I anticipate some additional downside movement. In the video, we delve into the trend, price action, market structure, and explore a potential trade opportunity. ⚠️ This content is for educational purposes only and does not constitute financial advice.

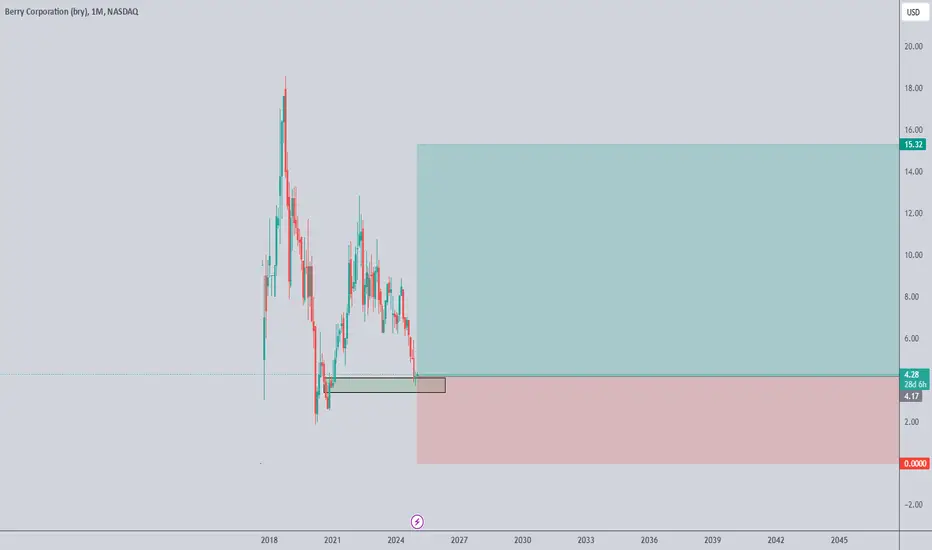
Berry Corporation - 13.5% dividend yieldBerry is in the oil and gas sector, where its current low share price and improved financials offer upside potential, albeit with higher risk
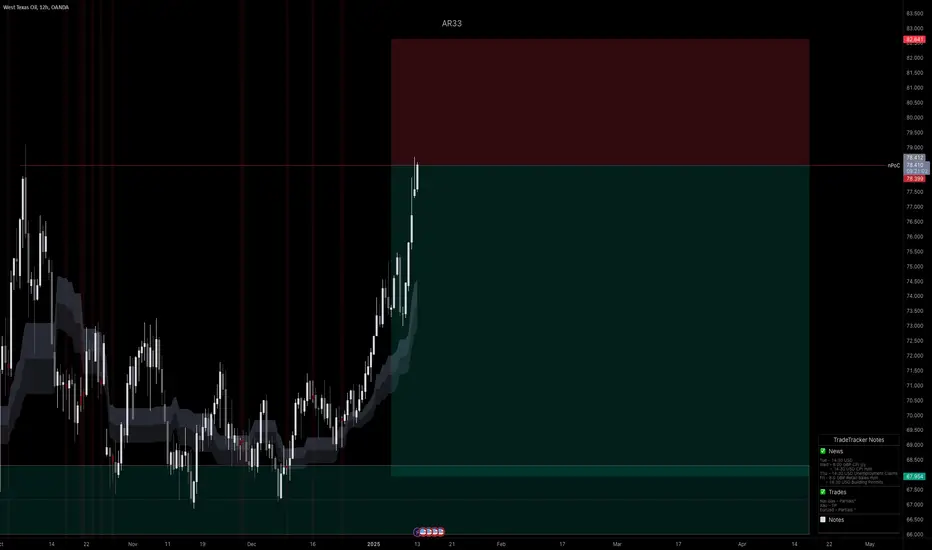
WTICOUSD , high time frame
Hello traders, I would like to discuss West Texas oil. There is a critical zone on the chart, as anticipated. Oil is currently in a bullish trend on the higher timeframes. Presently, the price is in OB on the 4-hour chart, and during the Asian session, there are indications of a potential decrease to $69 before targeting the $75 zone.
---
If you require further adjustments or have specific areas you wish to focus on, please feel free to let me know!
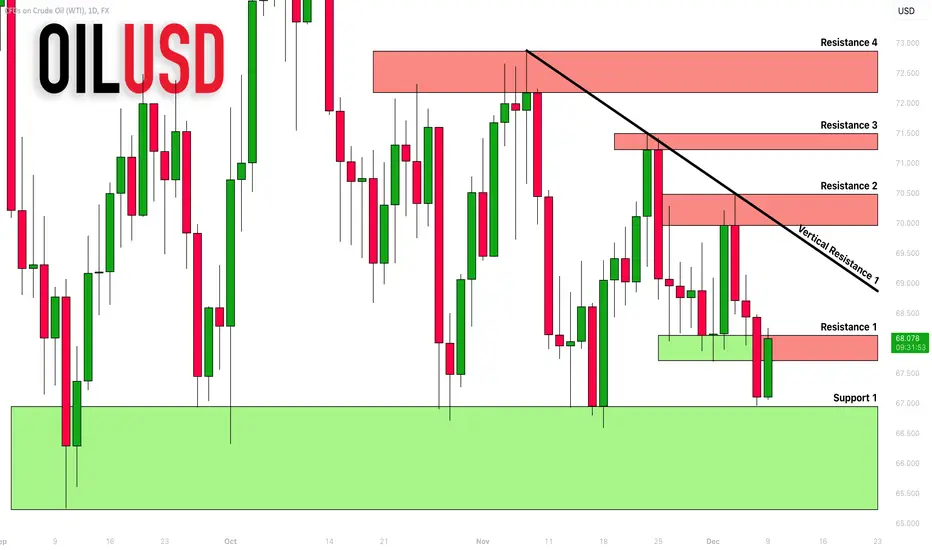
CRUDE OIL (WTI): Support & Resistance Analysis
Here is my latest structure analysis and important
supports and resistances on WTI Oil on a daily.
Horizontal Structures
Support 1: 65.2 - 66.9 area
Resistance 1: 67.7 - 62.2 area
Resistance 2: 69.9 - 70.5 area
Resistance 3: 71.2 - 71.5 area
Resistance 4: 72.2 - 72.9 area
Vertical Structures
Vertical Resistance 1: Falling trend line
Consider these structures for pullback/breakout trading.
❤️Please, support my work with like, thank you!❤️
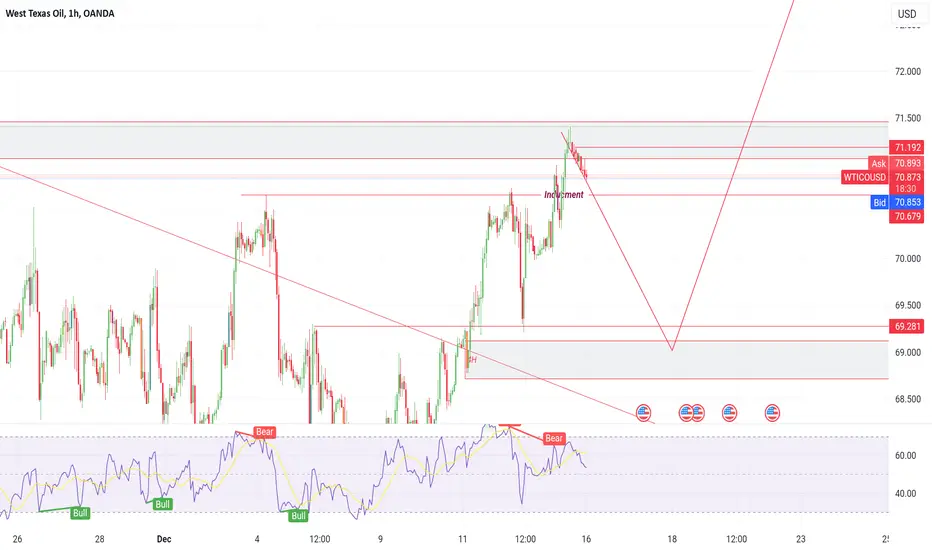
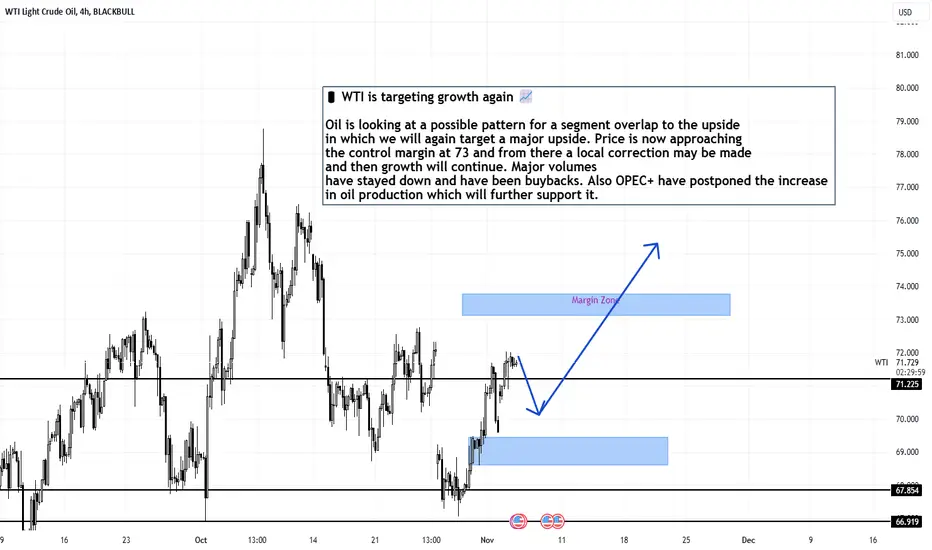
WTI is targeting growth again. H4 05.11.2024🛢 WTI is targeting growth again 📈
Oil is looking at a possible pattern for a segment overlap to the upside in which we will again target a major upside. Price is now approaching the control margin at 73 and from there a local correction may be made and then growth will continue. Major volumes have stayed down and have been buybacks. Also OPEC+ have postponed the increase in oil production which will further support it.
BLACKBULL:WTI
Bears wade into crude oil futures: CL1!An influx of short bets against WTI crude oil futures is behind the recent leg lower for oil prices. But having already fallen nearly 14% over eight days, bears may want to tread carefully with a fresh catalyst. Matt Simpson takes a look at the weekly, daily and 4-hour chart alongside large speculative positioning.

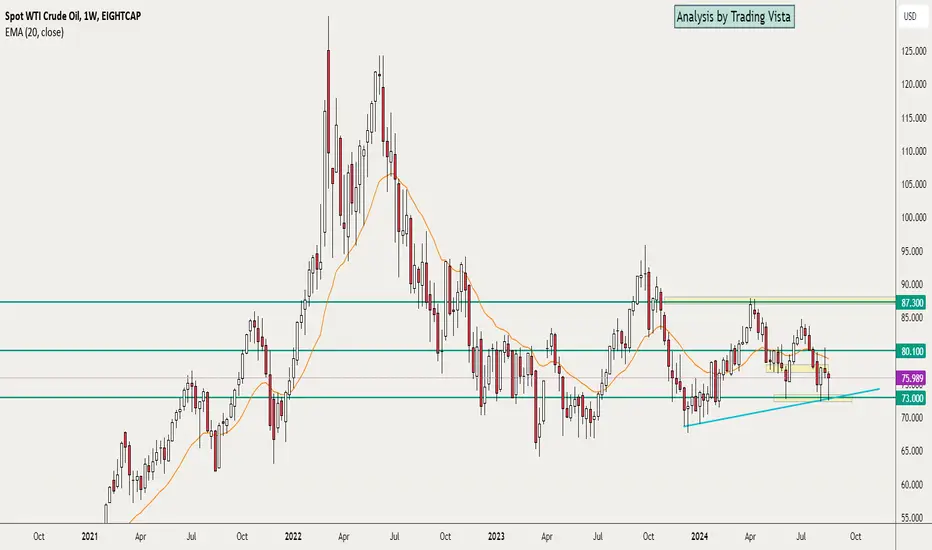
USOUSD (WTI Crude) strong bullish move likely … week of 26 AugA ‘hammer candle’ is one of my favorites and we can see a nice one in the weekly chart of oil. It also appears at a major support (73.00) and at a rising trend line. If you are not a fan of the hammer candle like I am, just look left on my chart and see what happened in the past when this candle appeared.
But “when” to trade is always a question, directional bias is only a part of our decision making. I will, first of all be looking for USD weakness and CAD strength (correlation). Monitoring PA on the H4 and H1 is always a good idea too. Evidence of bullish PA would justify taking a long trade. However, if a move to the downside forms, that would negate my analysis.
This is not a trade recommendation. You should be aware that trading carries a high level of risk, so only trade with money you can afford to lose. Please use sound money and risk management, trading without a stop or moving the stop away from price is a recipe for disaster.
If you like my idea, please give a “boost” and follow me to get even more.
Please comment and share your thoughts too!!
It’s not whether you are right or wrong, but how much money you make when you are right and how much you lose when you are wrong – George Soros