WTI Global analysis of crude oil trade
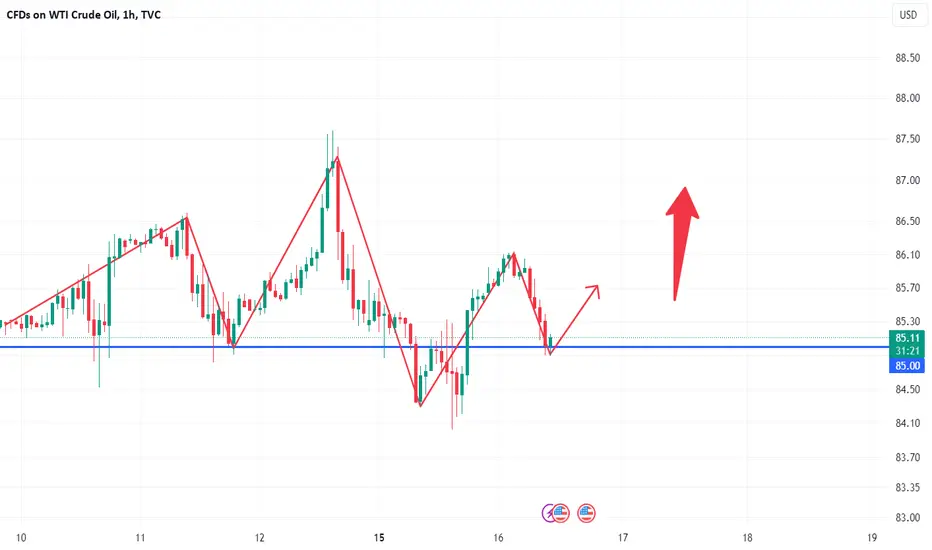
The overall trend of crude oil bottomed out yesterday and rebounded. The MA5 position of the weekly line fell back and rebounded, and the middle track of the daily line did not break below. This shows that the market is still strong. In addition, the conflict between Iran and Israel will boost crude oil, so it is good to be bullish. After all, the current situation in the Middle East is a mess. Crude oil has once again returned to the old point to see a rise, that is, go long around 85, add positions at 84.5, defend 84, and look at 86-87!
Wtianalysis
Crude oil fluctuates and rises, and is about to go up
WTI crude oil prices rose choppily despite a somewhat downbeat inventory report from the U.S. Energy Information Administration (EIA) and a stronger-than-expected March consumer price index (CPI) report (which may further delay the Federal Reserve's first rate cut). The current geopolitical environment continues to provide support for oil prices.
Crude oil real-time market analysis: The 4-hour upper track pressure is at the 87 mark. The daily SAR indicator has appeared at a high level and diverged downwards since yesterday. The current extension point is at the 87.5 line. The defensive resistance lies in the daily Bollinger Band upper track position of 88.1. If crude oil prices break down, focus on the 84 mark and the daily MA5 moving average of 83.5. On the whole, crude oil prices continue to fluctuate at high levels, and it is enough to maintain the high-sell-low-low mentality until it breaks the range.
U.S. trading strategy: Crude oil is recommended to go short in batches at 86.9-87.5, stop loss if it breaks 88.2, target 86-85, hold if it breaks below 84; go long when the low hits 84.5 (±2 points) for the first time, stop loss 83.7, target 85.5 -86.2;

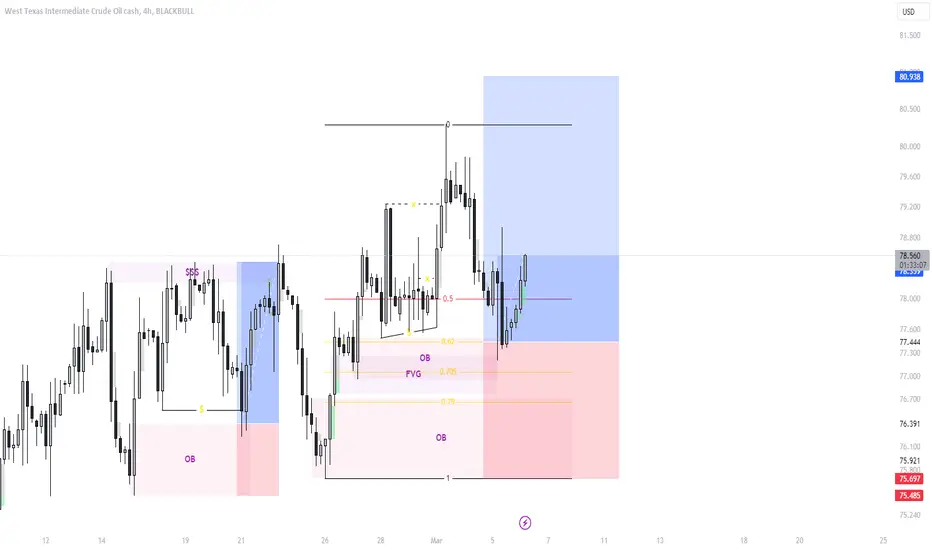
CrudeOil - Optimal Buying Zone !Hello everyone!
Here's my take on WTI:
OTE (Optimal Trade Entry)
Liquidity uptake.
An interesting zone.
An optimal Fibonacci.
No counter-trend.
🚀 If you liked it and want more, don't hesitate to subscribe and boost the post!
Questions? Leave a comment!
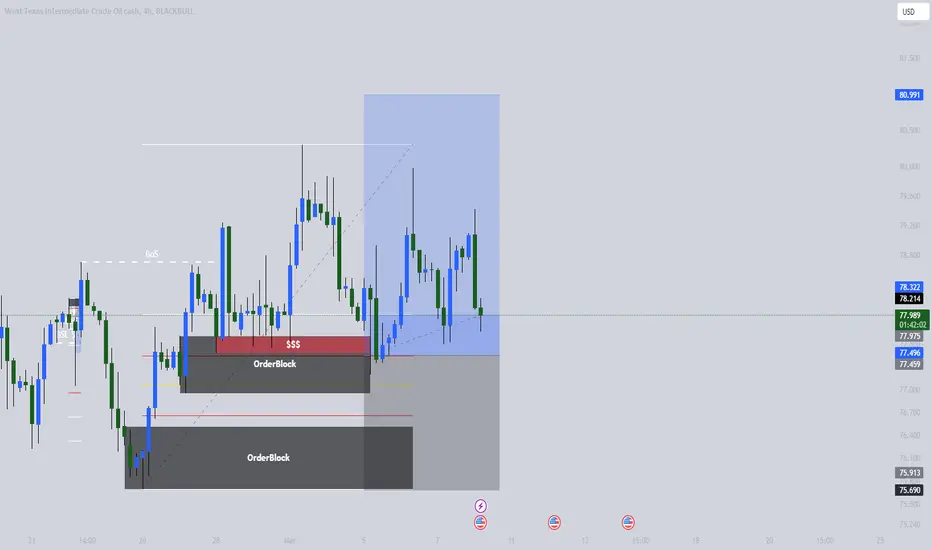
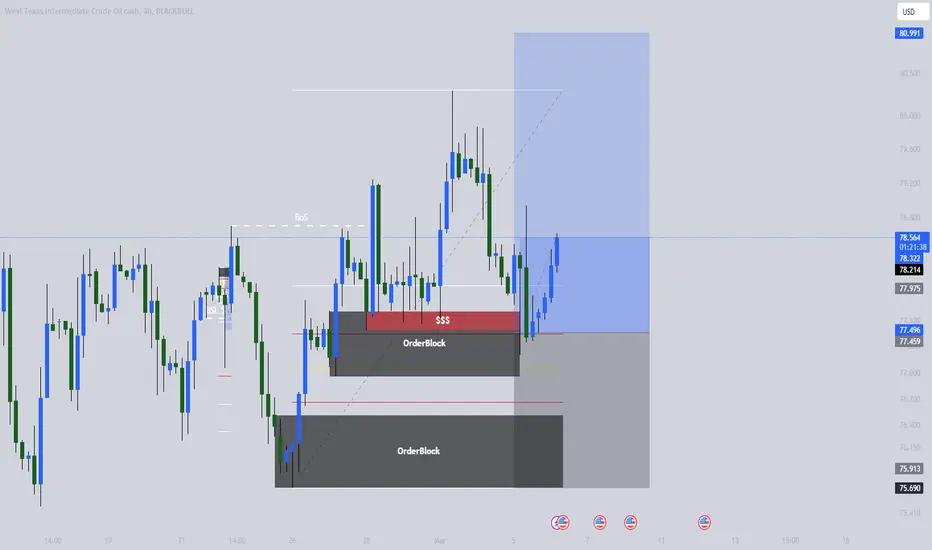
CRUDE OIL: I'm buying📊 Analysis on WTI:
👉 We're at an OTE (Optimal Trade Entry)
👉 Correction is underway
👉 A SOLID Order Block
👉 We're following the trend
👉 Targeting Liquidity $
🚀 If you liked it, don't forget to boost
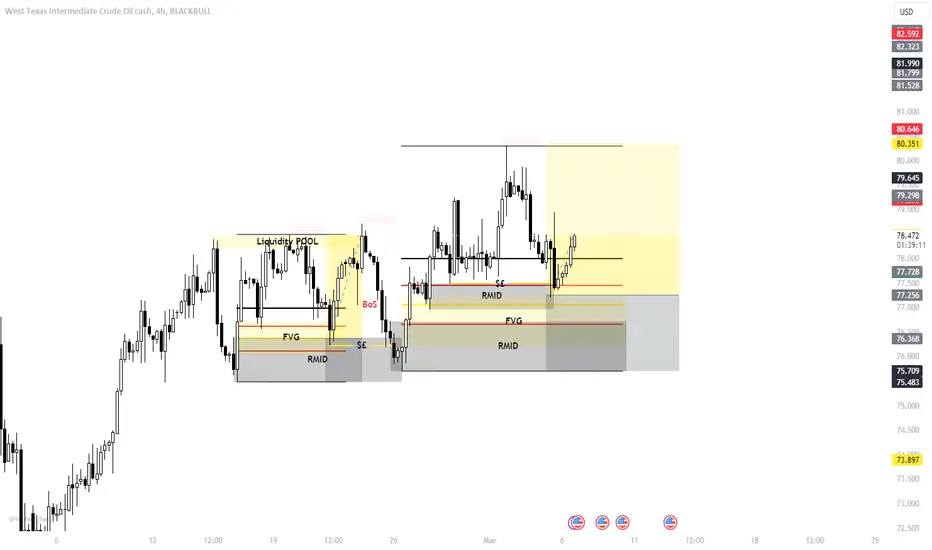
Crude Oil - Buy Zone!Hey there!
I'm Buying on WTI: (Second trade)
-RMID (Range Manipulation Initiation Distribution)
-We have liquidity uptake.
-We have an interesting zone.
-We have the optimal Fibonacci.
-We have accumulation before/on the zone.
-We are with the trend.
🚀 If you liked it and want more, don't hesitate to subscribe and boost the post!
Questions? Leave a comment
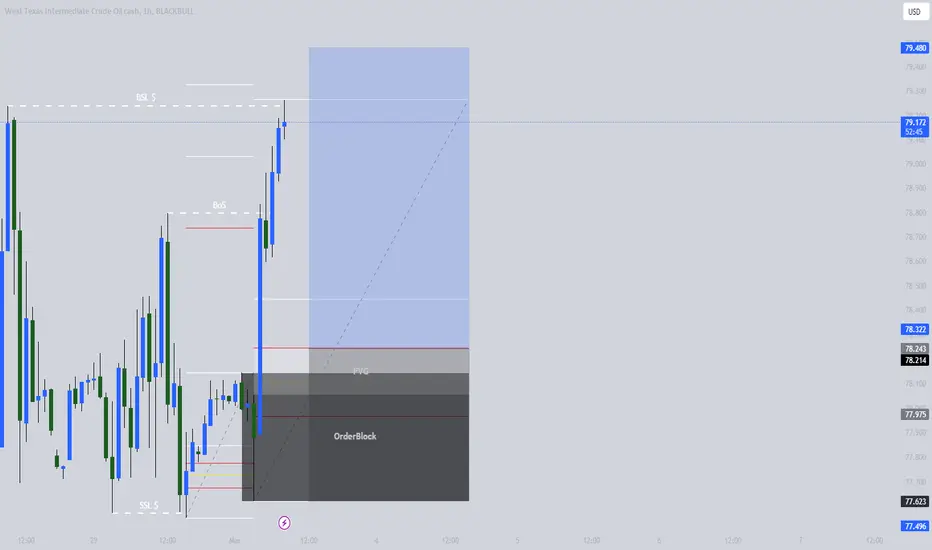
CrudeOil - Optimal Buying Zone !Hello everyone!
Here's my take on WTI:
OTE (Optimal Trade Entry)
Liquidity uptake.
An interesting zone.
An optimal Fibonacci.
No counter-trend.
🚀 If you liked it and want more, don't hesitate to subscribe and boost the post!
Questions? Leave a comment!
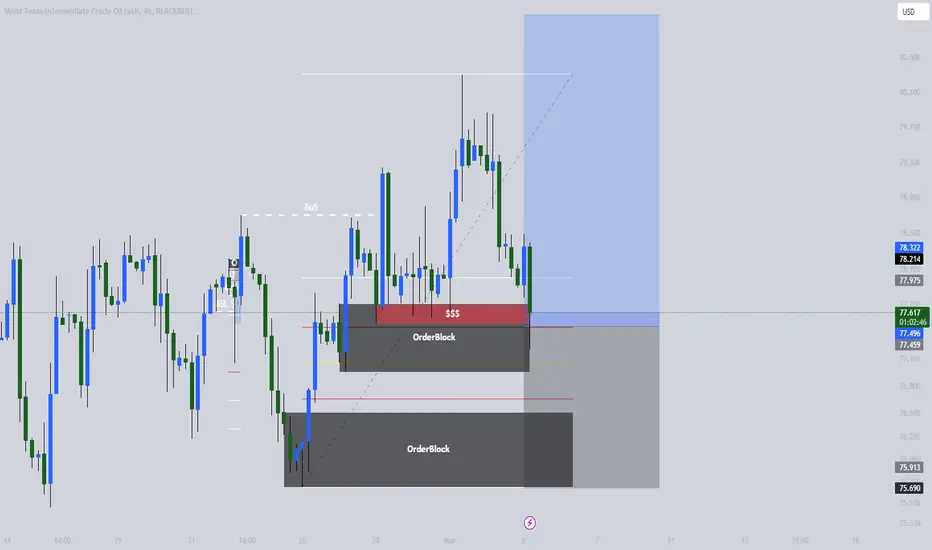
CRUDE OIL: I'm buying📊 Analysis on WTI:
👉 We're at an OTE (Optimal Trade Entry)
👉 Correction is underway
👉 A SOLID Order Block
👉 We're following the trend
👉 Targeting Liquidity $
🚀 If you liked it, don't forget to boost
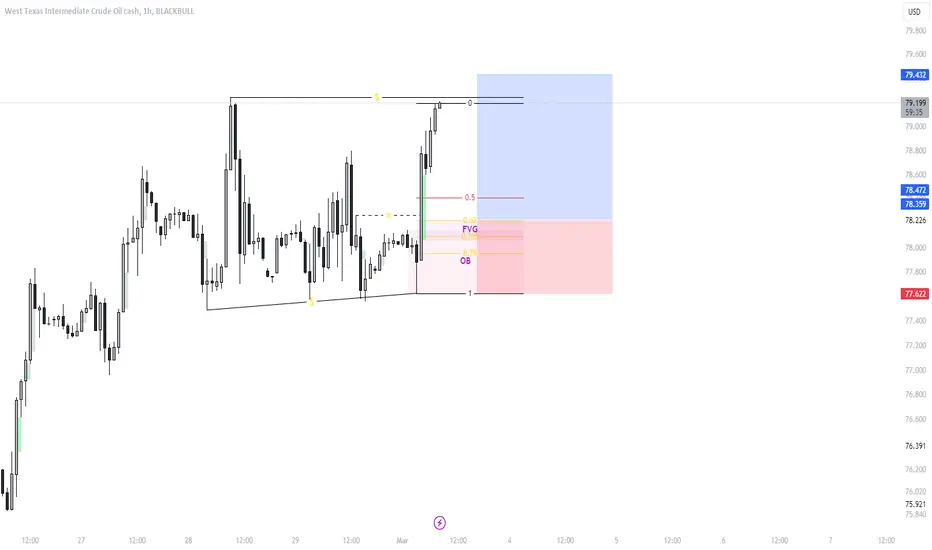
Crude Oil - Buy Zone!Hey there!
I'm Buying on WTI: (Second trade)
-RMID (Range Manipulation Initiation Distribution)
-We have liquidity uptake.
-We have an interesting zone.
-We have the optimal Fibonacci.
-We have accumulation before/on the zone.
-We are with the trend.
🚀 If you liked it and want more, don't hesitate to subscribe and boost the post!
Questions? Leave a comment
CrudeOil - Optimal Buying Zone !Hello everyone!
Here's my take on WTI:
OTE (Optimal Trade Entry)
Liquidity uptake.
An interesting zone.
An optimal Fibonacci.
No counter-trend.
🚀 If you liked it and want more, don't hesitate to subscribe and boost the post!
Questions? Leave a comment!
CRUDE OIL: I'm buying📊 Analysis on WTI:
👉 We're at an OTE (Optimal Trade Entry)
👉 Correction is underway
👉 A SOLID Order Block
👉 We're following the trend
👉 Targeting Liquidity $
🚀 If you liked it, don't forget to boost
Crude Oil - Buy Zone!Hey there!
I'm Buying on WTI: (Second trade)
-RMID (Range Manipulation Initiation Distribution)
-We have liquidity uptake.
-We have an interesting zone.
-We have the optimal Fibonacci.
-We have accumulation before/on the zone.
-We are with the trend.
🚀 If you liked it and want more, don't hesitate to subscribe and boost the post!
Questions? Leave a comment

In the short and medium term, WTI is mainly bought.
Due to delays in production cuts by OPEC countries. Oil experienced a slight decline, but some Arab countries decided to reduce production. So oil formed some support after a brief decline. As a resource product. To a certain extent, supply is also lower than demand, and the other is the promotion of geopolitics, so the operation is still based on buying at low prices. The club already has live signals announced.
In the mid-term, buying is also the main focus.

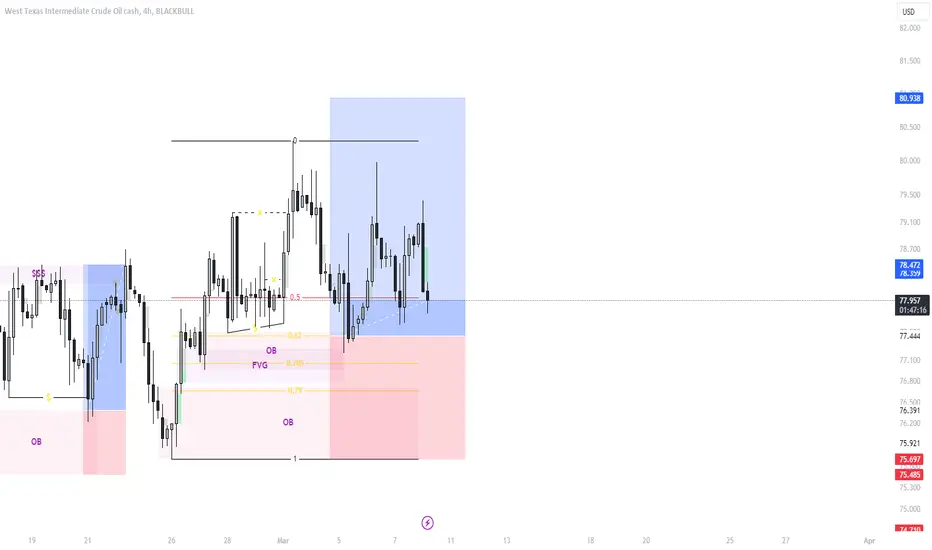
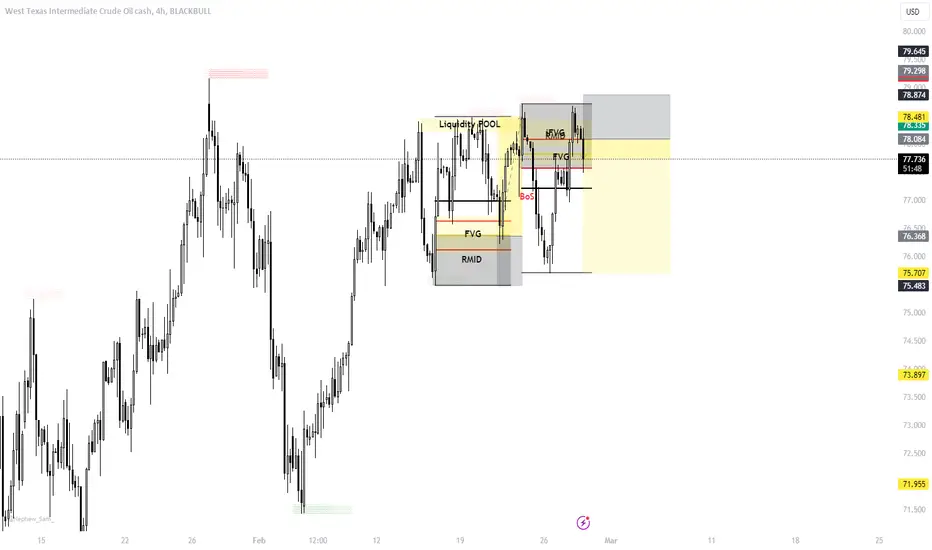
WTI OIL (USOIL) Technical AnalysisUpon examining the WTI (West Texas Intermediate) crude oil chart, we observe a robust bullish trend, accompanied by a retracement to the 78.6% Fibonacci level. This significant pullback warrants attention, as price action appears poised for a deeper correction.
In our analysis, we consider historical price swings, taking into account seasonality patterns from previous years at the same time. By doing so, we explore the likelihood that institutional players may be positioning themselves to drive prices lower, targeting liquidity zones below previous support levels. Additionally, an imbalance is evident on the 4-hour timeframe.
Disclaimer: This technical analysis serves as an opinion and should not be construed as financial advice. Traders and investors should conduct their due diligence and seek professional counsel before making any trading decisions.

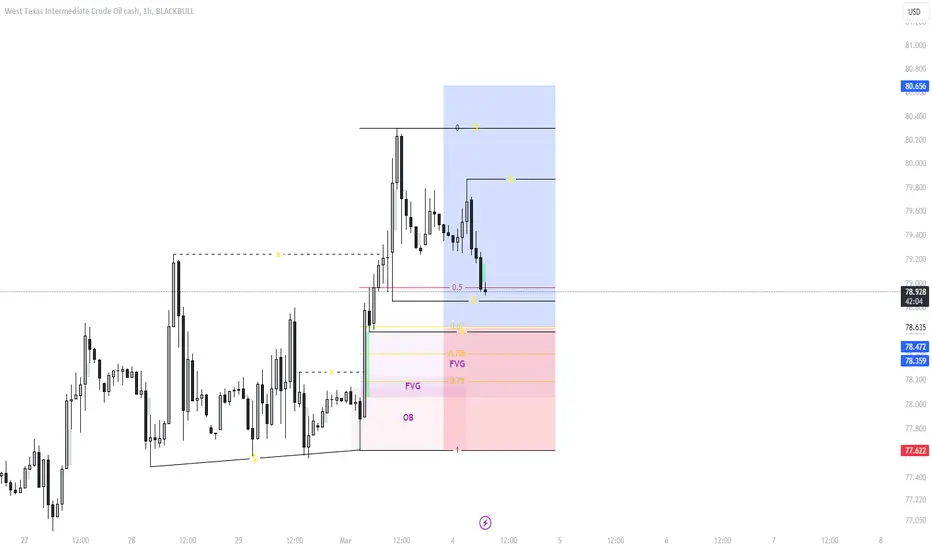
CrudeOil - Optimal Buying Zone !Hello everyone!
Here's my take on WTI:
OTE (Optimal Trade Entry)
Liquidity uptake.
An interesting zone.
An optimal Fibonacci.
No counter-trend.
🚀 If you liked it and want more, don't hesitate to subscribe and boost the post!
Questions? Leave a comment!
CRUDE OIL: I'm buying📊 Analysis on WTI:
👉 We're at an OTE (Optimal Trade Entry)
👉 Correction is underway
👉 A SOLID Order Block
👉 We're following the trend
👉 Targeting Liquidity $
🚀 If you liked it, don't forget to boost
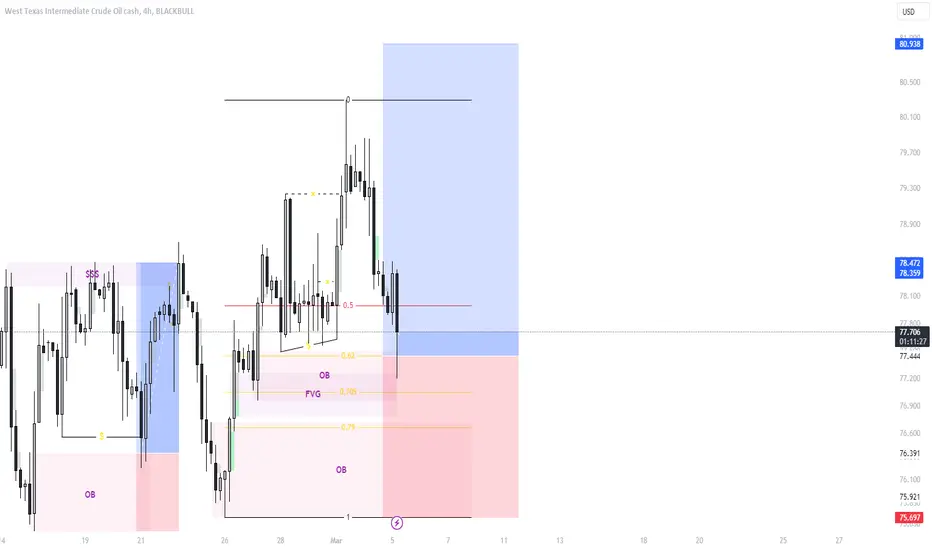
Crude Oil - Buy Zone!Hey there!
I'm selling on WTI: (Second trade)
-RMID (Range Manipulation Initiation Distribution)
-We have liquidity uptake.
-We have an interesting zone.
-We have the optimal Fibonacci.
-We have accumulation before/on the zone.
-We are with the trend.
🚀 If you liked it and want more, don't hesitate to subscribe and boost the post!
Questions? Leave a comment
PETROLE - Zone optimal de VENTE !Hello everyone!
Here's my take on WTI:
OTE (Optimal Trade Entry)
Liquidity uptake.
An interesting zone.
An optimal Fibonacci.
No counter-trend.
🚀 If you liked it and want more, don't hesitate to subscribe and boost the post!
Questions? Leave a comment!
CRUDE OIL: I'm buying📊 Analysis on WTI:
👉 We're at an OTE (Optimal Trade Entry)
👉 Correction is underway
👉 A SOLID Order Block
👉 We're following the trend
👉 Targeting Liquidity $
🚀 If you liked it, don't forget to boost
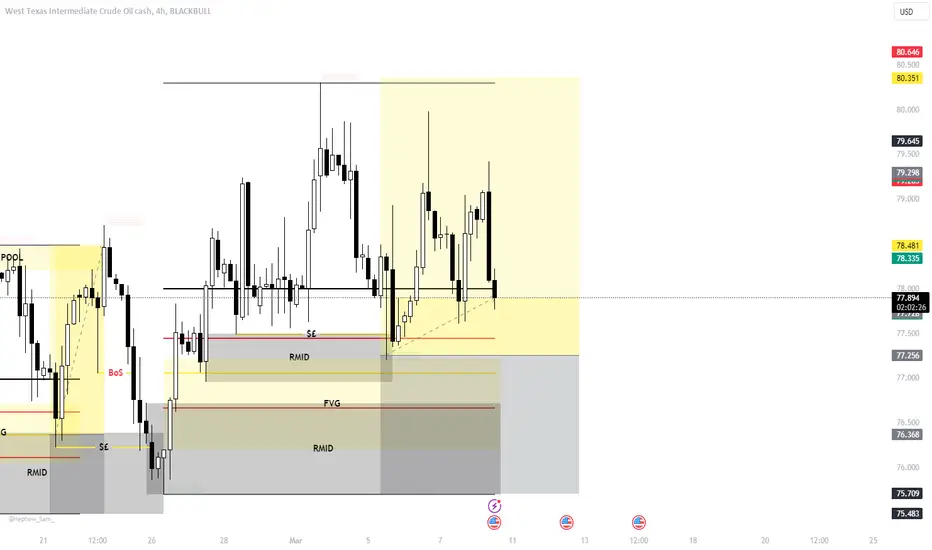
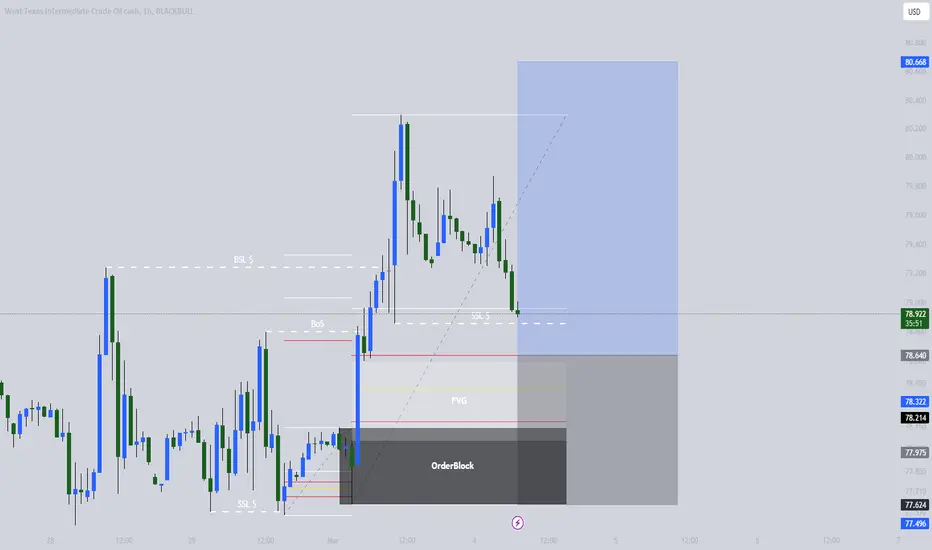
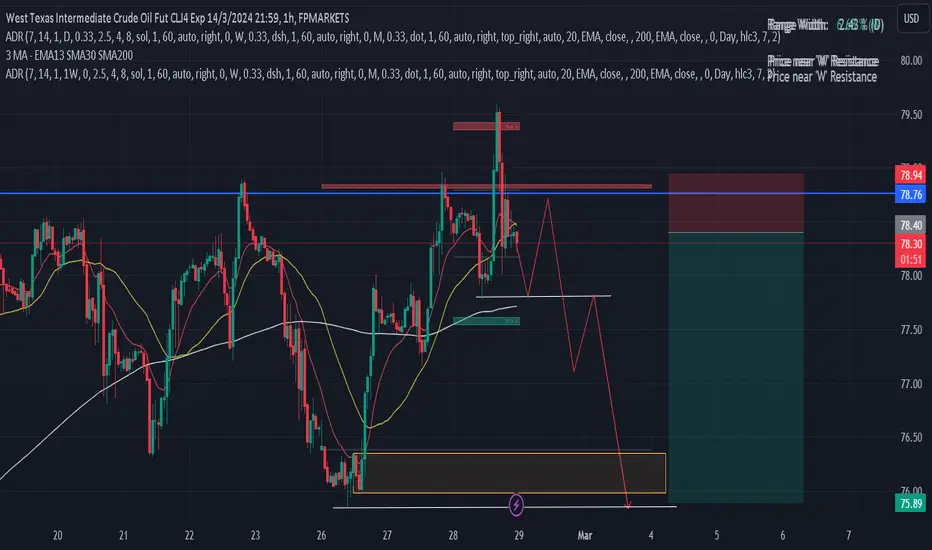
WTI H1 / Opportunity for a Short Trade 💲Hello Traders!
I see a good opportunity to execute a short trade on WTI H1. I expect the BOSS at the price of 77.80 to be taken, and in case of retracement, I will look for a short trade entry.
Traders, if my proposal resonates with you or if you hold a divergent viewpoint regarding this trade, feel free to share your thoughts in the comments. I welcome the opportunity to hear your perspectives.
____________________________________
Follow, like, and comment to see my content:
tradingview.sweetlogin.com
The Market Behaviour on different market sessionAsia market session makes compression price, and the next session when UK session is expecting to manipulate the market. The last session US session is expected market to do the distribution/direction. The price is on the strong supply area waiting for the price to break resistance before or do the rejection on the supply zone.

Crude Oil - Buy Zone!Hey there!
I'm selling on WTI: (Second trade)
-RMID (Range Manipulation Initiation Distribution)
-We have liquidity uptake.
-We have an interesting zone.
-We have the optimal Fibonacci.
-We have accumulation before/on the zone.
-We are with the trend.
🚀 If you liked it and want more, don't hesitate to subscribe and boost the post!
Questions? Leave a comment!
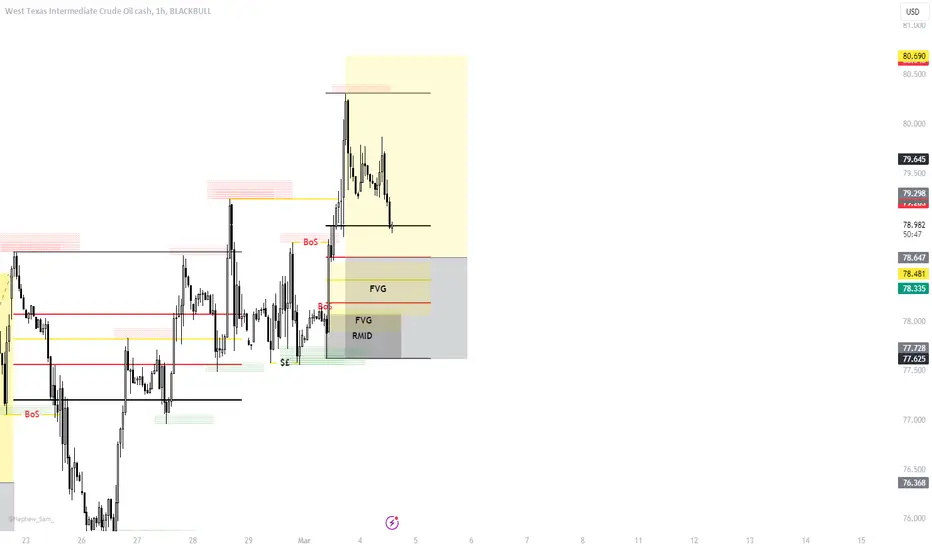
Crude Oil - Buy Zone!Hey there!
I'm selling on WTI:
-RMID (Range Manipulation Initiation Distribution)
-We have liquidity uptake.
-We have an interesting zone.
-We have the optimal Fibonacci.
-We have accumulation before/on the zone.
-We are with the trend.
🚀 If you liked it and want more, don't hesitate to subscribe and boost the post!
Questions? Leave a comment!

WTI crude looks set to bounceMomentum has clearly been in favour of bears over the past week for WTI traders, but given it has fallen over 10% from the January high it could be argued the move is oversold (at least over the near term).
A doji formed on Monday to show bears are losing their grip, and the fact it is forming a base above the 2023 open price and $72 handle adds to the case for a technical bounce. Moreover, bears entered around the January highs but volumes declined as prices fell to suggest the move is running out of steam, and RSI (2) was oversold on Friday.
The bias is for a bounce towards the weekly and monthly pivot points around 74.50 - 74.80 whilst prices remain above Monday's low.
