WTI(20250729)Today's AnalysisMarket news:
After gold prices soared to an all-time high of more than $3,500 an ounce in April, the latest report from the Commodity Futures Trading Commission (CFTC) showed that fund managers have increased their bullish bets to the highest level in 16 weeks.
Technical analysis:
Today's buy and sell boundaries:
66.09
Support and resistance levels:
68.13
67.37
66.87
65.30
64.80
64.04
Trading strategy:
If the price breaks through 66.87, consider buying, the first target price is 67.37
If the price breaks through 66.09, consider selling, the first target price is 65.30
Wticrude

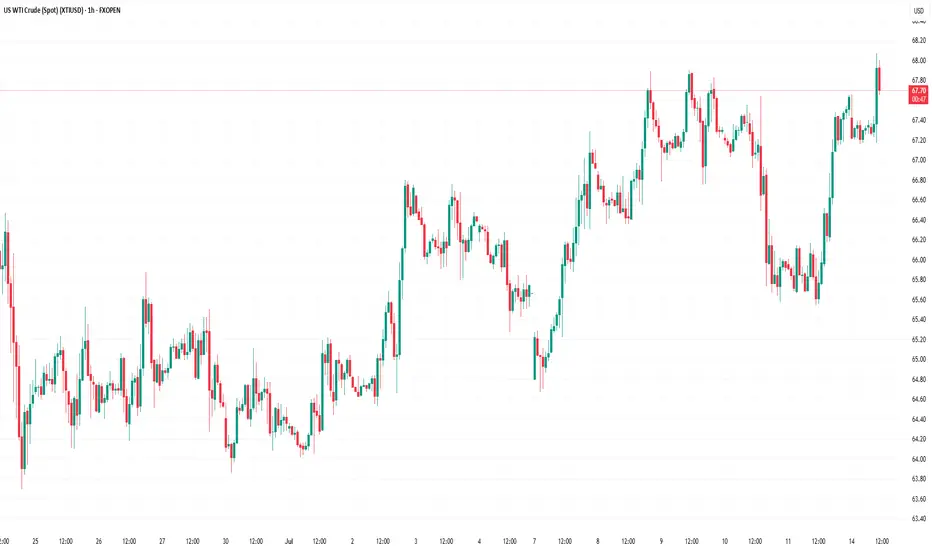
Market Analysis: Oil Prices Ease – Market Awaits Fresh CatalystMarket Analysis: Oil Prices Ease – Market Awaits Fresh Catalyst
WTI crude oil is also down and remains at risk of more losses below $64.60.
Important Takeaways for WTI Crude Oil Price Analysis Today
- WTI crude oil price continued to decline below the $66.00 support zone.
- It traded below a connecting bullish trend line with support at $65.60 on the hourly chart of XTI/USD at FXOpen.
WTI Crude Oil Price Technical Analysis
On the hourly chart of WTI crude oil at FXOpen, the price struggled to continue higher above $67.50. The price formed a short-term top and started a fresh decline below $66.00.
There was a steady decline below the $65.80 pivot level. The bears even pushed the price below $65.00 and the 50-hour simple moving average. The price traded below a connecting bullish trend line with support at $65.60.
Finally, the price tested the $64.75 zone. The recent swing low was formed near $64.73, and the price is now consolidating losses. On the upside, immediate resistance is near the $65.60 zone. It is close to the 50% Fib retracement level of the downward move from the $66.42 swing high to the $64.73 low.
The main resistance is $65.80. A clear move above it could send the price towards $66.40. The next key resistance is near $67.50. If the price climbs further higher, it could face resistance near $70.00. Any more gains might send the price towards the $72.00 level.
Immediate support is near the $64.60 level. The next major support on the WTI crude oil chart is near $63.20. If there is a downside break, the price might decline towards $60.00. Any more losses may perhaps open the doors for a move toward the $55.00 support zone.
This article represents the opinion of the Companies operating under the FXOpen brand only. It is not to be construed as an offer, solicitation, or recommendation with respect to products and services provided by the Companies operating under the FXOpen brand, nor is it to be considered financial advice.
WTI(20250723)Today's AnalysisMarket news:
White House officials plan to visit the Federal Reserve headquarters on Thursday local time.
Technical analysis:
Today's buying and selling boundaries:
65.22
Support and resistance levels:
66.22
65.85
65.61
64.84
64.60
64.22
Trading strategy:
If the price breaks through 65.61, consider buying, the first target price is 65.85
If the price breaks through 65.22, consider selling, the first target price is 64.84
WTI(20250721)Today's AnalysisMarket news:
Waller refused to comment on whether he would dissent at the July meeting, saying that the private sector was not performing as well as people thought, and said that if the president asked him to be the chairman of the Federal Reserve, he would agree.
Technical analysis:
Today's buying and selling boundaries:
66.42
Support and resistance levels
68.00
67.41
67.02
65.81
65.43
64.84
Trading strategy:
If the price breaks through 66.42, consider buying, and the first target price is 67.02
If the price breaks through 65.81, consider selling, and the first target price is 65.43
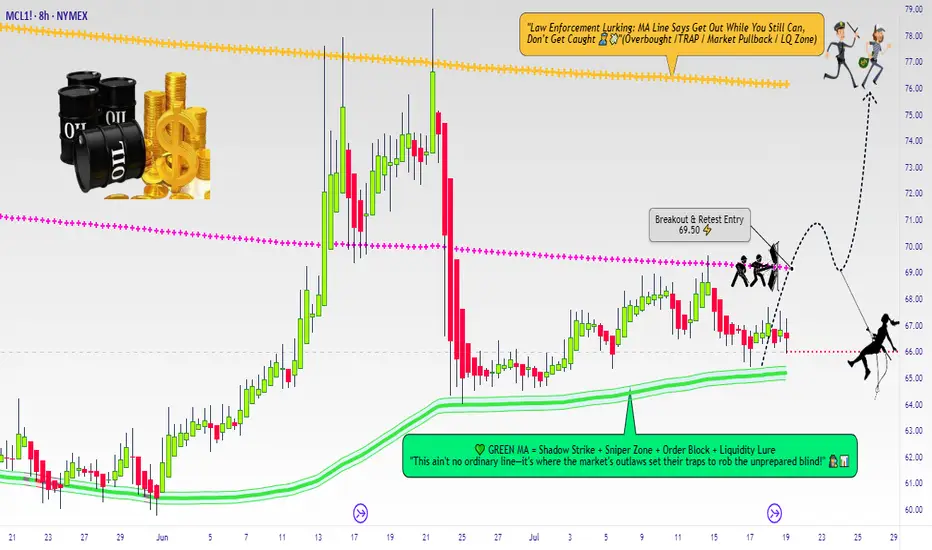
Micro WTI Swing Breakout Setup – Robbing Liquidity the Smart Way🛢️ "Crude Ops: The WTI Energy Vault Breakout Plan" 🛢️
(A Thief Trader Swing Setup | MA Breakout Trap Heist 💰💥)
🌍 Hola! Bonjour! Marhaba! Hallo! Hello Robbers & Market Movers! 🌟
Welcome to another high-voltage heist mission straight from the Thief Trading Den. This ain’t just a chart—this is an Energy Market Extraction Plan based on real smart money footprints 🔎.
🔥 Master Robbery Setup: MICRO WTI CRUDE OIL FUTURES 🎯
We got a bullish breakout alert from the shadows! This is not a drill.
💣 ENTRY STRATEGY
💼 "The Heist Begins Above 68.50"
Watch the Moving Average (MA) zone closely—this is where weak hands get trapped and we slide in with stealth limit or breakout orders:
🛠️ Plan of Entry:
Buy Stop Order: Just above 68.500 (after confirmation of breakout ✅).
Buy Limit Layering (DCA): On pullbacks around 15m/30m swing lows for precision entries.
🧠 Pro Tip: Use alerts to catch the exact entry ignition spark—don't chase, trap with patience like a true thief.
🛑 STOP LOSS (SL)
⚠️ "No SL? That’s a rookie mistake."
SL should only be placed post-breakout using the 8H wick-based swing low (around 66.50).
💡 SL is your personal vault door—set it according to:
Lot size
Risk appetite
Layered entry strategy
📌 Reminder: No SL or order placement before breakout. Let the market show its hand first.
🎯 TARGET ZONE (Take Profit)
Primary Target: 76.00 🏁
But hey... the smartest robbers escape before alarms ring — so trail that stop, secure your profits, and vanish like smoke 🥷.
💥 FUNDAMENTAL & SENTIMENT CATALYSTS
🔥 Current bullish energy comes from:
📉 USD weakness
🏭 Crude inventory drawdowns
⚖️ Geopolitical supply shocks
🐂 Hedge funds scaling long per latest COT data
📊 Intermarket cues from risk-on assets
🧠 Do your diligence: Go check fundamentals, COTs, and macro narratives before entering. Info = Edge.
📢 RISK MANAGEMENT NOTE
🚨 Don't go wild. Market is volatile, especially around:
News drops 📉
Fed or OPEC speeches 🎙️
Crude inventory reports 🛢️
Pause entries during news events. Use trailing SLs to lock the vault behind you.
❤️ SUPPORT THE ROBBERY MISSION
💣 Smash that BOOST button if this plan hits your nerve.
Let’s keep robbing liquidity zones together and growing the Thief Trader Brotherhood 🕵️♂️💰.
📡 Stay tuned for the next stealth heist drop. We rob the market with class. 💎🚀
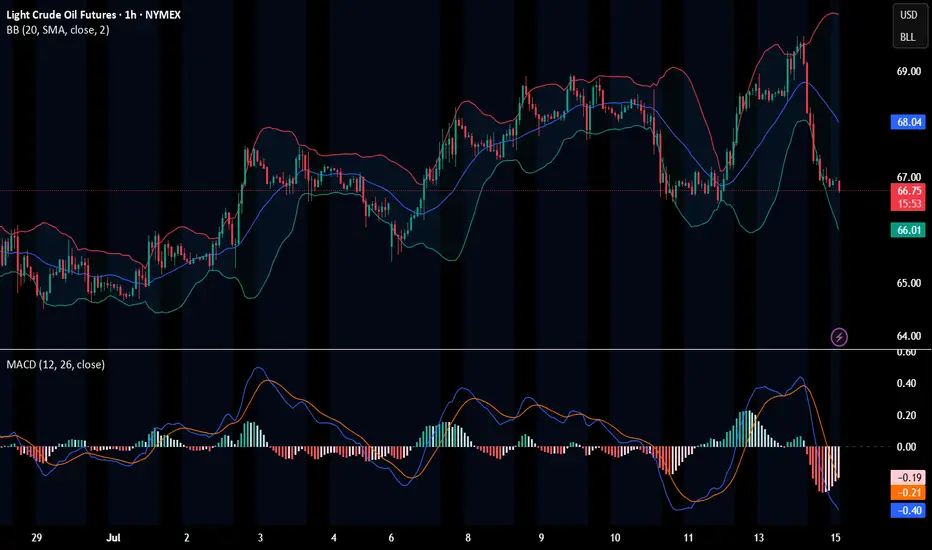
Crude oil rises slowly but falls quickly?
💡Message Strategy
International oil prices continued to climb on Monday, but the gains were limited. Brent crude futures rose 8 cents to $70.44 a barrel, continuing Friday's 2.51% rise. U.S. WTI crude rose 5 cents to $68.50, having surged 2.82% the previous trading day.
The main driving force behind this round of gains came from the market's expectation that the United States would further increase sanctions on Russia. U.S. President Trump said on Sunday that he would provide Ukraine with the Patriot air defense missile system and would make a "major statement" on the Russian issue on Monday.
The contradiction between supply and demand is also intensifying. According to market surveys, Brent crude oil rose by 3% last week and WTI rose by 2.2%. The International Energy Agency (IEA) pointed out that although the market supply and demand appear to be balanced on the surface, the actual global oil supply may be tighter than expected due to the summer refining peak and rising electricity demand.
📊Technical aspects
WTI crude oil continued its rebound from last week's low on the daily chart, and the current price is running at the downward support of $66.70, indicating that the short-term bullish power has increased. The MACD indicator shows a golden cross and initial volume, and the momentum column begins to turn positive, indicating that the price is expected to challenge the previous high area (69.50-70.20 US dollars).
The short-term (1H) trend of crude oil is highly repetitive, and the oil price is supported at the lower edge of the wide range and rises again. The short-term objective trend direction is upward within the range. The bullish momentum is sufficient.
💰Strategy Package
Long Position:65.50-66.50,SL:64.00,Target:69.00-70.00

WTI(20250715)Today's AnalysisMarket news:
Sources said that after Trump's latest trade tax threat, the European Central Bank will discuss a more negative scenario next week than expected in June. The ECB is still expected to keep interest rates unchanged at its meeting on July 24. Discussions on rate cuts are still postponed to September.
Technical analysis:
Today's buying and selling boundaries:
66.63
Support and resistance levels:
69.20
68.24
67.62
65.65
65.02
64.06
Trading strategy:
If it breaks through 66.63, consider buying in, the first target price is 67.62
If it breaks through 65.65, consider selling in, the first target price is 65.02
WTI Crude Oil Climbs Higher Amid Market OptimismMarket Analysis: WTI Crude Oil Climbs Higher Amid Market Optimism
WTI Crude Oil price climbed higher above $66.50 and might extend gains.
Important Takeaways for WTI Crude Oil Price Analysis Today
- WTI Crude Oil price started a decent increase above the $66.60 resistance levels.
- There was a break above a connecting bearish trend line with resistance at $67.15 on the hourly chart of XTI/USD at FXOpen.
Oil Price Technical Analysis
On the hourly chart of WTI Crude Oil at FXOpen, the price started a decent upward move from $65.50. The price gained bullish momentum after it broke the $66.50 resistance and the 50-hour simple moving average.
The bulls pushed the price above the $67.00 and $67.50 resistance levels. There was a break above a connecting bearish trend line with resistance at $67.15.
The recent high was formed at $67.63 and the price started a downside correction. There was a minor move toward the 23.6% Fib retracement level of the upward move from the $65.54 swing low to the $67.63 high.
The RSI is now above the 60 level. Immediate support on the downside is near the $67.15 zone. The next major support on the WTI Crude Oil chart is near the $66.60 zone or the 50% Fib retracement level, below which the price could test the $65.50 level. If there is a downside break, the price might decline toward $64.70. Any more losses may perhaps open the doors for a move toward the $63.50 support zone.
If the price climbs higher again, it could face resistance near $67.85. The next major resistance is near the $70.00 level. Any more gains might send the price toward the $72.50 level.
This article represents the opinion of the Companies operating under the FXOpen brand only. It is not to be construed as an offer, solicitation, or recommendation with respect to products and services provided by the Companies operating under the FXOpen brand, nor is it to be considered financial advice.
Crude oil shock trend direction
💡Message Strategy
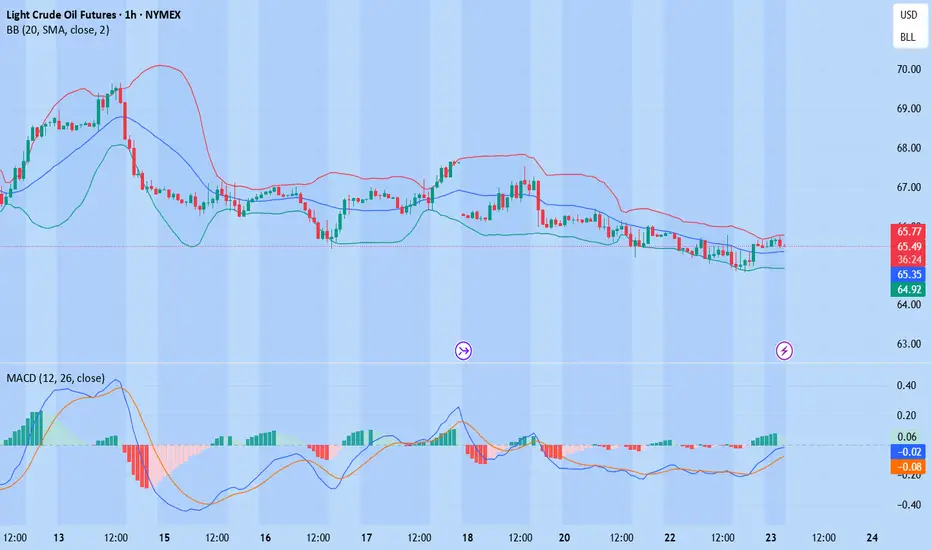
During the European trading session on Monday, the West Texas Intermediate (WTI) crude oil futures on the New York Mercantile Exchange recovered the previous losses and rebounded to around $67.50 per barrel. Although OPEC+ confirmed that the increase in oil production in August will be higher than expected, oil prices still rebounded.
From the daily chart level, the medium-term trend of crude oil fluctuated upward and tested around 78. The K-line closed with a large real negative line, which has not yet destroyed the moving average system and is still supported. The medium-term objective upward trend remains unchanged. However, from the perspective of momentum, the MACD indicator crosses downward above the zero axis, indicating that the bullish momentum is weakening. It is expected that the medium-term trend of crude oil will fall into a high-level oscillating upward pattern.
📊Technical aspects
The short-term (1H) trend of crude oil failed to continue to hit a new low and showed a rebound rhythm. The oil price crossed the moving average system, and the short-term objective trend entered a transition period. From the perspective of momentum, the MACD indicator crossed the zero axis, and the red column indicated that the bullish momentum was sufficient. At present, the price is running in a wide range, with a range of 65.50-67.80. It is expected that the trend of crude oil will repeatedly test the upper edge of the range within the range.
💰Strategy Package
Long Position:67.00-67.50,SL:65.50,Target:70.00
Crude oil continues to fluctuate upward
💡Message Strategy
OPEC+, led by Asian countries, announced on Saturday that it would increase production by an additional 548,000 barrels per day from next month, more than 30% higher than market expectations of 411,000 barrels per day, accelerating the pace of resumption of production after the production cuts in 2023.
In addition to supply-side factors, demand prospects are also affected by trade concerns. U.S. Commerce Secretary Howard Lutnick said that the country-specific tariffs that the Trump administration intends to implement will officially take effect on August 1, later than the previously scheduled July 9, leaving trading partners with a short breathing space.
Market concerns about the impact of this policy on crude oil consumption have intensified, especially among importing countries, mainly Asian countries.
Confidence in the Asian market remains, and Saudi Arabia raises prices to Asia
Despite the increase in supply, OPEC+ still emphasized in its statement that "the global economic outlook is stable and the market fundamentals are healthy." As a signal of confidence, Saudi Arabia has raised the prices of major crude oil varieties for Asian customers, indicating that it believes that the Asian market has the ability to absorb additional supply.
According to OPEC+ representatives, the alliance will consider whether to increase supply by another 548,000 barrels per day in September at its next meeting on August 3, thereby fully restoring the 2.2 million barrels per day quota cut last year.
📊Technical aspects
From the daily chart level, crude oil fluctuates upward and tests around 75 in the medium term. The K-line closes with a large real negative line, which has not yet destroyed the moving average system and is still supported. The medium-term objective trend remains upward. However, from the perspective of momentum, the MACD indicator crosses downward above the zero axis, indicating that the bullish momentum is weakened. It is expected that the medium-term trend of crude oil will fall into a high-level oscillation pattern.
After the short-term (4H) trend of crude oil fluctuates and consolidates, it turns into an upward rhythm. The moving average system is arranged in short positions, and the short-term objective trend is upward. The MACD indicator fast and slow lines cross the zero axis, and the bullish momentum is full. It is expected that the crude oil trend will continue to rise after a slight rebound during the day.
💰Strategy Package
Long Position:66.00-67.00,SL:65.00,Target:69.00-70.00
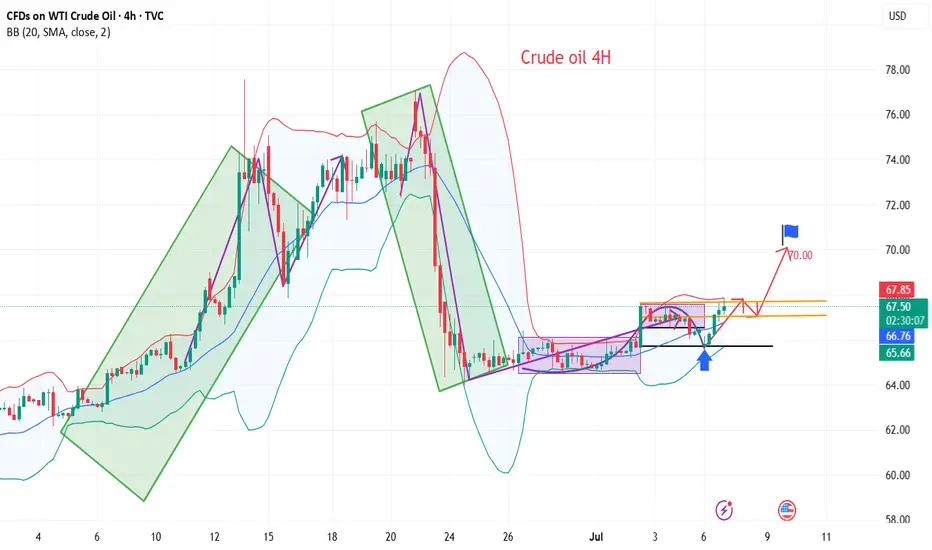
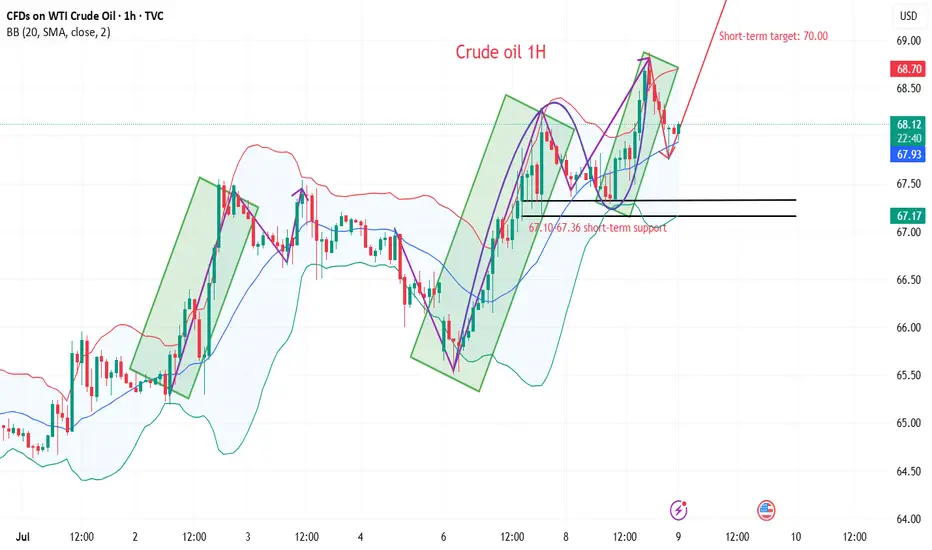
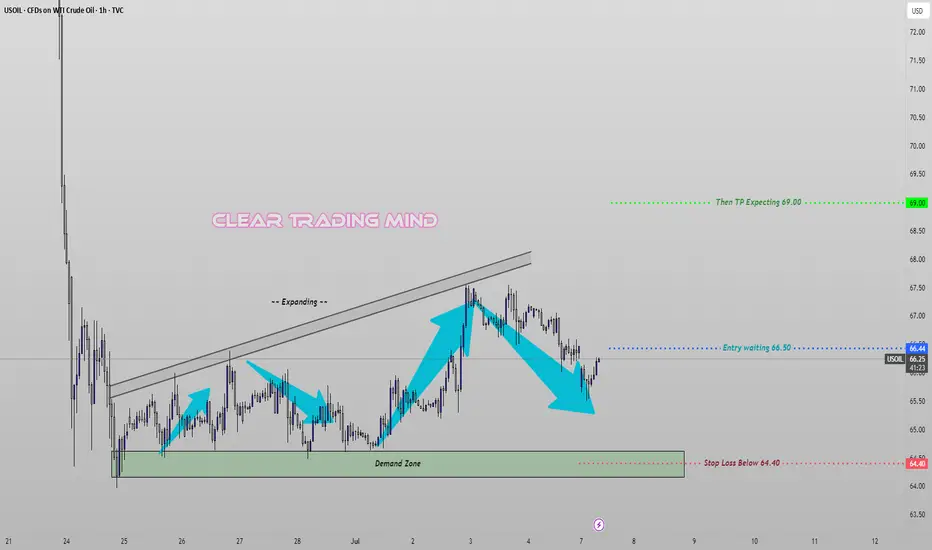
Crude Oil Eyes Bullish Breakout – Demand Zone Holding StrongCrude Oil (USOIL) is forming a potential bullish reversal structure on the 1H timeframe, supported by repeated bounces from a well-respected demand zone. Price currently consolidates below the key resistance level with a visible expanding channel, hinting at possible volatility and breakout.
🔹 Trade Idea:
I’m waiting for a clear break and close above 66.50 for a valid long entry. The setup remains invalid unless price confirms this breakout.
🔹 Technical Highlights:
- Strong demand zone held price multiple times
- Formation of higher impulses with retracements aligning well with Fibonacci levels
- Market structure suggests a continuation toward upper targets if 66.50 is broken with momentum
🔹 Trade Plan:
- Buy Above: 66.50 (breakout confirmation)
- Stop Loss: 64.40 (below demand zone and structure support)
- Target: 69.00 (near 2.272 Fibonacci extension)
⚠️ Note: No entry unless 66.50 is broken convincingly. Setup favors disciplined execution only on confirmation.
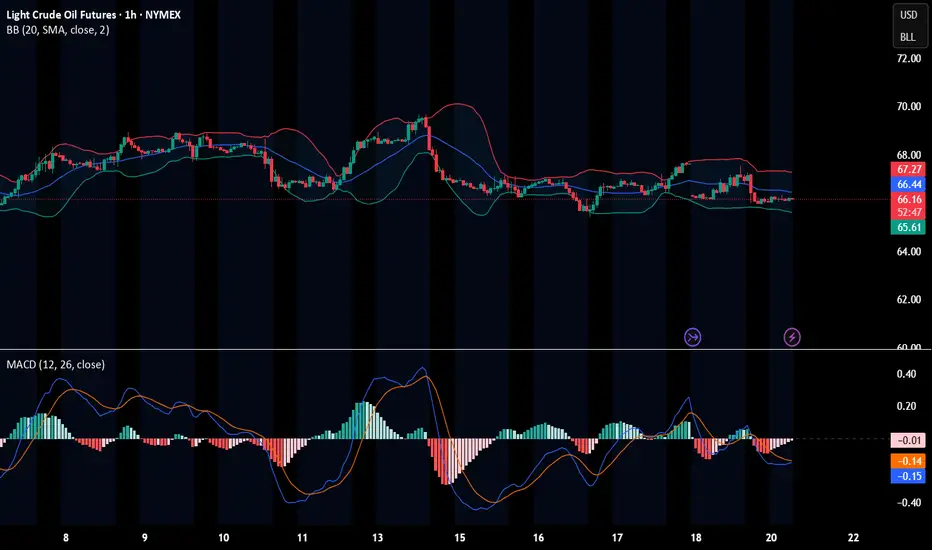
Crude oil moves up alternately during the day
💡Message Strategy
WTI crude oil prices snapped a three-day winning streak and were trading around $66.00 a barrel in early European trading Thursday. Crude oil prices fell as rising U.S. crude inventories heightened concerns about weak demand in the United States, the world's largest oil consumer.
📊Technical aspects
From the daily chart level, crude oil fluctuates upward in the medium term and tests around 78. The K-line closes with a large real negative line, which has not yet destroyed the moving average system and is still supported. The medium-term objective upward trend remains unchanged.
However, from the perspective of momentum, the MACD indicator crosses downward above the zero axis, indicating that the bullish momentum is weakening. It is expected that the medium-term trend of crude oil will fall into a high-level oscillation pattern.
The short-term trend of crude oil (4H) fluctuated and consolidated for two trading days. The oil price repeatedly crossed the moving average system, and the objective trend direction fluctuated. From the perspective of the primary and secondary rhythms, the current rhythm is a secondary oscillation rhythm. According to the law of primary and secondary alternation, the subjective trend still maintains an upward direction. In terms of momentum, there are signs of weakening upward momentum, and it is expected that the crude oil trend will continue to be mainly upward.
💰Strategy Package
Long Position:65.50-66.00,SL:64.50,Target:69.00-70.00
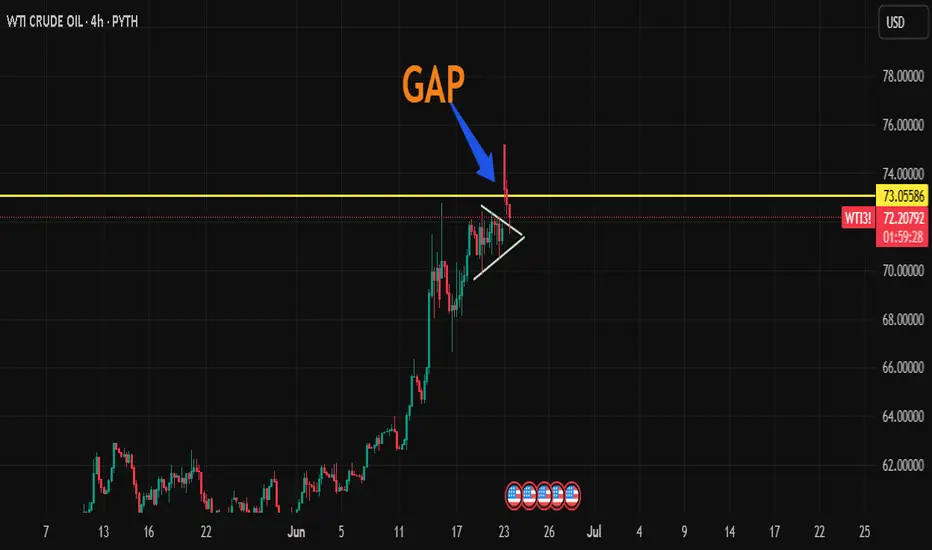
WTI on high time frame
"Hello traders, focusing on WTI crude oil, the price surged to $78 but sharply retreated to the $65 zone. Over the last five days, the price has consolidated. I believe that the signals from the recent 4-hour candle suggest a potential move towards higher prices, with the next target possibly being around $72. I will be monitoring the price action around $72 closely for a potential rejection or continuation towards even higher prices."
If you need further assistance or have additional insights to share, feel free to let me know.
#USOIIL #WTI 1H📈 #USOIL 1H Buy Setup – Liquidity Sweep in Play
Crude Oil is consolidating after a sharp decline, forming a potential setup for a liquidity sweep below the current range, followed by a bullish reversal. We're anticipating a fakeout move to grab sell-side liquidity before price targets the Fair Value Gap (FVG) and premium supply zone above.
🟩 Buy Limit: 64.50 / 64.00
🎯 Targets: 70.00 → 72.00+
❌ Stop Loss: 63.00
This setup offers high risk-to-reward potential if the liquidity sweep plays out as expected. Monitor price action closely at the buy zone.
#CrudeOil #WTI #SmartMoney #TradingStrategy

Crude oil continues to correct, short-term ideas
💡Message Strategy
WTI crude oil prices recovered from a two-week low but remained about $12 below the previous Monday's high as upside was limited by Middle East peace and expectations that OPEC+ countries will agree to increase supply again this week.
📊Technical aspects
From the daily chart level, crude oil fluctuates upward in the medium term and tests around 75. The K-line closes with a large real negative line, which has not yet destroyed the moving average system and is still supported. The medium-term objective upward trend remains unchanged.
However, from the perspective of momentum, the MACD indicator crosses downward above the zero axis, indicating that the bullish momentum is weakening. It is expected that the medium-term trend of crude oil will fall into a high-level oscillation pattern.
The short-term trend of crude oil (1H) continues to fluctuate in a narrow range, and the oil price falls back to the lower edge of the range. Pay attention to the support strength of 64. In terms of momentum, the MACD indicator is at the zero axis position, and the long and short forces are equal. It is expected that the trend of crude oil will maintain a fluctuating consolidation pattern during the day.
💰Strategy Package
Short Position:65.50-66.50,SL:67.50,Target: 64.00-63.00
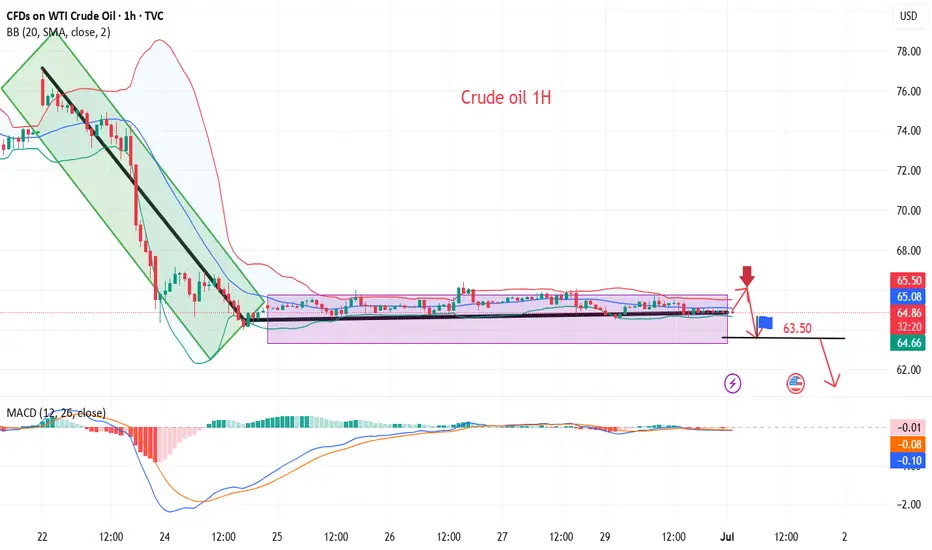
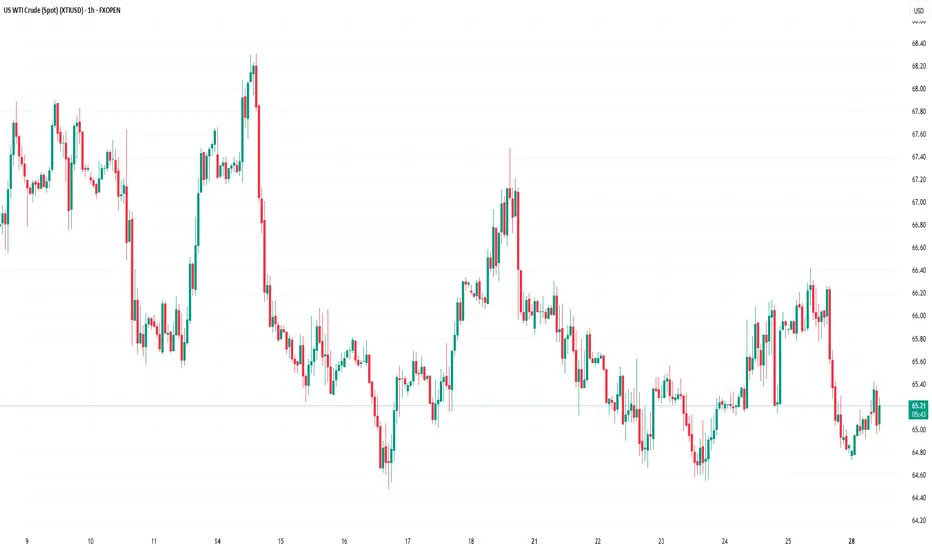
Market Analysis: Oil Slides — Traders Eye Macro TriggersMarket Analysis: Oil Slides — Traders Eye Macro Triggers
WTI Crude oil is down over 15% and remains at risk of more losses.
Important Takeaways for WTI Crude Oil Price Analysis Today
- WTI Crude oil extended losses below the $68.00 support zone.
- A major bearish trend line is forming with resistance near $65.60 on the hourly chart of XTI/USD at FXOpen.
Technical Analysis of WTI Crude Oil Price
On the hourly chart of WTI Crude Oil at FXOpen, the price struggled to continue higher above $77.00 against the US Dollar. The price formed a short-term top and started a fresh decline below $72.00.
There was a steady decline below the $70.00 pivot level. The bears even pushed the price below $68.00 and the 50-hour simple moving average. Finally, the price tested the $63.70 zone. The recent swing low was formed near $63.69, and the price is now consolidating losses.
On the upside, immediate resistance is near the $65.60 zone. There is also a major bearish trend line forming with resistance near $65.60. The next resistance is near the $66.80 level or the 23.6% Fib retracement level of the downward move from the $76.93 swing high to the $63.69 low.
The main resistance is $70.30 and the 50% Fib retracement level. A clear move above the $70.30 zone could send the price toward $71.90.
The next key resistance is near $76.90. If the price climbs further higher, it could face resistance near $78.00. Any more gains might send the price toward the $80.00 level.
Immediate support is near the $63.70 level. The next major support on the WTI Crude Oil chart is near $62.00. If there is a downside break, the price might decline toward $60.00. Any more losses may perhaps open the doors for a move toward the $55.00 support zone.
This article represents the opinion of the Companies operating under the FXOpen brand only. It is not to be construed as an offer, solicitation, or recommendation with respect to products and services provided by the Companies operating under the FXOpen brand, nor is it to be considered financial advice.
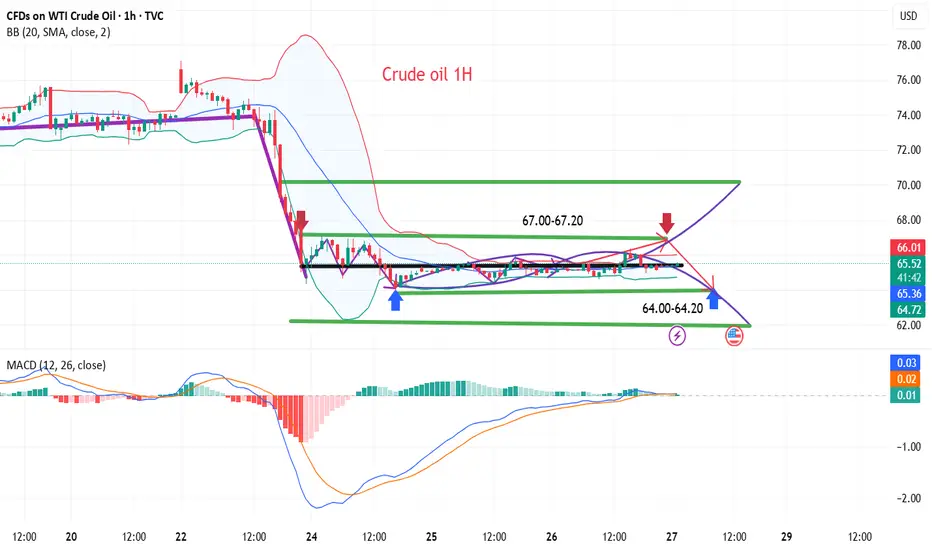
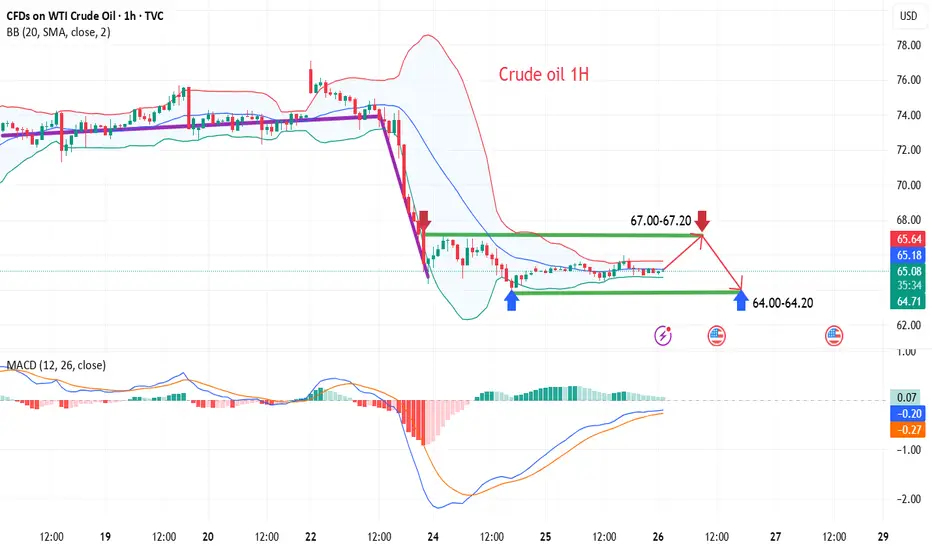
The idea of oscillating crude oil
💡Message Strategy
Asia's crude oil imports hit a record high in recent years
In the first half of 2025, Asia's crude oil imports showed a significant increase. The average daily import volume in Asia reached 27.36 million barrels, an increase of 620,000 barrels from 26.74 million barrels in the same period last year, an increase of about 2.3%. The highlight of this growth was concentrated in June, when Asia's crude oil arrivals soared to 28.65 million barrels/day, setting a record high since January 2023, far exceeding 27.3 million barrels/day in May and 26.42 million barrels/day in June last year.
Import boom driven by price
What drove the surge in Asian crude oil imports in June? The answer has a lot to do with price. China and India are known to be extremely sensitive to crude oil price fluctuations, usually increasing imports when prices are low and choosing to shrink when prices are high. Crude oil arriving in June is usually scheduled six to eight weeks in advance of delivery, which means that these cargoes were purchased when oil prices were low in April and May.
Geopolitics and market uncertainty
The sharp fluctuations in oil prices in June are inseparable from the fueling of geopolitics. Israel's military action against Iran and the subsequent intervention of the United States once pushed crude oil prices to a five-month high. After Trump announced the ceasefire agreement, the market risk premium quickly subsided, but geopolitical uncertainty is still an important variable affecting oil prices. In the future, any new geopolitical events may push up oil prices again, which will further pressure Asia's import demand.
📊Technical aspects
The short-term trend of crude oil (1H) continues to fluctuate in a narrow range, with a small fluctuation. The oil price repeatedly crosses the moving average system, and the short-term objective trend direction fluctuates. The momentum is stalemate between long and short positions, and it is expected that the trend of crude oil will maintain a fluctuating consolidation pattern during the day.
However, crude oil is never that simple. It is greatly affected by international trends. At present, crude oil is still waiting for direction. So how can we obtain greater future returns in a volatile market?
The answer is simple. At this time, what we need to do is to use a small stop loss to leverage large returns within the pressure and support range.
💰Strategy Package
Short Position:67.00-67.20,SL:67.80,Target: 64.50-63.50/60.00
Long Position:64.00-64.20,SL:63.50,Target: 65.50-66.50/70.00
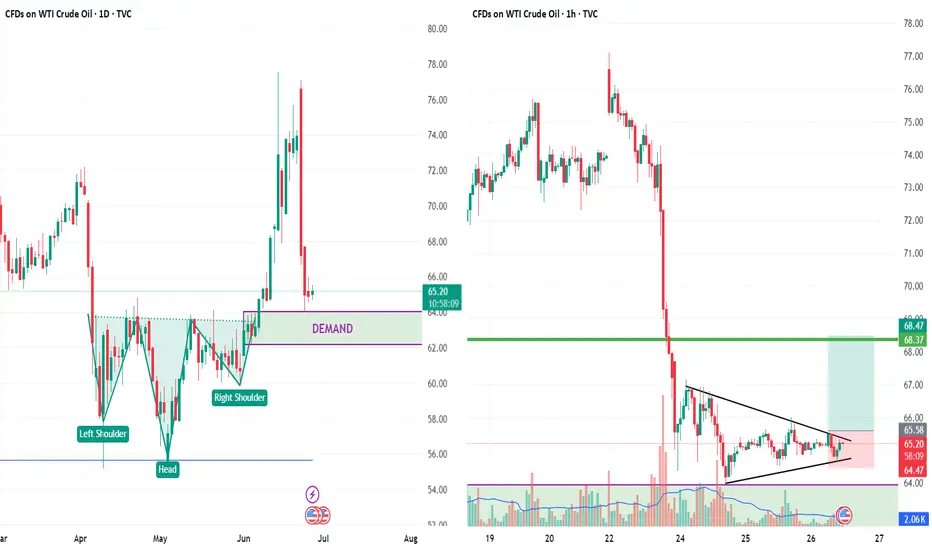
falling wedge formation on 1 Hr chartCrude oil is forming a falling wedge pattern on 1 hr time frame after retesting daily head and shoulder pattern and demand zone.
Breakout level 65.6
stoploss 64.4
target 68.3
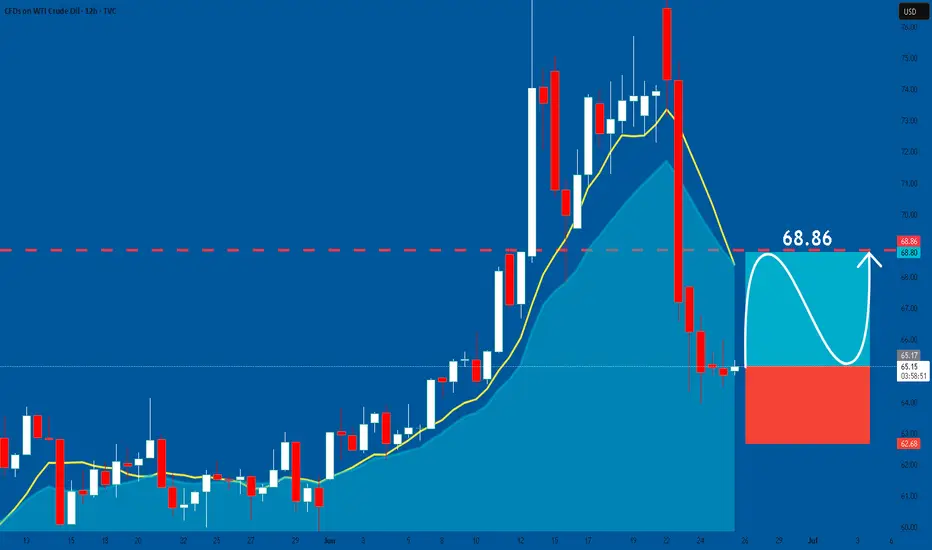
USOIL: Bullish Correction Ahead! Buy!
USOIL
- Classic bullish correction formation
- Our team expects growth
SUGGESTED TRADE:
Swing Trade
Buy USOIL
Entry Level - 65.16
Sl - 62.68
Tp - 68.86
Our Risk - 1%
Start protection of your profits from lower levels
Disclosure: I am part of Trade Nation's Influencer program and receive a monthly fee for using their TradingView charts in my analysis.
❤️ Please, support our work with like & comment! ❤️
Crude oil fluctuates in a narrow range, waiting for direction
💡Message Strategy
Middle East ceasefire eases supply concerns, but risk premium remains
Oil prices rose more than 1% on the day as investors weighed the status of the ceasefire between Iran and Israel. Although both sides have announced an end to hostilities, US intelligence reports show that Iran's nuclear capabilities have only been temporarily damaged. ING analysts pointed out that although immediate concerns about supply disruptions have subsided, potential risks remain, a factor that may support spot prices in the short term.
Previously, crude oil prices soared after the US military action on Iranian infrastructure, but prices have retreated as the ceasefire continues. Although the geopolitical premium has been reduced, it has not been fully digested.
API shows a sharp drop in inventories, traders await EIA report
Industry data from the American Petroleum Institute (API) showed that US crude oil inventories fell sharply by 4.23 million barrels in the week ending June 20, far higher than the expected drop of 800,000 barrels. Gasoline and distillate inventories increased by 400,000 barrels each.
Market focus now turns to the US Energy Information Administration (EIA) report scheduled for release on Wednesday. Traders were expecting a 1.2 million-barrel draw in inventories, and confirmation of that figure by the EIA, widely viewed as an industry benchmark, would reinforce expectations of tighter supply.
📊Technical aspects
From the daily chart level, crude oil fluctuates upward in the medium term and tests around 67. The K-line closes with a large real negative line, which has not yet destroyed the moving average system and is still supported. The medium-term objective upward trend remains unchanged.
However, from the perspective of momentum, the MACD indicator crosses downward above the zero axis, indicating that the bullish momentum is weakening. It is expected that the medium-term trend of crude oil will fall into a high-level oscillation pattern.
The short-term trend of crude oil (1H) is in a narrow range of consolidation, with a small fluctuation. The oil price repeatedly crosses the moving average system, and the short-term objective trend direction fluctuates. In terms of momentum, the MACD indicator fast and slow lines slowly rise below the zero axis, and the long and short positions are in a stalemate, with no obvious advantage on one side. It is expected that the trend of crude oil will maintain a consolidation pattern during the day.
💰Strategy Package
Short Position:67.00-67.20,SL:67.80,Target: 65.50-64.50
Long Position:64.00-64.20,SL:63.50,Target: 65.50-66.50
Tariff Panic = Opportunity | WTI Long SetupWTI Oil has finally dipped into my long-watched buy zone, driven by macro fear and an aggressive tariff agenda. The current drop aligned perfectly with my long-term execution plan. I’ve placed this trade based on key historical demand levels with my stop-loss and take-profit clearly defined. I’m prepared for deeper drawdown, but this area remains high-conviction for me. Execution > Prediction.
Technicals:
• Key Level: Price tapped into a major demand zone dating back to 2021 lows, which had been protected ever since.
• Liquidity Sweep: This drop mitigated every low formed post-2021 — clearing out late longs and stop hunts.
• Trendline Break Anticipation: I expect a potential trendline breakout from the long-term descending structure.
• SL/TP Defined: This trade has structure. It’s not a hope-based setup, it’s pre-planned and managed.
• Consolidation + Accumulation: This is where strong hands prepare, and I’m joining in.
Fundamentals:
• Tight supply, rising global demand, and structural underinvestment in oil exploration.
• Chinese reopening + Russian ban tighten market availability.
• Central banks expected to support demand via easing cycles.
• Oil Bearish Catalyst (Short-Term):
• US tariff wave: Trump announced a total 54% tariff on China and baseline tariffs on all trading partners.
• Escalating fears of global economic slowdown pushed prices to $58.80, a 4-year low.
The bearish panic gave bulls like us a gift. This is how real trades are born - not in euphoria, but in blood.
Note: Please remember to adjust this trade idea according to your individual trading conditions, including position size, broker-specific price variations, and any relevant external factors. Every trader’s situation is unique, so it’s crucial to tailor your approach to your own risk tolerance and market environment.
Crude oil is displaying serious weaknessCrude oil is trapped in a descending triangle after a blow off top. might take some time to play out but target for crude oil based on the triangle is 42-40 crude oil.
WTI(oil)For oil, what I have in mind, considering the conditions we are in, if the Strait of Hormuz is not closed, we will remain at the same prices, that is, $75 to $80. But if the Strait is closed 100%, the price will go up to $130 and $150 in the short term.