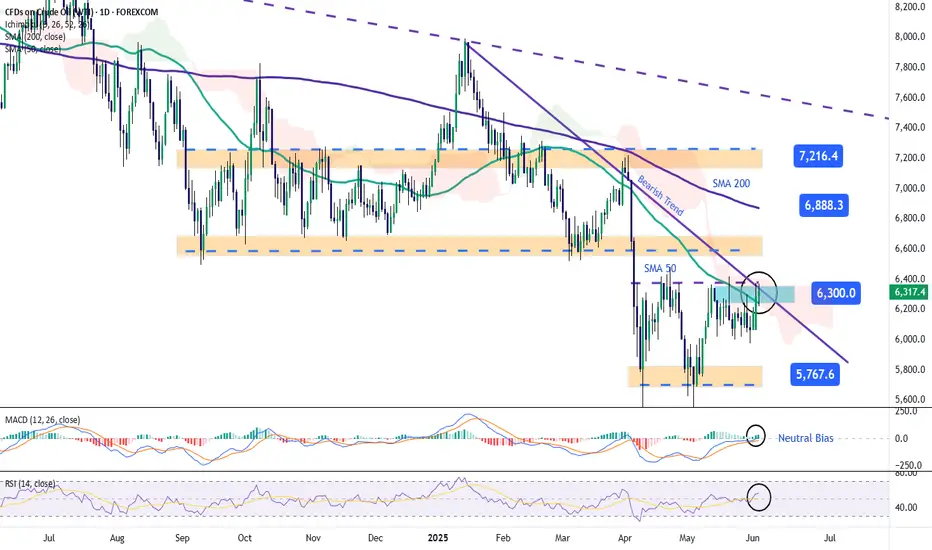
WTI Crude Returns to $63Over the past two trading sessions, WTI crude oil has gained more than 5%, as confidence has temporarily returned to the market following the latest OPEC+ announcements. The organization recently announced a new production increase of 411,000 barrels per day starting in July, but the volume was lower than anticipated, which has been interpreted as a positive signal for short-term price behavior. This has helped sustain a consistent bullish bias in recent sessions.
Bearish Trend Remains Intact
Since early January, crude oil has followed a steady bearish trend. Currently, the price is approaching the resistance marked by the trendline, and if buying pressure holds in the short term, the bearish formation could come under threat in the upcoming trading sessions.
MACD
At the moment, the MACD histogram shows slight oscillations above the neutral line (0), but it has not yet indicated a decisive market impulse. As a result, a strong sense of short-term neutrality persists, as the price approaches key resistance levels.
RSI
The Relative Strength Index (RSI) is showing a similar pattern: the line is starting to rise, but it is flattening out, which could be weakening the current buying momentum and signaling a possible sideways movement in the short term.
Key Levels to Watch:
$63 – Current Barrier: Aligns with the bearish trendline and could be where price indecision intensifies, leading to continued consolidation.
$57 – Major Support: A recent low. If the price returns to this level, it could reactivate the bearish trend and lead to a deeper sell-off.
$68 – Key Resistance: Located around the 200-period moving average. A breakout above this level could mark the beginning of a new long-term bullish trend.
Written by Julian Pineda, CFA – Market Analyst
Wticrude
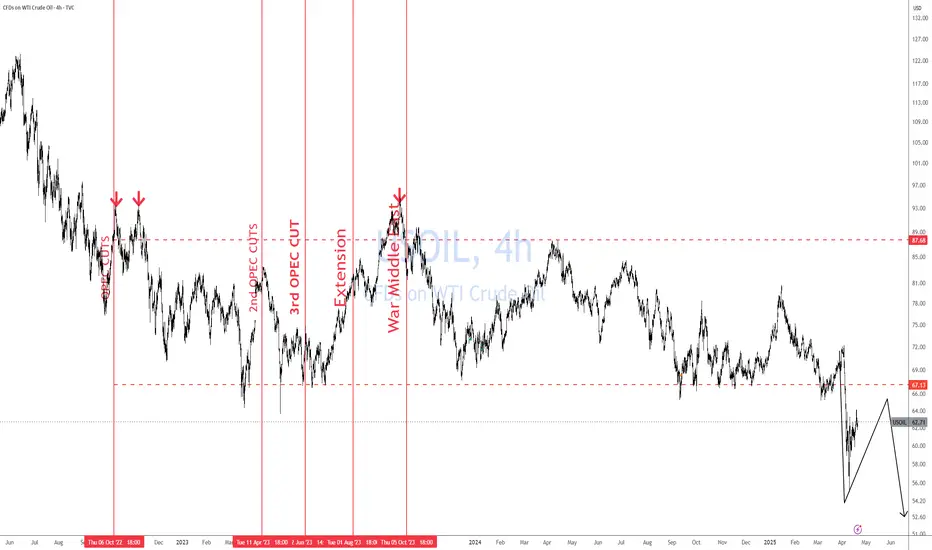
USOIL LETS MAKE OIL GREAT AGAIN TO 80$HELLO TRADERS
As i can see USOIL it formaing H & S pattrent and now trading above a strong Weekly horizontal Support zone if prices hold above 65$ then given Tp can be easy target if we see a higher demand and tight supply with the War going on around the world its a huge possibilty that pricce can shoot up we have to monitor the 65$ price zone which is importat to hold bull cycle on smaller TF 4HR it is creating Wickoff pattren too and we can see Fibo levels golden ratio can hit our targers or risk reward is great for us becaus we was buying the dip in May it is just starting chart is crystal clear its just a trade idea share your thoughts we appriciate ur comments and support Stay tuned for more updates

The first crude oil target was reached perfectly
💡Message Strategy
Last Friday (May 31), oil prices fell slightly as traders generally expected OPEC+ to "play a big trick" - increasing production in July to more than 500,000 barrels per day.
Potential risks: The supply and demand game is not over
OPEC+'s production increase plan still faces implementation difficulties. Countries such as Kazakhstan have previously refused to cut production, and the actual production capacity of some member countries (such as Nigeria and Angola) is close to the upper limit. If global demand declines due to expectations of economic recession, OPEC+'s "moderate production increase" may evolve into "passive inventory accumulation", thereby suppressing medium- and long-term oil prices.
Short-term supply concerns: Russia is the world's second largest crude oil exporter. If its military facilities are frequently attacked, it may affect the stability of its energy infrastructure.
"Extreme pressure" before negotiations: The attack occurred on the eve of the ceasefire negotiations between Russia and Ukraine. Ukraine tried to increase its bargaining chips through military actions. If the negotiations fail, Western sanctions against Russia may be increased, further disrupting crude oil trade flows.
Risk premium returns: Geopolitical conflicts have always been a "fuel" for oil prices. When the war between Russia and Ukraine broke out in 2022, Brent crude oil once surged to $139 per barrel. Although the current supply and demand environment is different, the market's sensitivity to emergencies remains.
📊Technical aspects
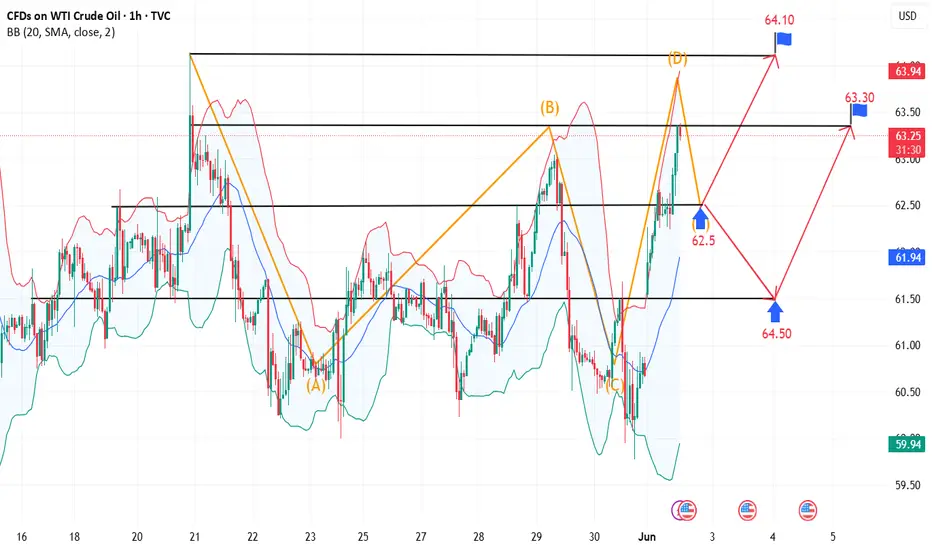
Crude oil fluctuated in a range last week, with a minimum of 59.8 and a maximum of 63. The weekly line closed at 60.7. The weekly line shows that oil prices are in an upward channel and there is a rebound. The focus is on whether 64 can be broken through. The daily line shows a large range of fluctuations. In summary, this week's operation ideas are mainly based on callbacks and longs. First look at the 63-61-58 range. In the day, the four-hour line is range-oscillated. First look at 4 on the top. The hourly line is oscillating upward. Today's big rise has come to our first target position, rising to the 63 line. From the shape, there is still room for growth. In summary, the intraday operation ideas are mainly oscillating upward, and the focus is on 61 and 60 below.
💰 Strategy Package
Long Position: 61.50-62.00
Crude oil is moving upward again, testing 63 today
💡Message Strategy
The Organization of the Petroleum Exporting Countries and its allies (OPEC+) met at their headquarters in Vienna on Wednesday to assess the current oil market situation. WTI crude oil prices climbed above $62 as OPEC+ said there would be no immediate change to current production policies.
📊Technical aspects
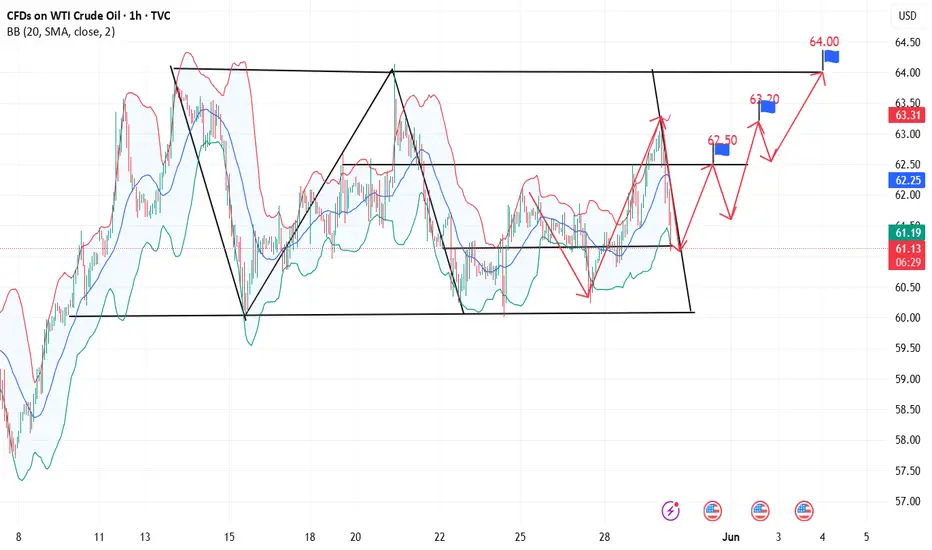
From the daily chart level, the medium-term moving average system suppresses the rebound of oil prices, and the medium-term objective trend is downward. After the oil price hit the low point of 55.20, the frequent alternation of long and short positions formed, and the embryonic form of a falling flag relay appeared from the shape. Pay attention to the strength of the oil price testing the upper edge of the flag. It is expected that after the medium-term trend fluctuates, it will still rise to the 64 position.
The short-term (1H) trend of crude oil fluctuates upward, and the oil price breaks through the 62.5 resistance level. The moving average system diverges and arranges upward, and the short-term objective trend direction is upward. In terms of momentum, the MACD indicator is above the zero axis and the golden cross opens upward, and the bullish momentum is sufficient. It is expected that the crude oil trend will continue to rise within the day.
💰 Strategy Package
Long Position: 61.20-62.00
Market Analysis: WTI Crude Oil Price Could Gain Bullish PaceMarket Analysis: WTI Crude Oil Price Could Gain Bullish Pace
WTI Crude Oil is gaining bullish momentum and might even test $62.75.
Important Takeaways for WTI Crude Oil Price Analysis Today
- WTI Crude Oil climbed above the $60.50 and $60.80 resistance levels.
- There was a break above a key bearish trend line with resistance at $60.80 on the hourly chart of XTI/USD at FXOpen.
WTI Crude Oil Price Technical Analysis
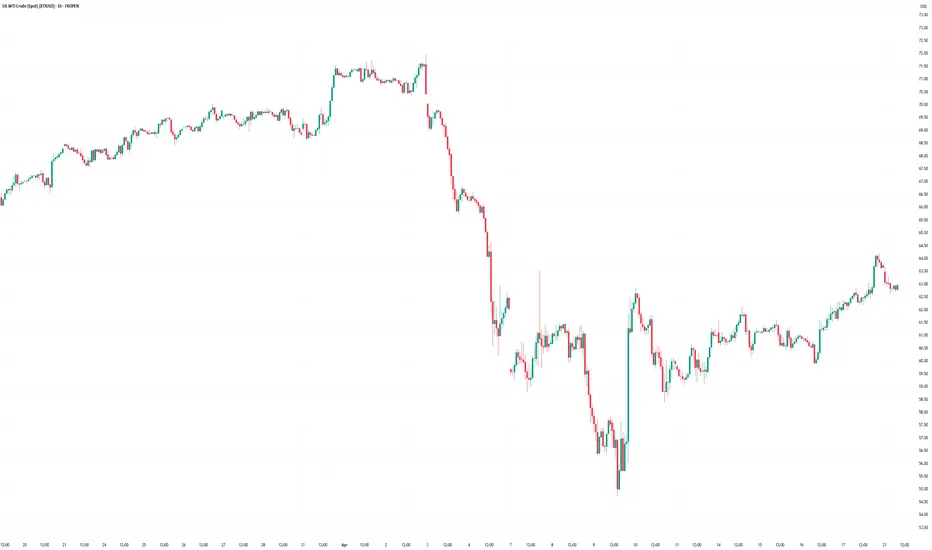
On the hourly chart of WTI Crude Oil at FXOpen, the price started a fresh upward move from $59.45 against the US Dollar. The price gained bullish momentum after it broke the $60.00 resistance.
The bulls pushed the price above the 50% Fib retracement level of the downward move from the $62.76 swing high to the $59.45 low. The price even climbed above the 50-hour simple moving average. Besides, there was a break above a key bearish trend line with resistance at $60.80.
It tested the $61.50 resistance zone and the 61.8% Fib retracement level of the downward move from the $62.76 swing high to the $59.45 low.
The RSI is now near the 50 level and the price could aim for more gains. If the price climbs higher again, it could face resistance near $62.00. The next major resistance is near the $62.75 level. Any more gains might send the price toward the $63.45 level or even $65.00.
Conversely, the price might correct gains and test the $60.80 support level. The next major support on the WTI Crude Oil chart is near the $59.45 zone, below which the price could test the $58.00 zone.
If there is a downside break, the price might decline toward $56.50. Any more losses may perhaps open the doors for a move toward the $55.50 support zone.
This article represents the opinion of the Companies operating under the FXOpen brand only. It is not to be construed as an offer, solicitation, or recommendation with respect to products and services provided by the Companies operating under the FXOpen brand, nor is it to be considered financial advice.

Crude oil rebounds after encountering 60 support
📊Technical aspects
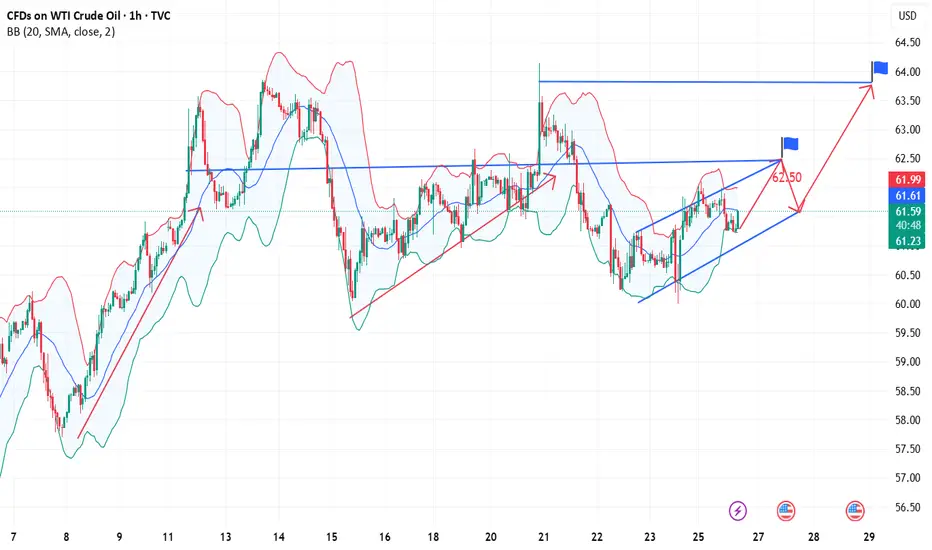
Due to concerns that global supply growth may exceed demand growth, WTI prices fell slightly and rebounded slightly after hitting the 60 mark.
From the daily chart level, the medium-term trend moving average system suppresses the rebound of oil prices, and the medium-term objective trend direction is downward. After the oil price hit the low of 55.20, the frequent alternation of long and short formed, and the embryonic form of the falling flag relay appeared from the shape. Pay attention to the strength of the oil price testing the upper edge of the flag. It is expected that after the medium-term trend fluctuates, it will still rise to the 64 position.
The short-term (1H) trend of crude oil fell and touched the key support of 60, then rose slightly. The moving average system turned to divergent upward arrangement, and the short-term objective trend direction was upward. The MACD indicator fast and slow lines crossed the zero axis, and the bullish momentum was sufficient. It is expected that the trend of crude oil will continue to rise during the day, and the probability of breaking through the 63 resistance and moving upward is relatively high.
💰 Strategy Package
Long Position: 60.5-61.5
WTI Crude Oil Price Targets Fresh GainsWTI Crude Oil Price Targets Fresh Gains
WTI Crude oil prices are gaining bullish momentum and might even test $63.50.
Important Takeaways for WTI Crude Oil Price Analysis Today
- WTI Crude climbed above the $60.90 and $61.50 resistance levels.
- There is a key rising channel forming with support at $61.30 on the hourly chart of XTI/USD at FXOpen.
WTI Crude Oil Price Technical Analysis
On the hourly chart of WTI Crude Oil at FXOpen, the price started a fresh upward move from $60.10 against the US Dollar. The price gained bullish momentum after it broke the $60.90 resistance.
The bulls pushed the price above the 50% Fib retracement level of the downward move from the $63.45 swing high to the $60.08 low. The price even climbed above the 50-hour simple moving average.
It tested the $62.15 resistance zone and the 61.8% Fib retracement level of the downward move from the $63.45 swing high to the $60.08 low. There is now a key rising channel forming with support at $61.30.
The RSI is now near the 50 level and the price could aim for more gains. If the price climbs higher again, it could face resistance near $62.15. The next major resistance is near the $62.65 level. Any more gains might send the price toward the $63.45 level or even $65.00.
Conversely, the price might correct gains and test the $61.30 support level. The next major support on the WTI crude oil chart is near the $60.90 zone, below which the price could test the $60.10 zone.
If there is a downside break, the price might decline toward $58.50. Any more losses may perhaps open the doors for a move toward the $55.50 support zone.
This article represents the opinion of the Companies operating under the FXOpen brand only. It is not to be construed as an offer, solicitation, or recommendation with respect to products and services provided by the Companies operating under the FXOpen brand, nor is it to be considered financial advice.

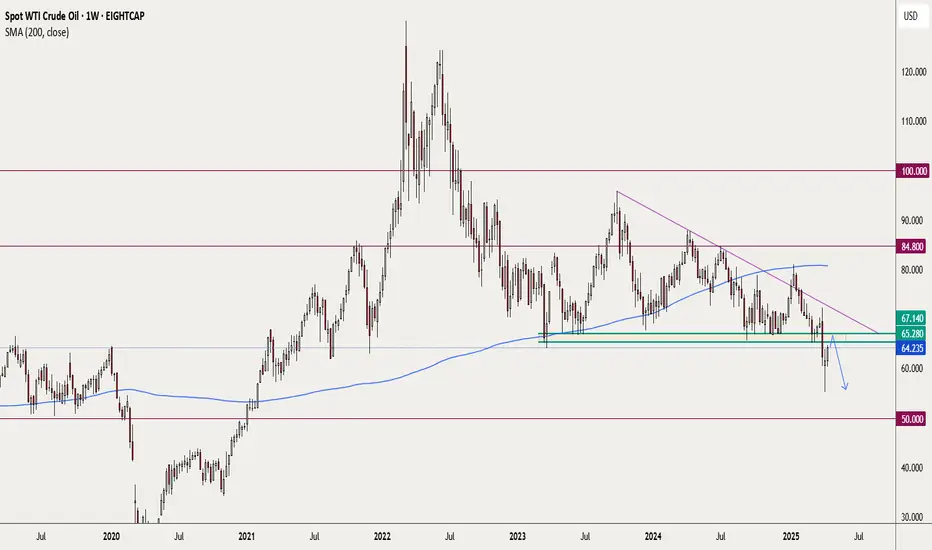
USOIL Weekly Analysis – Major Breakdown and Retest in PlayAfter several months of holding firm, USOIL has finally broken below its key support zone around $67–$70, which had acted as a floor since mid-2021 . This is a significant technical development, and the current price action is showing a classic bearish retest of that broken structure.
Technical Breakdown:
Support Broken:
The $67–$70 zone was tested multiple times over the past 2 years. Price has now cleanly broken through it and is struggling to reclaim it.
Retest in Progress:
Price is currently hovering around $62.36 and failing to push back above the broken support. This retest is textbook and could confirm further downside.
Market Structure:
Lower highs and lower lows dominate the weekly chart = clear bearish trend.
Bearish Targets:
Target 1: $53.50 – Previous minor demand zone from 2021.
Target 2: $41.50 – Strong historical support and potential major bounce area.
Invalidation Zone:
If price closes above $70 on the weekly chart, the breakdown would be invalidated and we’ll reconsider our bias.
Confluence:
Broken multi-year support
Bearish retest on weekly timeframe
Clear downside liquidity below
Summary:
Bias: Bearish
Setup: Short on confirmation of rejection below $67
Timeframe: Weekly / Daily
This is a high-probability setup if the rejection continues. Look for further bearish price action on the daily or 4H chart for refined entries. As always, manage risk carefully .
Like & Follow for more clean, high-timeframe breakdowns!
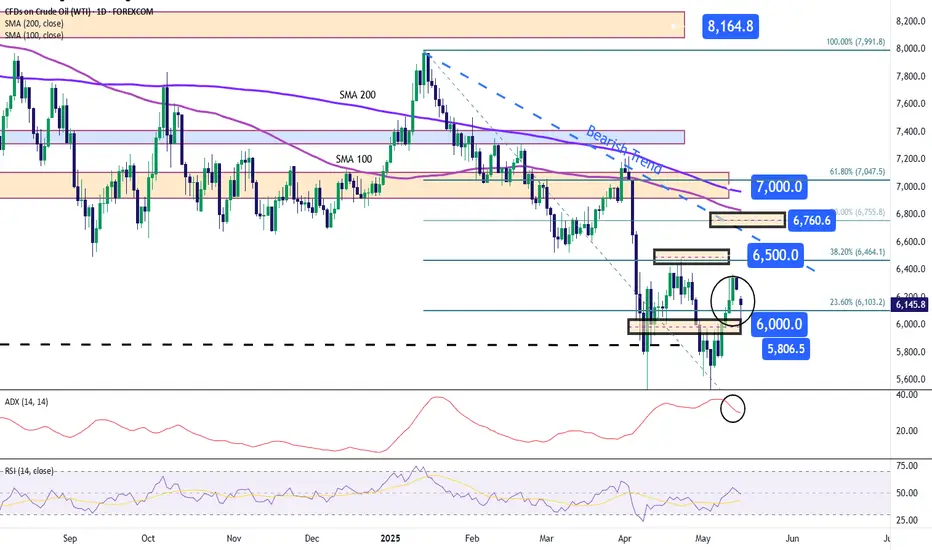
WTI Crude Returns to the $60 ZoneWTI crude oil has posted a drop of more than 4% in recent sessions as the market digests new announcements from OPEC+. The organization stated that current economic conditions could support growth in oil demand throughout 2025 and 2026. However, it remains firm in its decision to increase production starting in May and June, with monthly increments of 411,000 barrels per day, and has also announced another increase in July.
This stance has sparked concerns in the market about a potential short-term oversupply. If this strategy persists, selling pressure could return to WTI price action in the coming sessions.
Bearish Trend
Since January 20, a clear bearish trend has been forming, pushing the barrel’s price below the $60 mark. While a notable upward move is currently underway, it remains insufficient to break the prevailing bearish formation, which continues to be the dominant technical structure in the short term.
ADX
The ADX line was previously hovering around the 40 level, reflecting high volatility in price movements. However, it has begun to flatten, and if this continues, it could suggest a loss of directional strength, paving the way for a more neutral price behavior.
RSI
The behavior of the RSI mirrors that of the ADX. It is currently oscillating around the 50 level, indicating a balance between buying and selling pressure, and reinforcing the potential for a neutral phase in the short term.
Key Levels:
$65 – Current Resistance: Aligns with the 38.2% Fibonacci retracement and acts as a key psychological level. A breakout above this level could extend the current bullish bias over the coming sessions.
$67 – Distant Resistance: Matches the 50% Fibonacci retracement and a sideways zone observed in March. Sustained moves above this area could challenge the existing bearish structure on the chart.
$60 – Crucial Support: Represents a consistent area of indecision in recent months. If the price returns to this level, the previous bearish structure could regain strength in the short term.
Written by Julian Pineda, CFA – Market Analyst
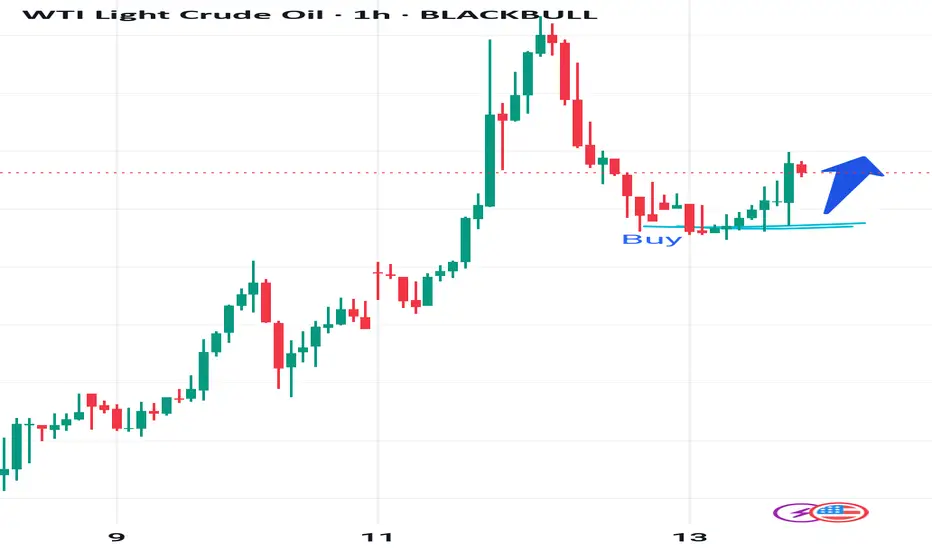
Oil Price Reversal? Why I’m Bullish on WTI Right Now! 🛢️ WTI crude oil is showing renewed bullish momentum. This move is backed by a shift in sentiment following the recent U.S.–China tariff truce and positive trade headlines. While OPEC+ supply increases and elevated inventories remain headwinds, surprise U.S. crude draws and strong jet fuel demand are tightening the market. I’m watching the current retrace. As always, keep risk tight—oil can turn fast! 🚀🛢️📈

WTI on high time frame
"Hello traders, focusing on WTI, the price is currently at a critical level of $62.
Candle formations on high time frames indicate a higher probability of the price declining to $53.
Given the influence of political and geopolitical news, there may be increased volatility in the price. This analysis will be updated accordingly."
If you have any more details to add or need further assistance, please feel free to let me know!

WTI crude (USOUSD) short continuation .. the week of 12 MayWill price retest the support/resistance zone one more time? That is what I am hoping for. Note that we have been seeing consistently lower highs. Price then broke below the zone, did one retest already and seems to be trying to retest it once again. I am looking for price to enter the zone and then give me some bearish evidence.
Stop – above the zone
1st target can be at 57.00 with the possibility to take this down to 52.00
This is not a trade recommendation; it’s merely my own analysis. Trading carries a high level of risk, carefully manage your capital and risk. If you like my idea, please give a “boost” and follow me to get even more.
It’s not whether you are right or wrong, but how much money you make when you are right and how much you lose when you are wrong – George Soros

WTI on high time frame , price reach 53$?
"Hello traders, focusing on WTI on high time frames, the price is approaching the $60.50 level, which holds significant importance. There is a high probability of price rejection at this level due to fundamental analysis.
When the price reaches the $60.50 zone, it is advisable to observe candle formations, momentum, and other indicators. This could present a favorable opportunity for a short position targeting the $53 level."
If you have any further questions or need additional assistance, feel free to let me know!

Market Analysis: WTI Crude Oil TumblesMarket Analysis: WTI Crude Oil Tumbles
WTI Crude oil is down over 10% and remains at risk of more losses.
Important Takeaways for WTI Crude Oil Price Analysis Today
- WTI Crude oil prices extended downsides below the $60.00 support zone.
- A major bearish trend line is forming with resistance near $57.25 on the hourly chart of XTI/USD at FXOpen.
WTI Crude Oil Price Technical Analysis
On the hourly chart of WTI Crude Oil at FXOpen, the price struggled to continue higher above $60.00 against the US Dollar. The price formed a short-term top and started a fresh decline below $58.00.
There was a steady decline below the $57.75 pivot level. The bears even pushed the price below $56.20 and the 50-hour simple moving average. Finally, the price tested the $55.00 zone. The recent swing low was formed near $55.01, and the price is now consolidating losses.
There was a minor move above the $55.50 level. On the upside, immediate resistance is near the $56.10 level and the 23.6% Fib retracement level of the downward move from the $59.49 swing high to the $55.01 low.
The next resistance is near the $57.25 level. There is also a major bearish trend line forming with resistance near $57.25. The trend line is near the 50% Fib retracement level of the downward move from the $59.49 swing high to the $55.01 low.
The main resistance is near a trend line at $57.75. A clear move above the $57.75 zone could send the price toward $59.45. The next key resistance is near $62.25. If the price climbs further higher, it could face resistance near $63.20. Any more gains might send the price toward the $65.00 level.
Immediate support is near the $55.00 level. The next major support on the WTI crude oil chart is near $53.00. If there is a downside break, the price might decline toward $52.00. Any more losses may perhaps open the doors for a move toward the $50.00 support zone.
This article represents the opinion of the Companies operating under the FXOpen brand only. It is not to be construed as an offer, solicitation, or recommendation with respect to products and services provided by the Companies operating under the FXOpen brand, nor is it to be considered financial advice.

USOIL CAUTION! BREAK - TEST - GO!This is my new updated chart of Oil.
Trump's "Drill baby Drill" interfering with the free market is the absolute worst thing he could do. His ridiculous tariffs will put us in an economic depression!
Oil prices are driven by demand! As I have mentioned here on TV so many times before! Increasing supply while heading into a recession is the dumbest thing possible! You never want to consume your own oil when you can consume others first! Simultaneously, F your own nation's oil company's profit margins and gov tax revenue!
This is why we shouldn't put toddlers as POTUS!
Anyway!!! This is a break test go! setup!
If you haven't seen it before, here is an example I recently posted with AAPL.
Click Boost, follow, subscribe! Let's get to 5,000 followers so I can help them navigate these crazy markets too. ))
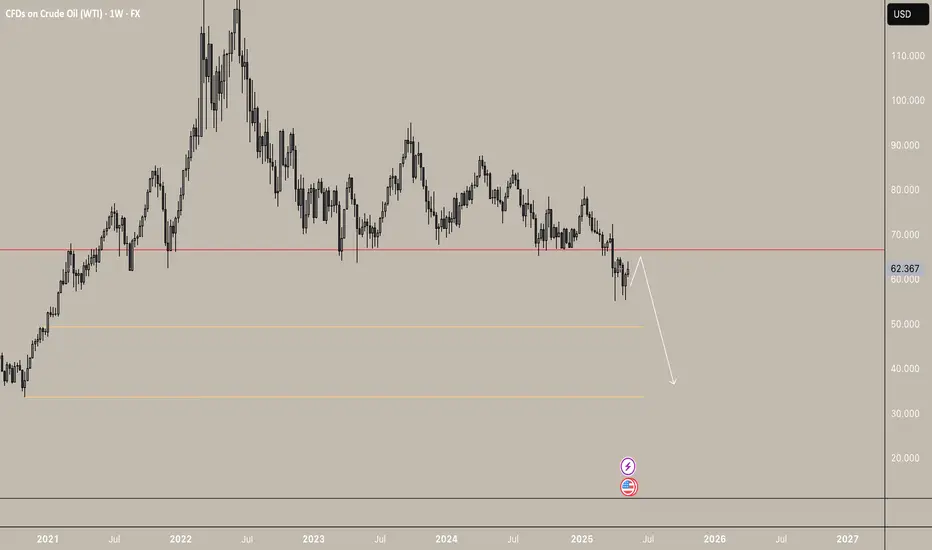
Is this still the ‘Top Trade’ of 2025? (WTI crude oil)It’s not a big secret actually- I’m talking about crude oil!
In the final week of 2024, the team and I highlighted two versions of the WTI crude oil weekly chart and asked ‘is this the top trade of 2024?’
Version 1 has already happened, WTI crude hit $55 per barrel, the downside objective of the smaller triangle pattern on the chart.
Version 2 showed a much larger triangle pattern (which we show again this week) and had a downside target of nearly $30! It would take a lot of conviction to ride the price that far down, but could crude oil still move a lot lower this year?
What’s interesting is that this is still one of the ‘less talked about’ situations in the market today because of the huge volatility seen in both stocks, forex and fixed income.
And I like that nobody’st talking about it - because you don’t want everyone in on it - that means the move could already be over.
Crude oil hit a five-year low. That’s meaningful.
Strong markets don’t hit 5-year lows, weak markets do. And we like to sell weak markets.
Of course, ‘oversold markets’ hit 5-year lows too - and that largely explains the ‘bottom feeders’ who bought WTI crude oil at $55.
Downside volatility got extreme owing to Trump’s tariffs and mean-reversion helped it rebound on news of the 90-day pause, much like stock markets.
I am completely open to the idea that $55 is a multi-year low and essentially marked the bottom. The huge Hammer reversal candlestick pattern adds weight to that idea.
But with the price having hit $65 last week, buying the lows is yesterday’s trade. What do we do today?
We will be looking to do what we said in Week 53 of 2024 in case crude oil turns out to be the ‘top trade of 2025’ as we imagined.
By the way, Brent crude oil has a very similar setup so this is not a ‘US oil’ thing.
There are two parts to trading ‘planning the trade, and trading the plan’.
There isn’t much use in making a plan, and not taking the trade.
There are always reasons not to take a trade- but if it’s a ‘good trade’ that fits the rules of your trading strategy, then those reasons are usually just ‘noise’.
WTI Crude (USO/USD)
Long term chart (weekly)
Trend: Down
Phase: Re-test of breakdown
Resistance = $70
Support = $55
Price action: Price has broken down, rebounded and is now testing the breakdown level, while under the 30-week moving average. Should the price break back over the broken long term rising trendline then we know the idea, or at least the timing on the idea is not right.
View: Bearish while under broken up-sloping long term support

Crude Oil Is Making Hard Work of Gains into ResistanceCride oil may have recovered back above $60, but it is making hard work of it. And with resistance looming and large specs increasing short bets, perhaps a pullback due. But does that mean a break below $60 is imminent?
Matt Simpson, Market Analyst at Forex.com and City Index

Market Analysis: WTI Crude Oil Rebounds in TandemMarket Analysis: WTI Crude Oil Rebounds in Tandem
WTI Crude oil prices climbed higher above $60.00 and might extend gains.
Important Takeaways for WTI Crude Oil Price Analysis Today
- WTI Crude oil prices started a recovery wave above the $60.00 and $61.50 resistance levels.
- There was a break below a connecting bullish trend line with support at $63.00 on the hourly chart of XTI/USD at FXOpen.
Oil Price Technical Analysis
On the hourly chart of WTI Crude Oil at FXOpen, the price started a recovery wave from $58.40 against the US Dollar. The price gained bullish momentum after it broke the $60.00 resistance and the 50-hour simple moving average.
The bulls pushed the price above the $61.50 and $62.00 resistance levels. The recent high was formed at $64.20 and the price started a downside correction. There was a minor move below the 23.6% Fib retracement level of the upward move from the $59.87 swing low to the $64.18 high.
There was a break below a connecting bullish trend line with support at $63.00. The RSI is now below the 50 level. Immediate support on the downside is near the $62.0 zone or the 50% Fib retracement level of the upward move from the $59.87 swing low to the $64.18 high.
The next major support on the WTI crude oil chart is near the $61.50 zone, below which the price could test the $59.90 level. If there is a downside break, the price might decline toward $58.40. Any more losses may perhaps open the doors for a move toward the $56.20 support zone.
If the price climbs higher again, it could face resistance near $64.20. The next major resistance is near the $65.00 level. Any more gains might send the price toward the $68.50 level.
This article represents the opinion of the Companies operating under the FXOpen brand only. It is not to be construed as an offer, solicitation, or recommendation with respect to products and services provided by the Companies operating under the FXOpen brand, nor is it to be considered financial advice.
USOUSD (WTI crude) breakout-pullback-bearish continuation?Oil has been bearish for several months now and making mostly lower highs while the area between 67.140 and 65.280 has provided solid support. About 3 weeks ago a breakout below occurred and a pullback to the support zone is now in progress.
I will be monitoring PA closely next week to see if there is any evidence of bearish continuation. If bearish price action does resume, IMO, we could well see the round number 50.00 be achieved.
This is not a trade recommendation; it’s merely my own analysis. Trading carries a high level of risk, so only trade with money you can afford to lose and carefully manage your capital and risk. If you like my idea, please give a “boost” and follow me to get even more. Please comment and share your thoughts too!!
It’s not whether you are right or wrong, but how much money you make when you are right and how much you lose when you are wrong – George Soros
Crude rallies on Trump China trade optimism, WTI test key levelCrude oil prices were already on the ascendency but have just hit fresh highs on the day after the latest Trump remarks:
WILL MAKE GOOD DEAL WITH CHINA
WE WILL HAVE A DEAL WITH CHINA
But...
*TRUMP SAYS HE'S IN 'NO RUSH' TO CLOSE DEALS
Anyway WTI has risen to session highs, now testing a major resistance area around $65 give or take $1. The area is shaded on the chart. If we go above this zone then bullish, else the bears remain in control.
By Fawad Razaqzada, market analyst with FOREX.com
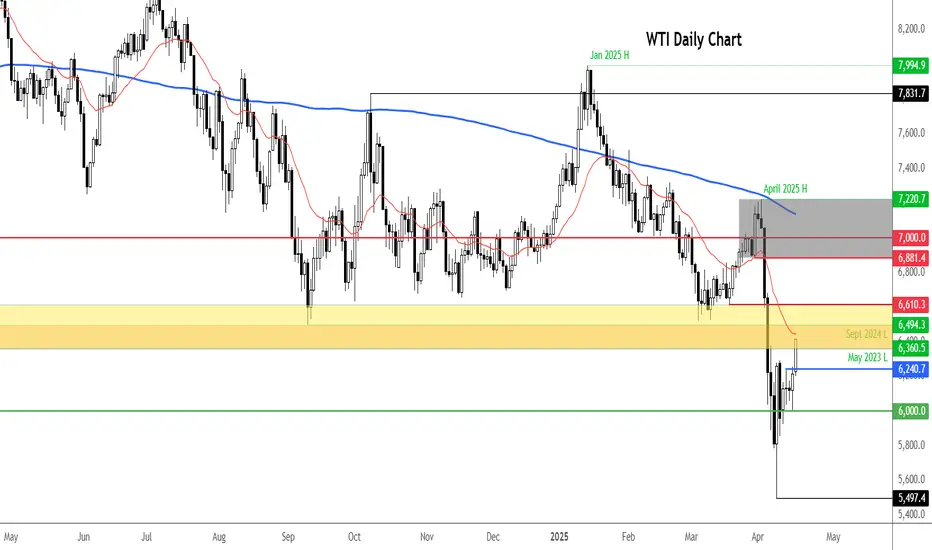
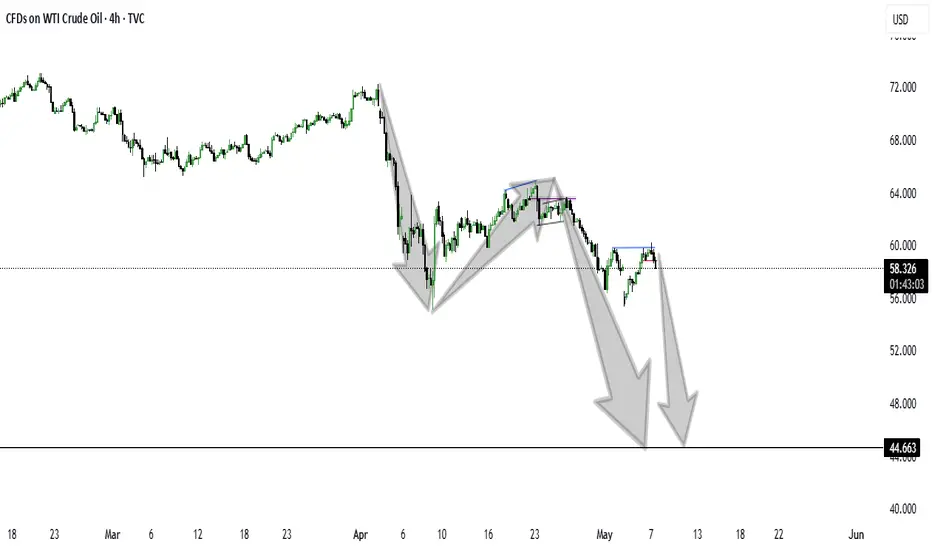
Oil - Looking To Sell Pullbacks In The Short TermH4 - Strong bearish move.
No opposite signs.
Currently it looks like a pullback is happening.
Expecting bearish continuation until the two Fibonacci resistance zones hold.
If you enjoy this idea, don’t forget to LIKE 👍, FOLLOW ✅, SHARE 🙌, and COMMENT ✍! Drop your thoughts and charts below to keep the discussion going. Your support helps keep this content free and reach more people! 🚀
--------------------------------------------------------------------------------------------------------------------
Disclosure: I am part of Trade Nation's Influencer program and receive a monthly fee for using their TradingView charts in my analysis.
