The chop in WTI continues...The chop in WTI continues as volatility & supply give mixed signals.
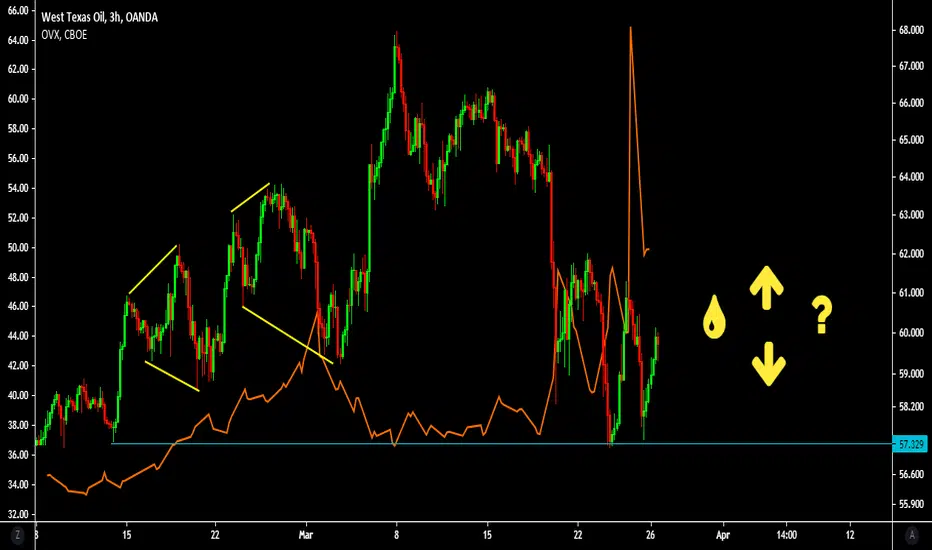
Yesterday we highlighted the importance of keeping track of the move in OVX (oil volatility) after the big spike into the close on Wednesday. At the open yesterday, we saw OVX come down sharply but failed to take out the prior low and confirmed the recent upward trending move in volatility is still in place (negative for the underlying asset).
Thus, from a pure volatility point of view the probability if higher for further downside for WTI. However, the issue with the Suez Canal being blocked, and reports out earlier during Asia-Pac that the efforts to unblock the ship might take another week saw some relief for Oil prices.
So, where to from here? The med-term bias remains tilted to the upside, but we've had very violent moves in volatility over the past few sessions which is a warning sign.
For now, the best option is to wait and see how volatility behaves in today's session. If the Suez concerns are enough to keep price elevated and we see OVX taking out recent lows, that could be setting up for a long opportunity.
However, if we see OVX maintain it's upward trending move despite the more constructive price action, it might be best to stay on the side lines in the short-term.
Wticrudeoil
WTI on the verge of a reversal?The rally of black gold in the form of the oil price, especially the WTI grade, peaked at the beginning of the month in the direction of the USD 70.00 mark. The appreciation, which became increasingly pronounced with the breakout at the end of 2020, ended just before this. The support level around USD 59.00 per barrel was fiercely contested these days. However, with yesterday's price weakness, after the impulse recovery from the talk, WTI oil is again at a stalemate. If new lows can be prevented, there could be a rapid upward movement to USD 62.00 and beyond to USD 66.00 as part of the defence of the upward trend line since December. The USD 70.00 mark would be within reach again.
Below USD 57.40, on the other hand, a further downward wave to the next support at USD 52.00 would have to be expected. A dip below this would be critical. Contrary to the actually bullish seasonality, there could then be further declines to 48.00 and 46.00 USD.
If you liked the analysis, we would be pleased if you liked or subscribed to it. You will be supporting our work enormously!
Notice:
Despite careful analysis, Global Investa assumes no responsibility for the content, timeliness, accuracy or completeness of the information provided. In particular, the information provided does not constitute investment advice, a recommendation to buy or investment brokerage and can in no way replace investor- and investment-appropriate advice from a professional investment advisor who takes into account the client's individual economic circumstances and level of experience.

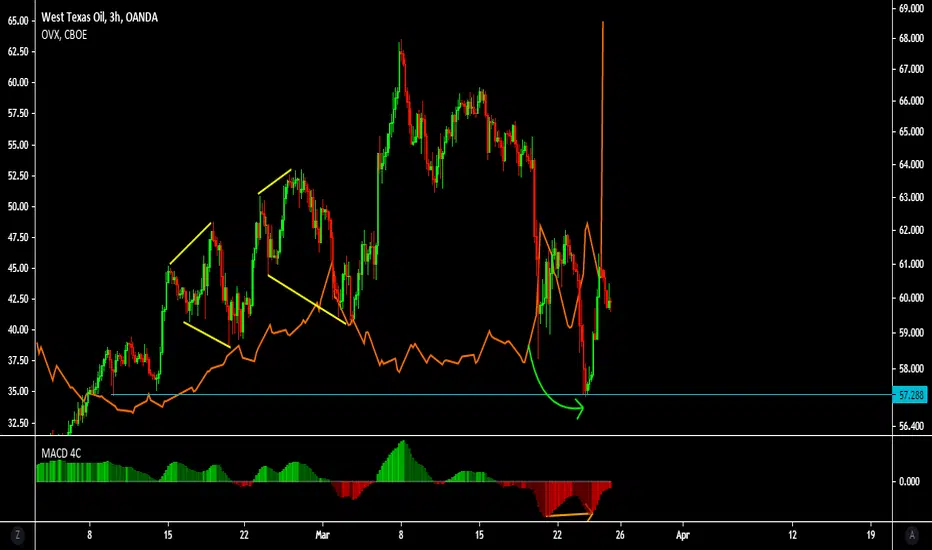
What does yesterday meteoric spike in OVX mean for WTI?We don't know yet. OVX shot up to 64.91 into yesterday's close. It is unclear whether this might be a glitch on CBOE's side, or whether it might be month-end or quarter-end related, but it was a meteoric jump.
To put the size of the move into context, very recently in Septmeber and November when we had similar spike, it came as a result of a 16% and 14% drop in WTI. Compared to yesterday where prices barely moved 2% from the close to the Asia-Pac lows.
The challenges at the Suez Canal might have led to an abnormal increase in implied volatility, but if that os the case it would be a major "over-reaction" on the options side of the market. The other possibility is that the recent drop in prices led to a surge hedging with holders of underlying oil longs potentially buying up downside protection.
Whatever the reason, it's too early to tell how this might affect prices. Usually, this type of move would suggest a push lower in prices, but WTI has remained very calm, for now at least. In the meantime, with the warnings of a potential messy month-end and quarter-end rebalancing for equities and fixed income, we do want to tread carefully here.
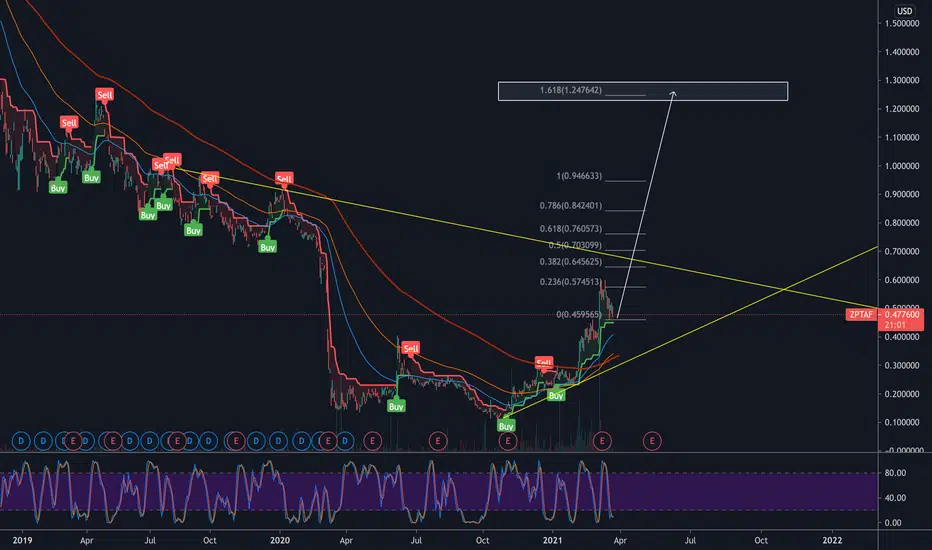
ZPTAFpicked up some here b c WTI looks super wrecked and so does this stock. And also thinking the DXY gets blocked around $92.7 could be a nice bounce
WTI OIL Rebound on the 1D MA50Pattern: Fibonacci Channel on 4H.
Signal: Buy as the price hit the 1D MA50 (green dotted line) and rebounded while the 4H MACD made a Bullish Cross.
Target: 69.00 (the 2.0 Fib extension) and 72.00 (the 2.5 Fib extension).
** Please support this idea with your likes and comments, it is the best way to keep it relevant and support me. **
--------------------------------------------------------------------------------------------------------
!! Donations via TradingView coins also help me a great deal at posting more free trading content and signals here !!
🎉 👍 Shout-out to TradingShot's 💰 top TradingView Coin donor 💰 this week ==> jsunde73
--------------------------------------------------------------------------------------------------------

Long or Short run on OILHi guys, it seem oil is about to move again, this time around I guess price will reach $76 per barrel or if price breaks below the trend line and retest it, well I might target $50 per barrel for the short...
What do you guys think?

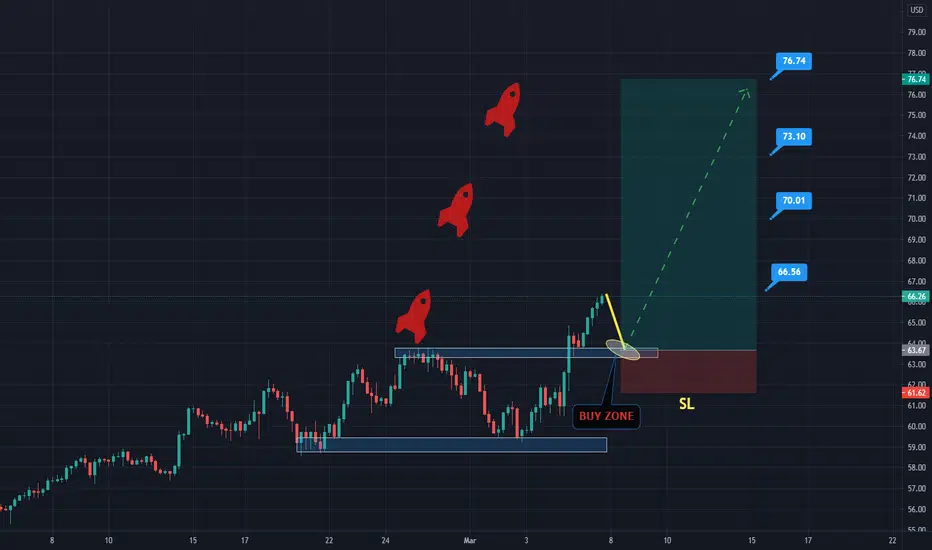
USOIL BUY TILL 77$ BARREL AS I HAD PREDICT IN OUR PREVIOUS ANALYSIS THAT US OIL (CRUDE) IS GOING TO ACHIEVE 60$ WHICH IS SUCCESSFULLY DONE
AND NOW IT HAD BREAK THAT LEVEL AND TRADING 66$ WE ARE PLANING TO BUY OIL AGAIN ONCE IT WILL RETRACE TILL BUYING ZONE AND FROM THIS SUPPORT
WE WILL BUY AGAIN MORE OIL TILL DESIGN OUR NEW LEVELS
friends PUSH LIKE AND COMMENTS WE APPRECIATE UR LOVE
FOLLOW US FOR MORE UPDATES
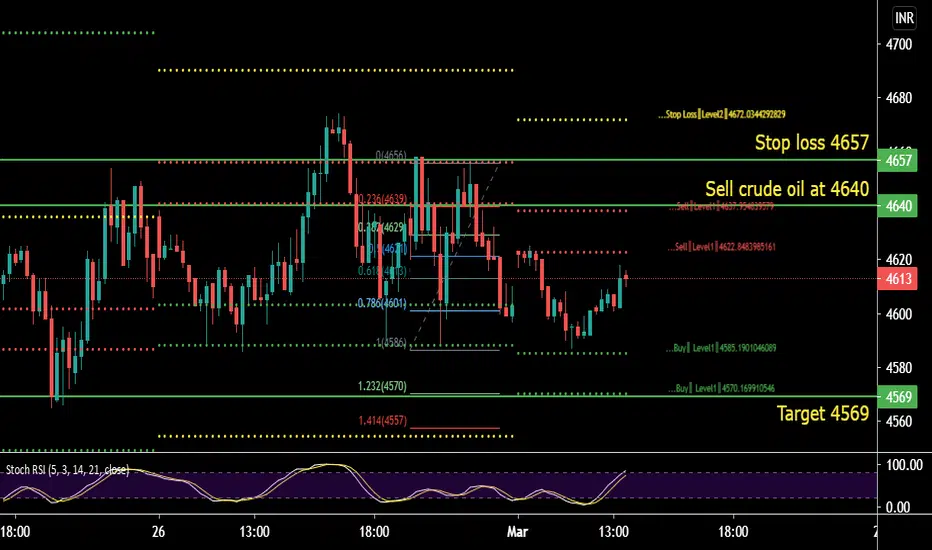
Crude oil Buy / Sell Based on Fibo and Gann INTRADAYCrude oil sell based on Gann and Fibonacci
Sell crude oil at 4640
Stop loss 4657
Target 4569
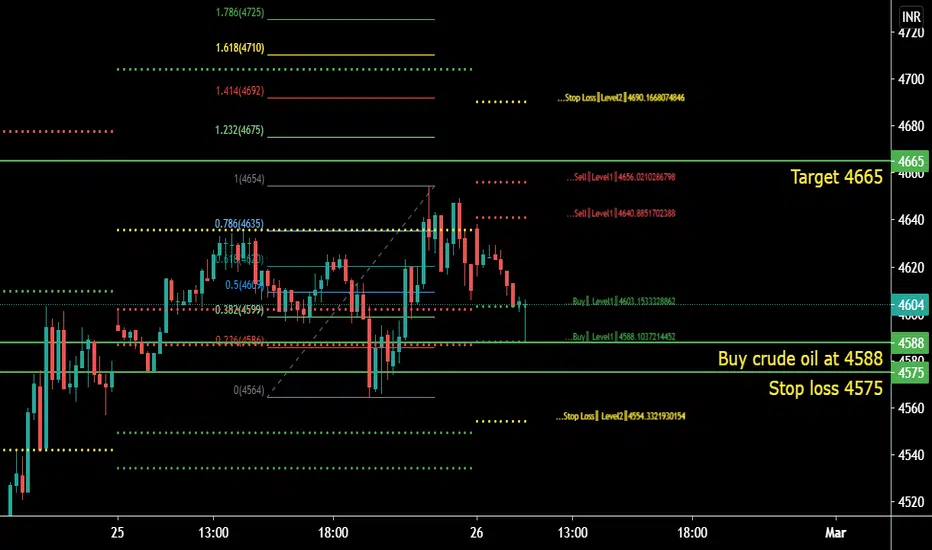
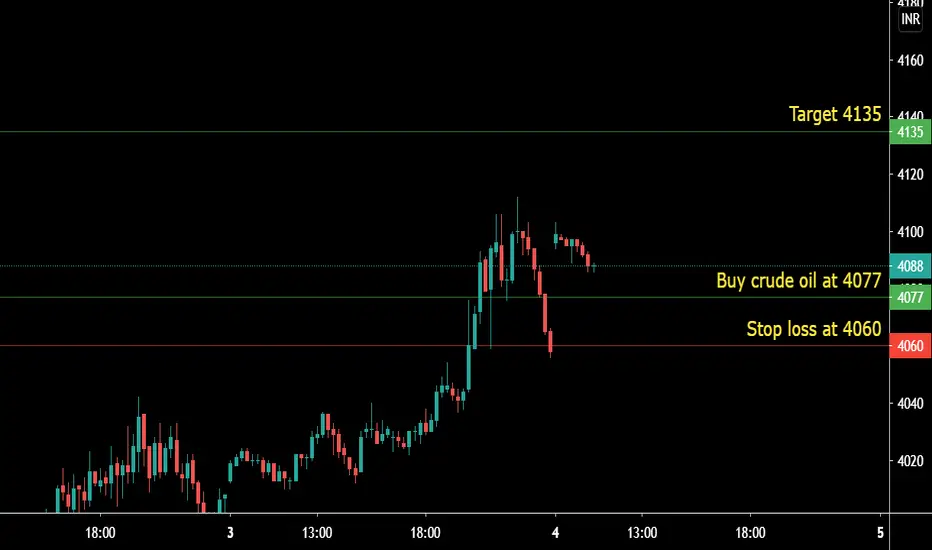
Bank Nifty Buy / Sell based on Fibo and Gann INTRADAYCrude oil buy based on fibonacci and GANN
Buy at 4588
stop loss 4575
Target 4665
A look at WTI Crude Oil on the daily, last resistance level!Good morning, as you can see from the chart we are coming into the last reistance level for WTI Crude oil at 63.3-63.4 range. From there a clean break above and we open up the 66-76 level for oil. Watch in conjunction both USO and UCO as indicators of the strength of the move.

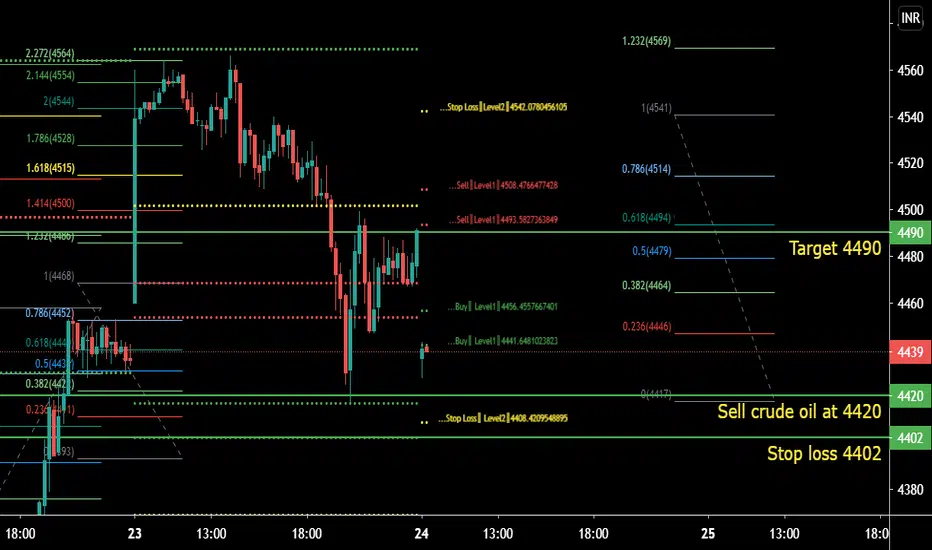
Crude oil Buy / Sell Based on Fibo and Gann INTRADAYcrude oil buy at 4420
Stop loss 4402
Target 4490
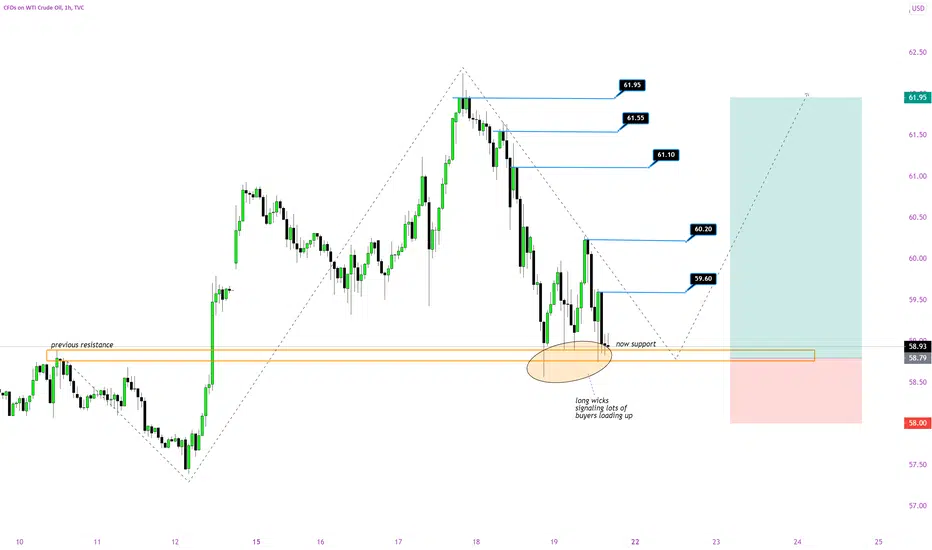
US Oil Will It Hold Around $59? We have previous RBS(Resistance Base Support) flip with tons of buyers in the zone of $59. 5 Tp targets with decent stop loss
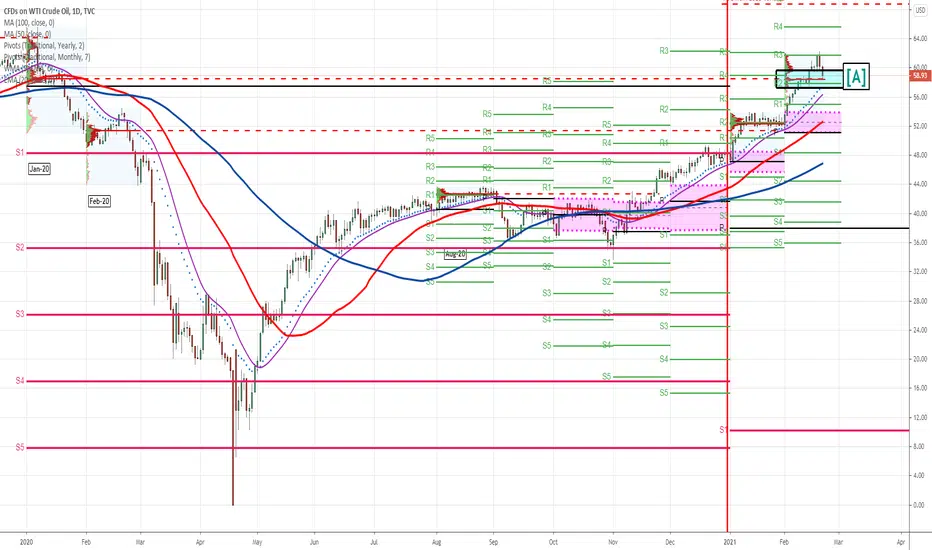
Crude Oil WTI ending 19-February-2021I believe there are several key areas that were broken this week that will need to be tested before price continues to move up .
The first item is the volume point of control (POC) from January 2020. This link was never test and now price, this week, broke through. A key indicator of future price movement will be if this line becomes support for price. If price falls below and cannot move back above, then future highs may be questionable.
The second item is the volume POC in February 2021 that is currently in progress. This POC is aligned with the Jan 2020 POC and will be of interest to see if this will provide support too with same analysis.
The third item is the February 2021 R2 level which provided support earlier in the month. The February R3 level acted as resistance earlier in the week and now it will be key for R2 to provide support for higher prices.
The last key area of support could be the 20ema. Price may consolidate the first part of the coming week to allow these two to converge.
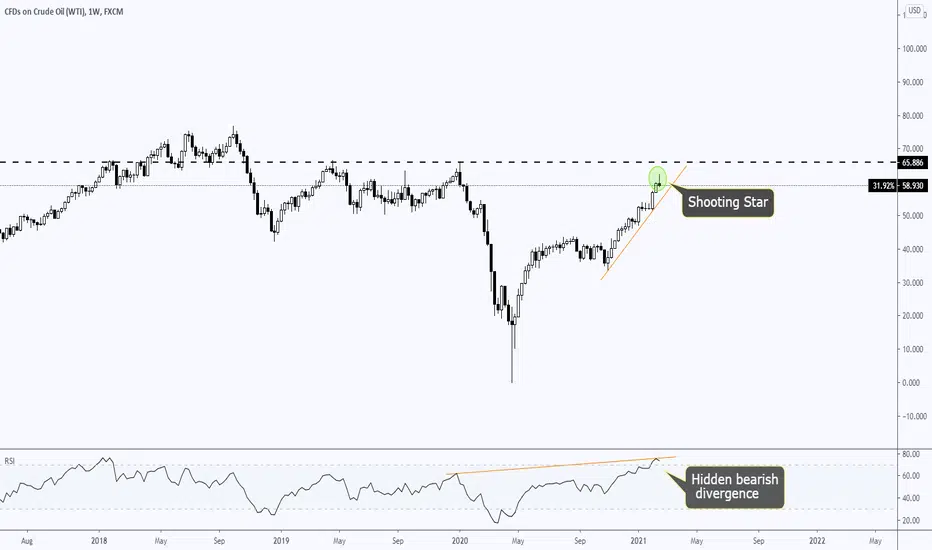
CRUDE OIL~SHOOTING STAR AS SIGN OF REVERSALHello traders and investors,
Welcome to technical analysis of CRUDE OIL.
if you like this analysis please like and comment below, it will support creating more analysis for you.
we see shooting star candlestick near major weekly resistance on weekly chart , this can be sign of reversal .
hidden bearish divergence also gives us indication of bears are coming soon.
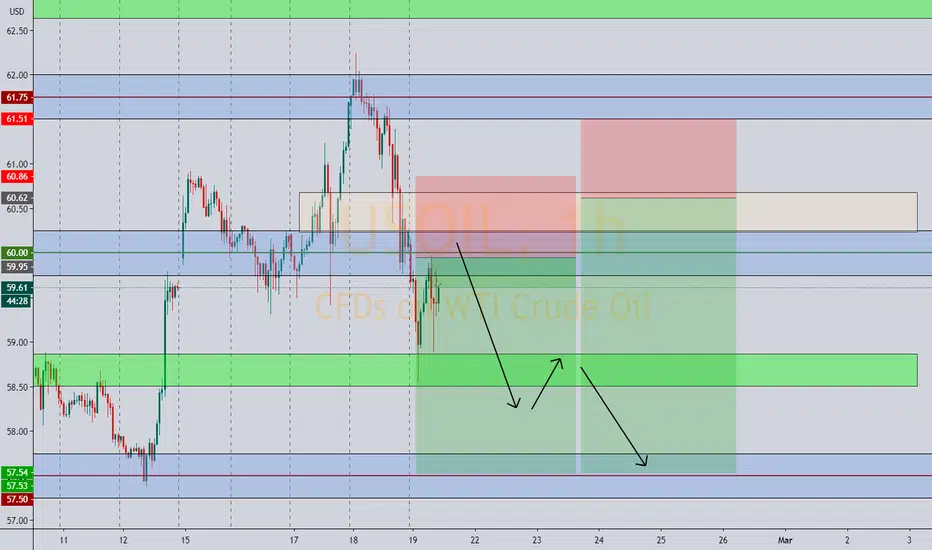
WTI CRUDE INTRADAY OPPORTUNITYWTI Crude is beginning to show signs of weakness after a 4 months bullrun. We see the possibility of a short term sell off to 57.40 a QP level with potential buyside liquidity. There are two potential areas of entry: 60.00 a QP level and 60.62 a OB level. Both positions targeting 57.50 with an oportunity to take some profit at 58.50.
This does not suffice as a signal or financial advice so please do your due deligence.
Open your favorite energy drink boys: we're bullish with wingsMy crystal ball has again spoken to me: USOIL be pumpin' it. And not just from the ground. Covid is saying a big NO to newer sources of energy. This year we're falling back on the good old black gold. So bring out your Justin boots and go loooong on that sweet USOIL, partner.
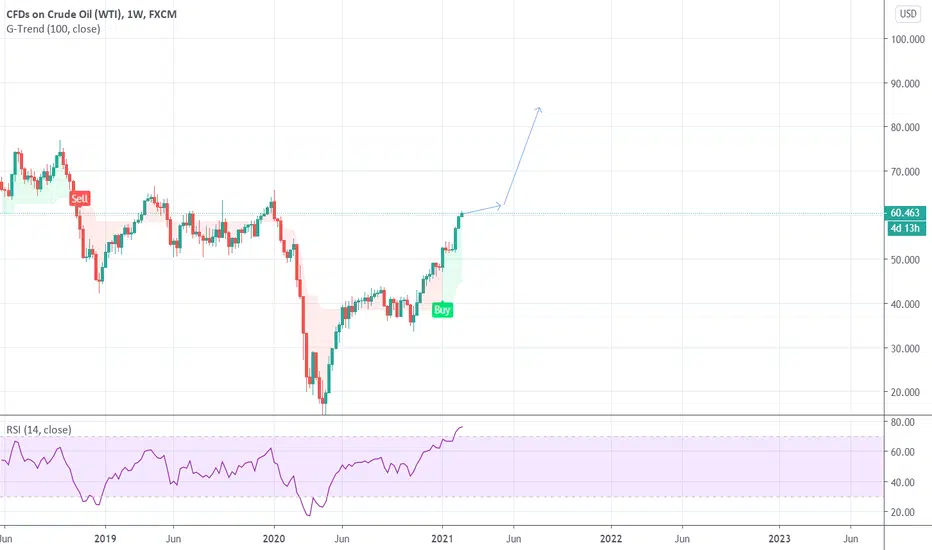
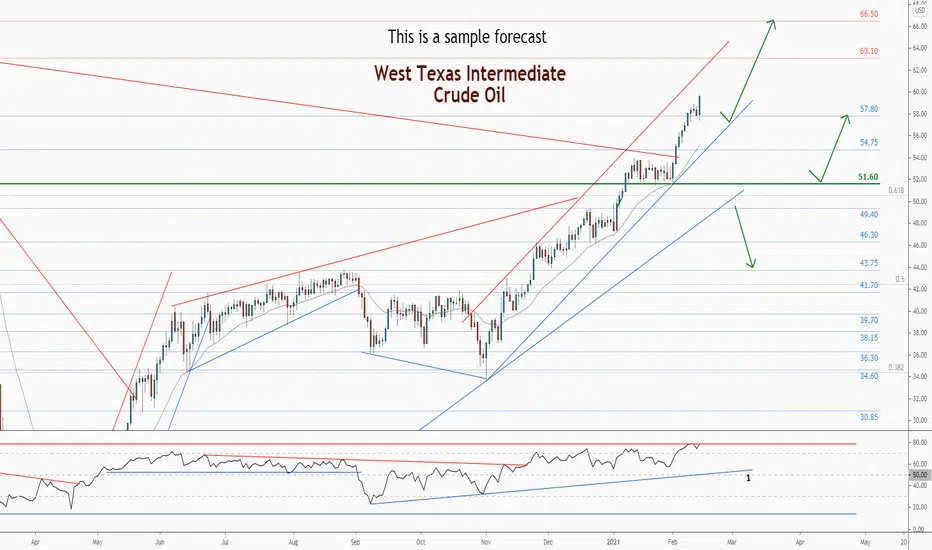
💡WTI . Weekly Technical Analysis UpdateMidterm forecast:
51.60 is a major support, while this level is not broken, the Midterm wave will be uptrend.
Technical analysis:
While the RSI uptrend #1 is not broken, bullish wave in price would continue.
A trough is formed in daily chart at 51.60 on 02/01/2021, so more gains to resistance(s) 63.10, 66.50, 72.55 and more heights is expected.
Price is above WEMA21, if price drops more, this line can act as dynamic support against more losses.
Relative strength index (RSI) is 79.
❤️ If you find this helpful and want more FREE forecasts in TradingView
. . . . . Please show your support back,
. . . . . . . . Hit the 👍 LIKE button,
. . . . . . . . . . Drop some feedback below in the comment!
❤️ Your Support is very much 🙏 appreciated! ❤️
💎 Want us to help you become a better Forex trader ?
Now, It's your turn !
Be sure to leave a comment let us know how you see this opportunity and forecast.
Trade well, ❤️
ForecastCity English Support Team ❤️
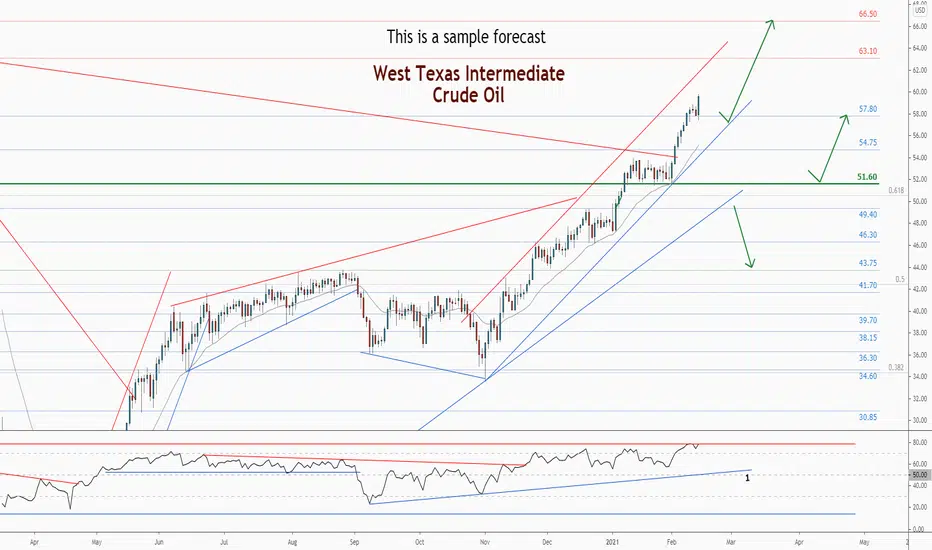

WTICO USD SELL (WEST TEXAS INTERMEDIATE CRUDE OIL - US DOLLAR)Hi there. Price is forming a reversal pattern to change its direction.
Watch strong price action at the current levels for sell.

USOIL VERY IMPORTANT WEEKLY TRENDLINE WTIOIL CRUDE OILUSOIL VERY IMPORTANT WEEKLY TRENDLINE WTIOIL CRUDE OIL

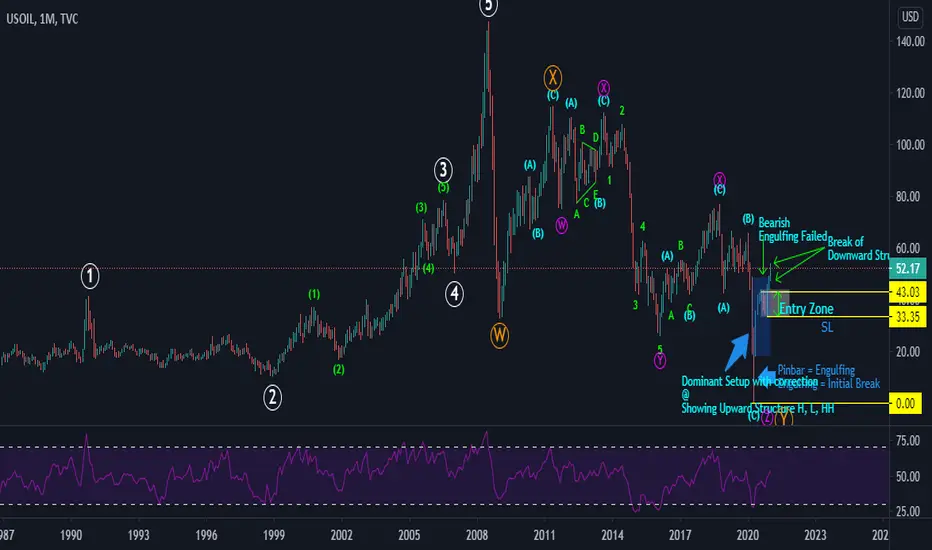
US OIL @ WTIBreak UP of Downward Structure in Monthly .
It may pullback to retest the breakout zone and then continue higher