Market Analysis: WTI Crude Oil Faces HurdlesMarket Analysis: WTI Crude Oil Faces Hurdles
Crude oil is showing bearish signs and might decline below $62.80.
Important Takeaways for WTI Crude Oil Price Analysis Today
- Crude oil prices failed to clear the $65.00 region and started a fresh decline.
- There was a break below a major bullish trend line with support at $64.00 on the hourly chart of XTI/USD.
WTI Crude Oil Price Technical Analysis
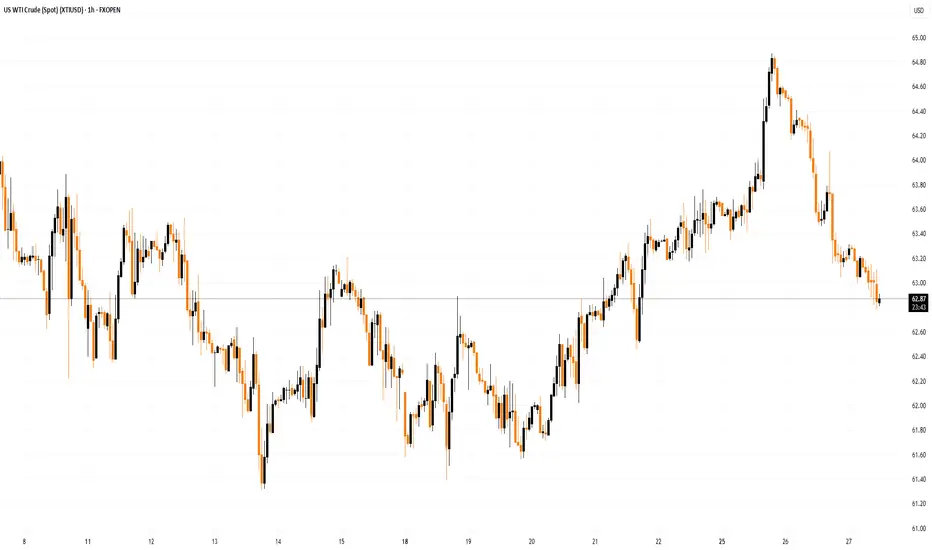
On the hourly chart of WTI Crude Oil, the price struggled to clear the $65.00 level and started a fresh decline below $64.50.
There was a break below a major bullish trend line at $64.00, opening the doors for more losses. The price dipped below the 50% Fib retracement level of the upward move from the $61.56 swing low to the $64.85 high.
XTI/USD even dipped below $63.50 level and the 50-hour simple moving average. The bulls are now active near $63.00. If there is a fresh increase, it could face a barrier near $63.70.
The first major resistance is near $64.10. Any more gains might send the price toward $64.85 and call for a test of $65.50. Conversely, the price might continue to move down and revisit the $62.80 support and the 61.8% Fib retracement.
The next major support on the WTI crude oil chart is $62.35. If there is a downside break, the price might decline toward $61.55. Any more losses may perhaps open the doors for a move toward $60.50.
This article represents the opinion of the Companies operating under the FXOpen brand only. It is not to be construed as an offer, solicitation, or recommendation with respect to products and services provided by the Companies operating under the FXOpen brand, nor is it to be considered financial advice.
Wticrudeoilwti
Market Analysis: Oil Prices Ease – Market Awaits Fresh CatalystMarket Analysis: Oil Prices Ease – Market Awaits Fresh Catalyst
WTI crude oil is also down and remains at risk of more losses below $64.60.
Important Takeaways for WTI Crude Oil Price Analysis Today
- WTI crude oil price continued to decline below the $66.00 support zone.
- It traded below a connecting bullish trend line with support at $65.60 on the hourly chart of XTI/USD at FXOpen.
WTI Crude Oil Price Technical Analysis
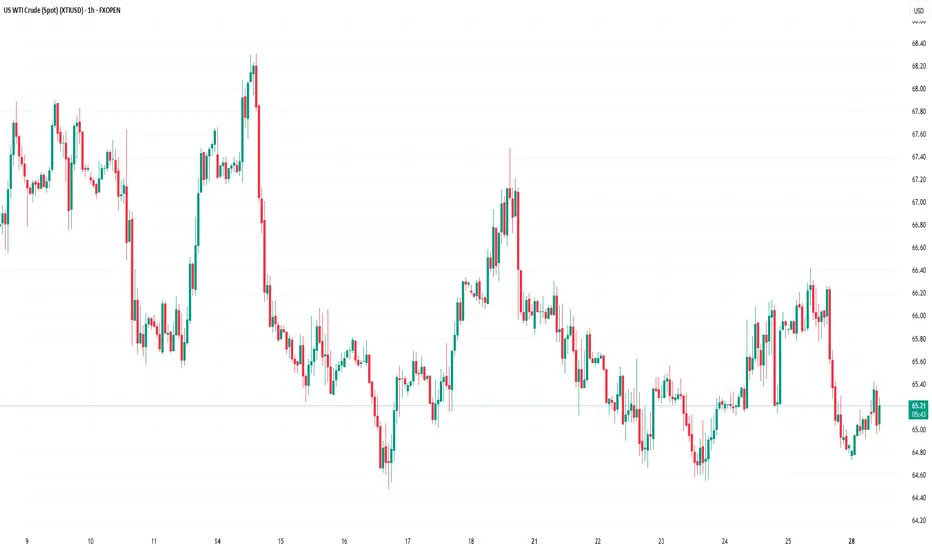
On the hourly chart of WTI crude oil at FXOpen, the price struggled to continue higher above $67.50. The price formed a short-term top and started a fresh decline below $66.00.
There was a steady decline below the $65.80 pivot level. The bears even pushed the price below $65.00 and the 50-hour simple moving average. The price traded below a connecting bullish trend line with support at $65.60.
Finally, the price tested the $64.75 zone. The recent swing low was formed near $64.73, and the price is now consolidating losses. On the upside, immediate resistance is near the $65.60 zone. It is close to the 50% Fib retracement level of the downward move from the $66.42 swing high to the $64.73 low.
The main resistance is $65.80. A clear move above it could send the price towards $66.40. The next key resistance is near $67.50. If the price climbs further higher, it could face resistance near $70.00. Any more gains might send the price towards the $72.00 level.
Immediate support is near the $64.60 level. The next major support on the WTI crude oil chart is near $63.20. If there is a downside break, the price might decline towards $60.00. Any more losses may perhaps open the doors for a move toward the $55.00 support zone.
This article represents the opinion of the Companies operating under the FXOpen brand only. It is not to be construed as an offer, solicitation, or recommendation with respect to products and services provided by the Companies operating under the FXOpen brand, nor is it to be considered financial advice.
WTI Crude Oil Climbs Higher Amid Market OptimismMarket Analysis: WTI Crude Oil Climbs Higher Amid Market Optimism
WTI Crude Oil price climbed higher above $66.50 and might extend gains.
Important Takeaways for WTI Crude Oil Price Analysis Today
- WTI Crude Oil price started a decent increase above the $66.60 resistance levels.
- There was a break above a connecting bearish trend line with resistance at $67.15 on the hourly chart of XTI/USD at FXOpen.
Oil Price Technical Analysis
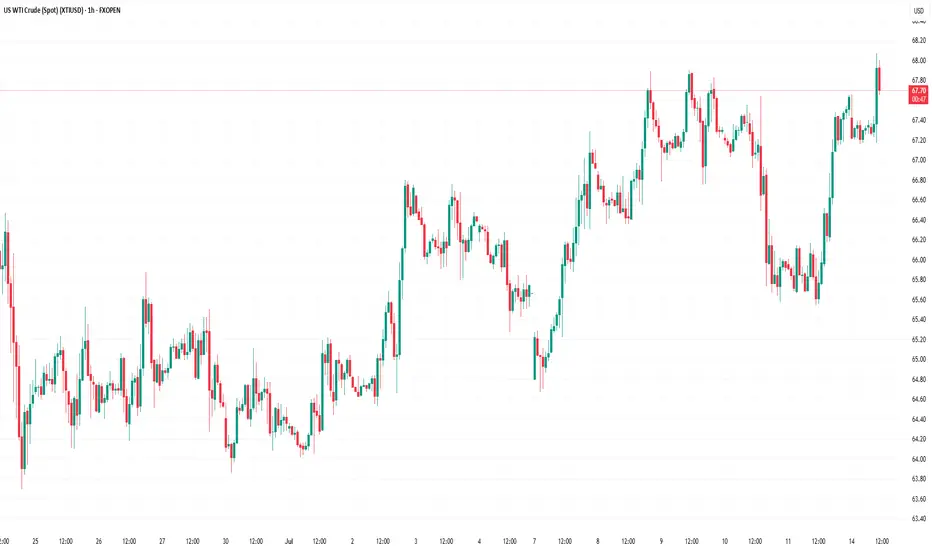
On the hourly chart of WTI Crude Oil at FXOpen, the price started a decent upward move from $65.50. The price gained bullish momentum after it broke the $66.50 resistance and the 50-hour simple moving average.
The bulls pushed the price above the $67.00 and $67.50 resistance levels. There was a break above a connecting bearish trend line with resistance at $67.15.
The recent high was formed at $67.63 and the price started a downside correction. There was a minor move toward the 23.6% Fib retracement level of the upward move from the $65.54 swing low to the $67.63 high.
The RSI is now above the 60 level. Immediate support on the downside is near the $67.15 zone. The next major support on the WTI Crude Oil chart is near the $66.60 zone or the 50% Fib retracement level, below which the price could test the $65.50 level. If there is a downside break, the price might decline toward $64.70. Any more losses may perhaps open the doors for a move toward the $63.50 support zone.
If the price climbs higher again, it could face resistance near $67.85. The next major resistance is near the $70.00 level. Any more gains might send the price toward the $72.50 level.
This article represents the opinion of the Companies operating under the FXOpen brand only. It is not to be construed as an offer, solicitation, or recommendation with respect to products and services provided by the Companies operating under the FXOpen brand, nor is it to be considered financial advice.
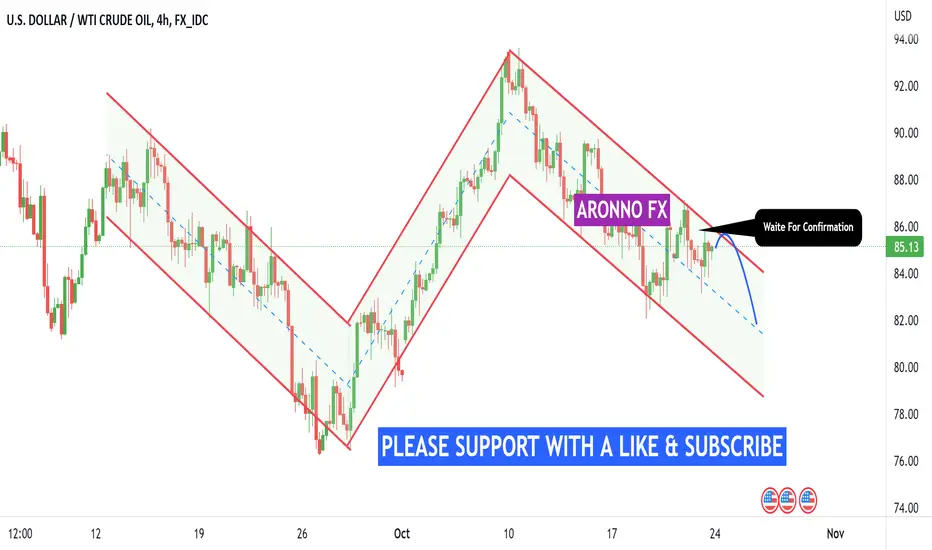
WTI CRUDE OIL WAITE FOR CONFARMANATION...
Hello Traders, here is the full analysis for this pair,
let me know in the comment section below if you have any questions,
the entry will be taken only if all rules of the strategies will be
satisfied. I suggest you keep this pair on your watch list and see if
the rules of your strategy are satisfied.
Dear Traders,
If you like this idea, do not forget to support with a like and follow.
PLZ! LIKE COMMAND AND SUBSCRIBE.

WTI CRUDE OIL POSSIBLE TO GO DOWN
AronnoFX will not accept any liability for loss or damage as a result of
reliance on the information contained within this channel including
data, quotes, charts and buy/sell signals.
If you like this idea, do not forget to support with a like and follow.
Traders, if you like this idea or have your own opinion about it,
write in the comments. I will be glad.
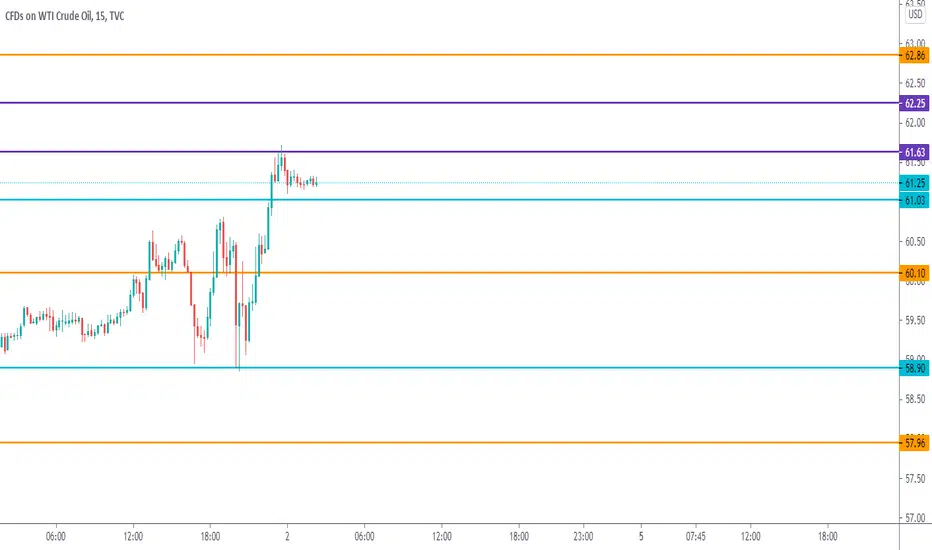
US Oil Weekly levels Magic Lines:
All supports are not for buy level. As like all resistance are not for sell levels
After long research and back testing we find which S&R is for sell level & which S&R is buy level.
In that result we give the pure intraday levels in charts.
BLUE LINE ARE BUY LEVELS
ORANGE LINES ARE SELL LEVELS
IF OPENING 15MIN CANDLE TOUCH BLUE LINE GO FOR LONG/ IF OPEING 15 MIN CANDLE TOUCH ORANGE LING GO FOR SHORT.
There are 10 different pattern for getting entry in market with this line if anyone interested please command below ...