The morale of crude Oil bulls is strong, breakthrough!Fundamentals:
On Tuesday (March 7), international oil prices tended to fluctuate.Previously, the UAE's withdrawal from the Organization of Petroleum Exporting Countries was proved to be untrue, and there was a need for technical correction after the surge in oil prices.And cautious investors are waiting for Fed Chairman Powell's upcoming testimony later this week.However, signs of China's economic rebound have prompted Saudi Arabia to continue to increase its prices in Asia, bringing support to the oil market.
Technical aspects:
At the daily level, after oil prices have risen for five consecutive trading days, oil prices have initially stood above the 80 integer mark. The daily line has gotten rid of the downward trend channel, and the opening of the technical indicator Bollinger band continues upward. MACD golden fork, KD stochastic indicator golden fork, technical bullish signal continues, if it can withstand the short-term pullback pressure, it is expected to continue to oscillate higher, the initial resistance is near the Bollinger band rail 82; further strong resistance is near 83, which is where the top of the box that has oscillated extensively since the end of November is located. If it breaks further, it will increase the medium- and long-term bullish signal.
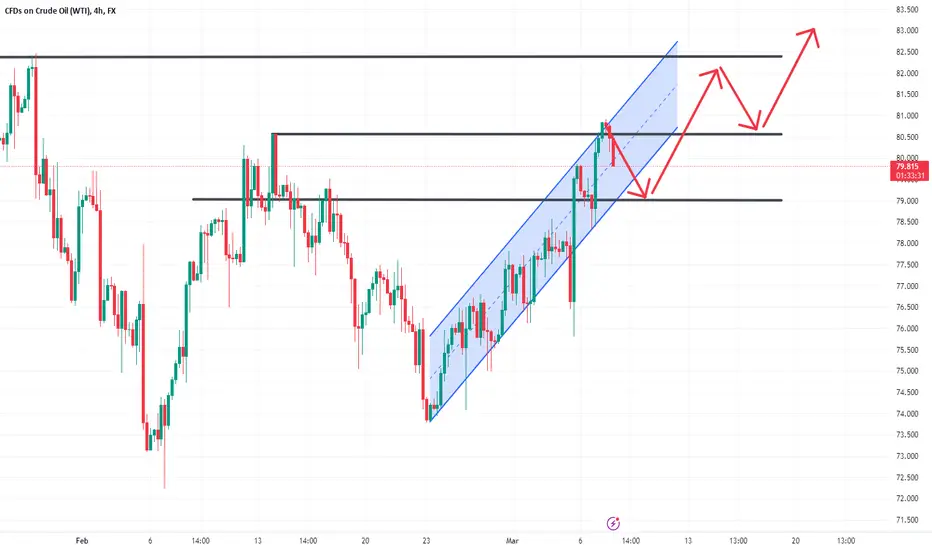
At the 4-hour level, oil prices as a whole are still in the channel of rebounding upward trend, but they are still suppressed by the short-term moving average, and the KD stochastic indicator sends a short-term overbought signal. It is still necessary to beware of the risk of short-term oil prices falling back.However, the short-term volatility here is still within the normal range, which is a technical repair to the short-term rally, and the 79 position of the 20-day moving average below has been transformed into a preliminary support position. If this position is lost, it can be judged to weaken the bullish signal in the future.
Taken together, today's short-term crude oil operation ideas are mainly based on stepping back and lower, supplemented by rebounding high altitude, which can be done at the 79 position and the target position is 80.5
Wtilong
USOIL: Long position at 79.5
Over the past two weeks, international oil prices have continued to fluctuate upwards, despite the negative signals from changes in US crude oil inventories and little impact on Russian crude oil exports from sanctions. However, these pressures have been unable to overshadow the positive impact of China's economic recovery and resilient risk appetite on oil prices.
The supply gap caused by Russian sanctions on crude oil has been a concern for investors and an important factor supporting oil prices. According to recent media reports, the CEO of crude oil trader Gunvor Group has stated that price ceilings and export bans have not interrupted Russian crude oil exports, and there is an "uncontrolled fleet" shipping Russian crude oil outside the control of Europe and the United States.
Contrary to the negative factors mentioned above, China's economic recovery is one of the important positive factors for international oil prices. Apart from immediate indicators such as the recovery of transportation observed by the market after the relaxation of epidemic prevention measures, some recognized economic data have confirmed the strong rebound of China's economy, such as the official PMI and Caixin PMI last week. Goldman Sachs previously predicted that as China's economy recovers, oil prices may return to $100 per barrel.
China's latest trade data released today showed a trade surplus of $116.88 billion for January-February, down 6.8% year-on-year, better than the expected decline of 9.4%; imports fell by 10.2% year-on-year, worse than the expected decline of 5.5%. From the sub-item data, China's crude oil imports in January-February fell by 1.25% year-on-year (about 1.07 million tons), but imports of refined oil increased by 14.4% year-on-year (about 0.67 million tons). The recent strong risk appetite has also provided support for the rise of international oil prices.
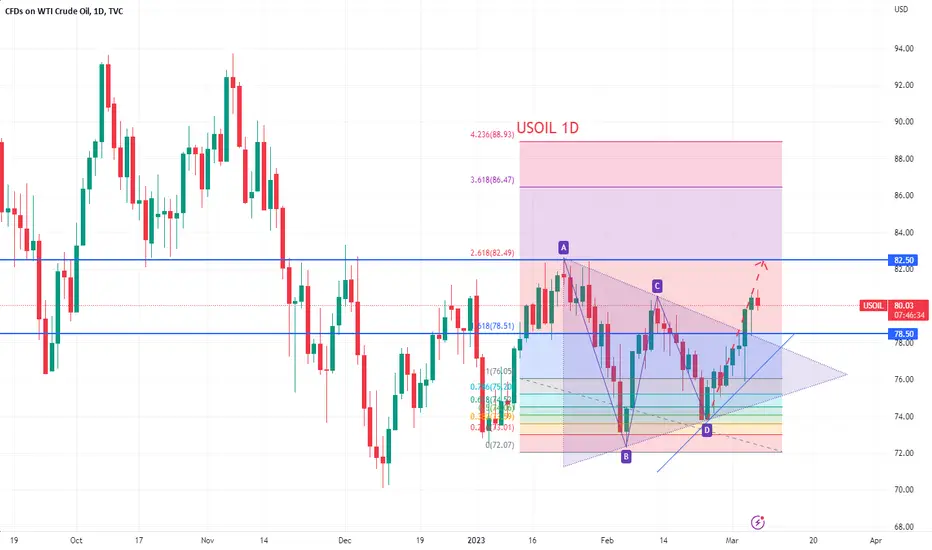
The daily chart shows that crude oil has broken through the downtrend line starting from January 27th, and after yesterday's fluctuations, it has broken through the 80 level, which may open up space for further upward movement. Although there may be adjustments during the day, if it can hold the support near the 80 level, it will maintain the prospect of further bullishness. If expectations are met, subsequent upward movements will target the recent months' high of 83 and the downward pressure line since July last year of 84.
Personal trading recommendation: Enter a long position near $79.5, with the first target at $81.5 and the second target at $82.5. Whether crude oil can effectively stand above $80 in the near future is crucial. If there are any changes in the market situation, I will update it in a timely manner. Please continue to follow my strategy and leave me a message if you have any questions. I hope this can help everyone.
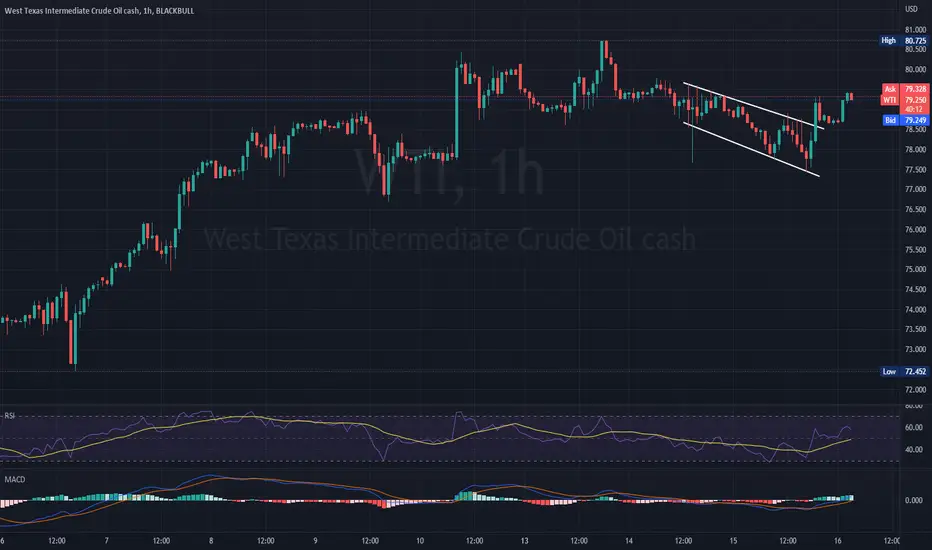
WTI BULLISH OUTLOOKUS YoY CPI came above expectations yesterday, which led to expectations of further push of the prices. Although US Oil cushion reserve came above expectations, OPEC reported declined production of the month of January, and the expectations are for further increase of global demand for the crude oil.
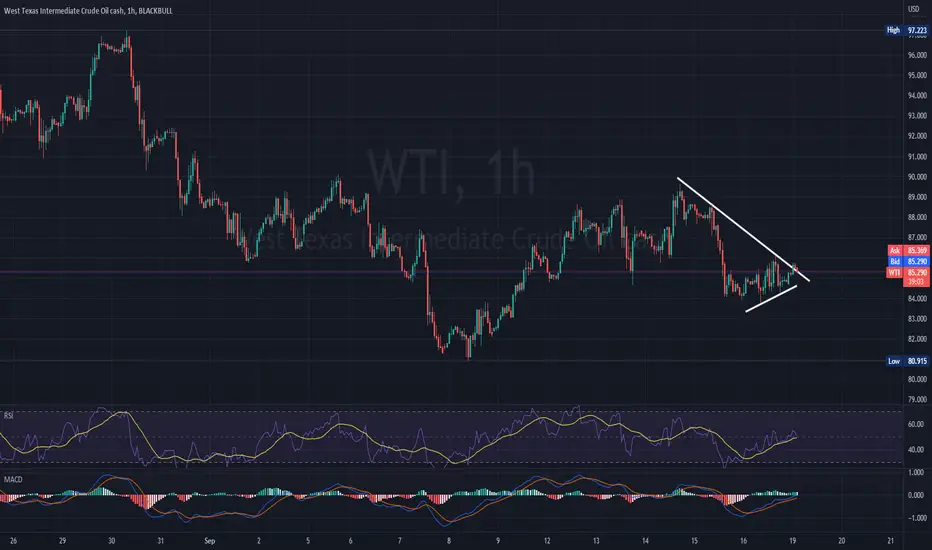
On the 1H graph the price had broke the resistance of the Flag pattern, suggesting a start of a bullish movement, where, if continues, the price might test levels of 79.63
In the opposite scenario the price might fall to levels of 79.03
Both MACD and RSI indicators are confirming the bullish scenario.
Risk Disclosure: Trading Foreign Exchange (Forex) and Contracts of Difference (CFD's) carries a high level of risk. By registering and signing up, any client affirms their understanding of their own personal accountability for all transactions performed within their account and recognizes the risks associated with trading on such markets and on such sites. Furthermore, one understands that the company carries zero influence over transactions, markets, and trading signals, therefore, cannot be held liable nor guarantee any profits or losses.
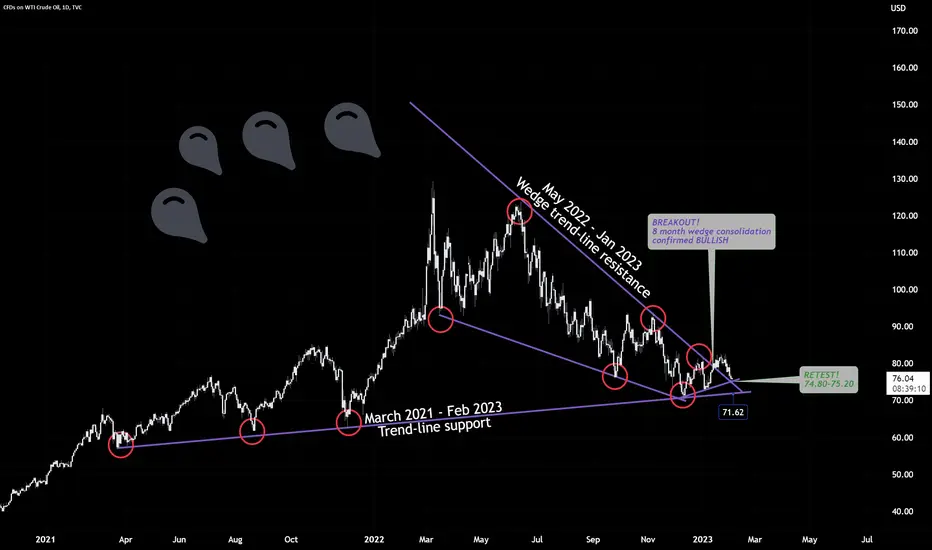
Oil's long term re-test before upcoming rally? 13.2.2023Simple 1+1 equals 2.
There's a couple factors here.
1) Long-term support since March 2023 kept with multiple re-tests.
2) Long-term 8 month wedge consolidation with recent Jan 2023 breakout up together with RETEST of that breakout at 74.80-75.20 as of today.
If the week closes above this support, VERY high chance for continuation of breakout up and 80's-90's even 100 to be reached within coming weeks.
If the support of 74.80-75.20 breaks down, retest of long-term March 2021 to today support trend-line is possible at 71.40-60.
-------------------------------------------------------------------------------------------------------------------
I encourage to do your own research and trade with caution
Thank you for reading and would very much appreciate your comments and questions!
------------------------------------------------------------------------------------------------------------------
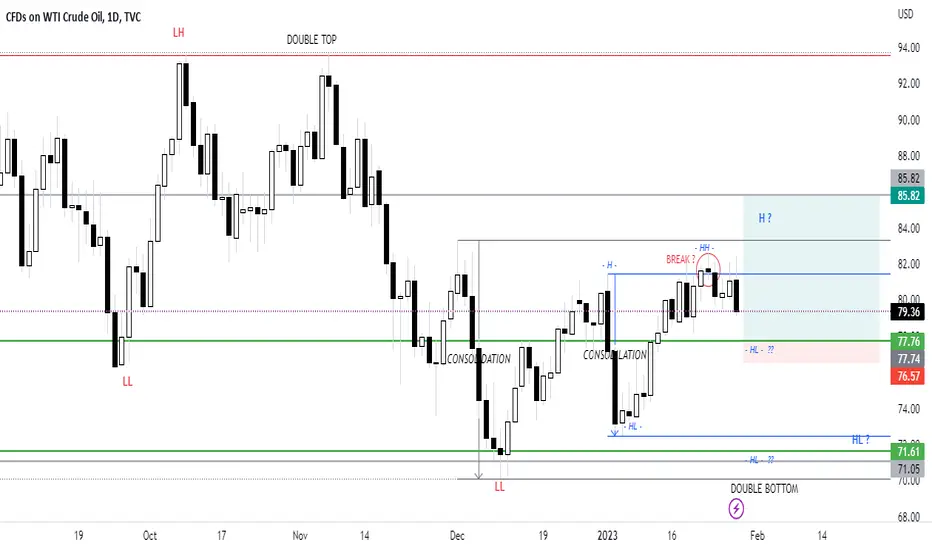
USOIL WEEKLY TRADEHello
Last week's price broke the level of consolidation at 81.44, so let's see if 77.76 will hold or if it will drop to 71.
Share your thoughts
My trading strategy isn't intended to be used as a signal service. It's a process of gaining knowledge of market structure and improving my trading abilities.
Like and subscribe and happy trading to all
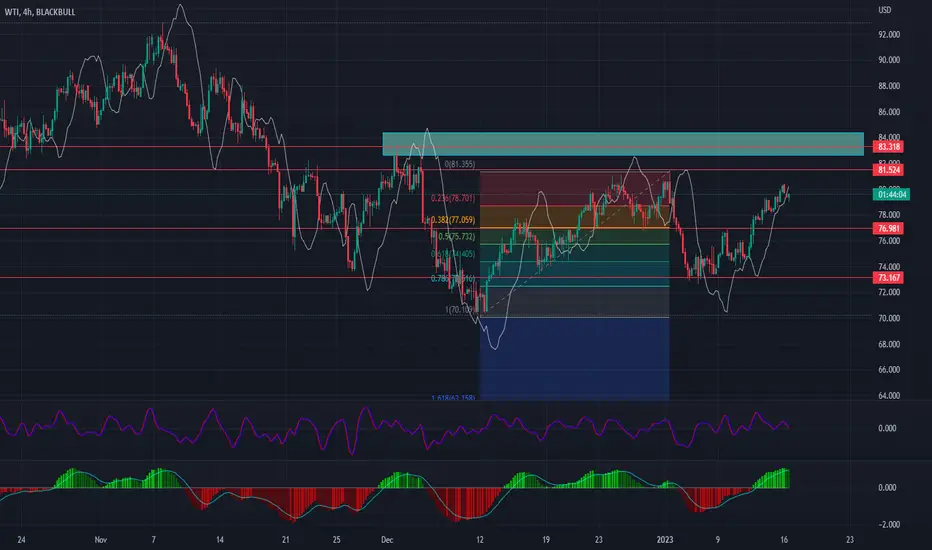
WTI: CRUDE OIL TREND OUTLOOKLet's look to Wti.
It moved up in the past weeks. But I think that trend is weakening and downside movement is possible soon.
Because, Crude Oil is reaching to strong level - 83.83!
What should we do in this case?
1. Place sell stop order at 81.52
2. First target is 76.98
3. Second target is 73.16
4. Stop Loss is necessary at 83.50
But if it will continue upward movement? Then, we need place buy stop order also:
1. Open buy stop at 83.65
2. Target is 86.98
3. Stop is 81.01
That's all for today. Let's wait and see what will be happen in next days.
Good luck!
WTI (CRUDE OIL) shortterm forecastHi dear traders.
WTI (Crude OIL) created nice trend channel started from 73.37. Upper border of the channel is 75.60.
Although, oil prices is moving between these prices from 16 December, as soon as it will jump to 77.55 level.
This is my private opinion and this is good opportunity for buyers.
Signal characteristics:
WTI will move down firstly, then possibly impulse here. Small impulse will reach to 76.29. Then will come retracement. It will retest 75.80-76.00 secondly.
As a resut, second impulse will take us to target.
Of course, we need entry, take profit and stop loss levesl for signal:
ENTRY: 75.62
TP 77.50
SL 74.25
Signal can reach our target during this week. Do not forget to put Stop Loss because trading without SL is gambling only. This will be non-professionalism.
Good luck and follow us ))

TRADE THE OPEC CHANNEL - LONG & SHORTI've done a full blown video on the analysis of this trade see my idea links below and the ideas behind the pin bar reversal price action training chart (how to enter the trade).
We're in a downtrend so this possible reversal so i recommend a smaller risk trade,
Beginners - Take profits on the way up after taking T1, move T1 and T2 your stops to zero (No risk)
Advanced - leave your stops alone, you know this thing could reverse back and bouce up, like it did Friday 25th Nov.
The buyers are in our favour on a move lower into the SPR and OPEC buying zone.
Take profits at T1 and let the rest of the trade run up to T2 and T3
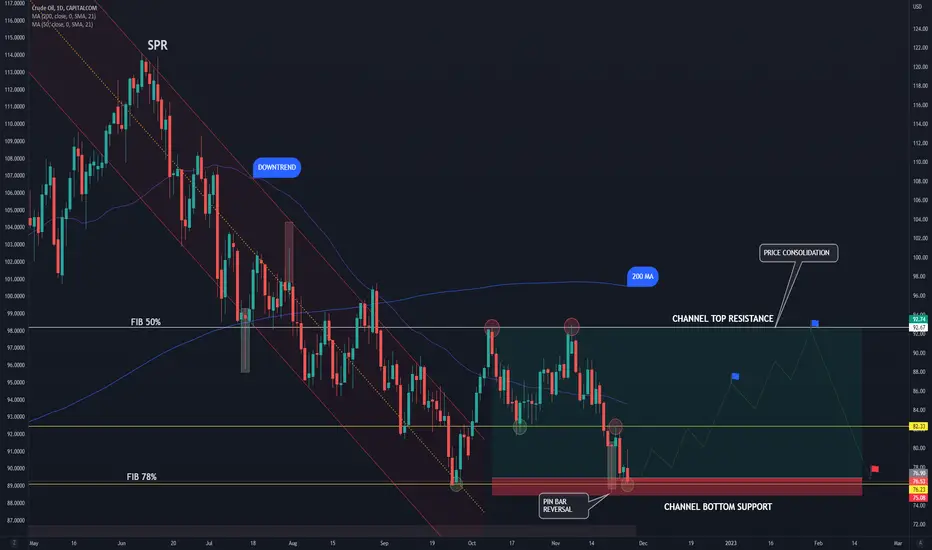
How to profit from Crude Oil - LONG (and short) The USA is in a political battle over the price of oil with OPEC and right now they are winning, but how low can they go? Not too much lower actually, they need to start buying again to ensure their strategic reserves remain useful and not at risk of dropping below the requried levels to support the country in times of emergency.
OPEC $64 - To ensure OPEC break even on oil product, they will control the market above
SPR $72 - To replenish the reserves the USA is a buyer at $67 - $72 a barrel, not too far from where we are now
EU $70 - The EU are in talks to ensure Russian oil cannot be sold above $70
Pin Bar $77 - We have a bin bar rejection to support the market move North again
Fib 78.6% - We've rejected this level 7 times on the weekly and daily chart
Target 1 - We've already tested and profited from this move upto $82 and we'll be doing that again
Target 2 - Fib 61.8% at 88 will be our next target
Target 3 - Fib 50% at 92 will be our final target
Short - If we break down past 77, we'll be a buyer just below at the SPR support levels.

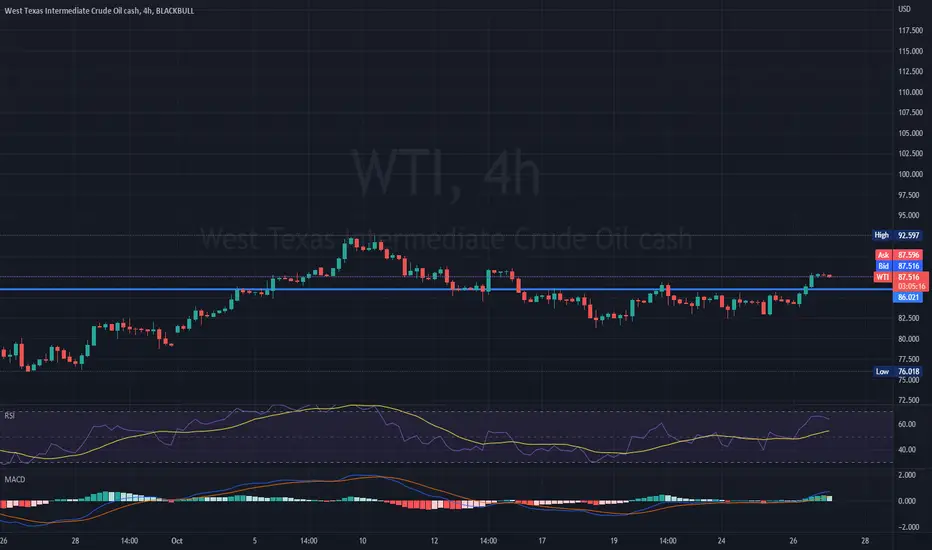
CRUDE OIL EXPECTED RALLYRising US crude exports, indicator for increased demand, and weakening of the dollar helped for a price surge of WTI, which broke and close above the 12 days formed resistance on the 4H graph.
The technical indicators are also suggesting a bullish movement, with MACD histogram above 0 line and rising and RSI above 50 neutral line.
If this movement continues, the price of the instrument might try to reach levels of 93.8, but in the opposite scenario the price might test its previous support at 82.7
Risk Disclosure: Trading Foreign Exchange (Forex) and Contracts of Difference (CFD's) carries a high level of risk. By registering and signing up, any client affirms their understanding of their own personal accountability for all transactions performed within their account and recognizes the risks associated with trading on such markets and on such sites. Furthermore, one understands that the company carries zero influence over transactions, markets, and trading signals, therefore, cannot be held liable nor guarantee any profits or losses.
LONG WTI OILWTI is ready to start another bullish move after break bearish trend line.
This zone is cluster of 0.786% fibo ret, 100% exp and 200% ext.
Trade safe guys.
Good luck.
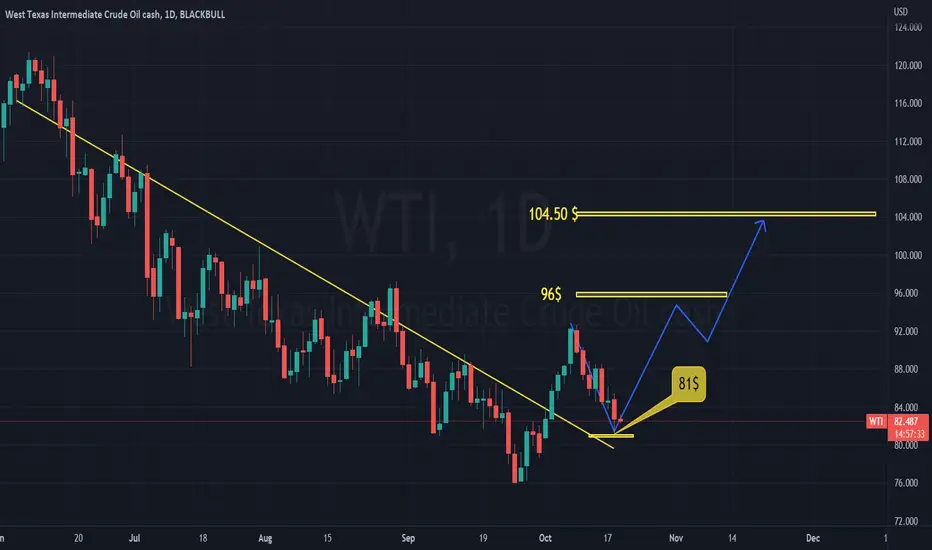
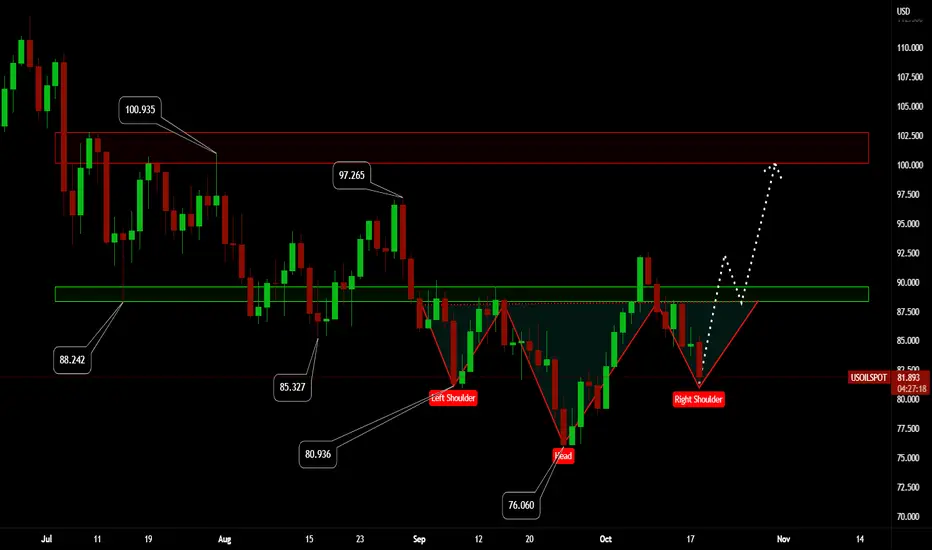
Buy WTIGood day everyone! Don't forget to put your thumbs up and write comment if you like the idea
📈 #WTI (Texas Oil)
Oil on the D1 timeframe forms a reversal pattern "H&S" after the formation of the right shoulder of the figure and the breakdown of the resistance neck line, I will consider Long with targets of $100 per barrel
DISCLAIMER:
The opinion of the author may not coincide with yours! Keep this in mind and consider in your trading transactions before making a trading decision.
WTI BULLISH OUTLOOKWTI increased in value in the start of today's Asia session, following a weakened US dollar and the news that China is easing the COVID lockdowns, which will most likely boost the economy of the second largest energy consumer.
On the technical site, the instrument broke the resistance of the triangle pattern, MACD histogram is above 0 line and RSI indicator is above the neutral 50 line.
If the trend continues, the price might reach levels of 88.5, on the other hand, if trend reverses, the price might test its previous support at 83.8
Risk Disclosure: Trading Foreign Exchange (Forex) and Contracts of Difference (CFD's) carries a high level of risk. By registering and signing up, any client affirms their understanding of their own personal accountability for all transactions performed within their account and recognizes the risks associated with trading on such markets and on such sites. Furthermore, one understands that the company carries zero influence over transactions, markets, and trading signals, therefore, cannot be held liable nor guarantee any profits or losses.
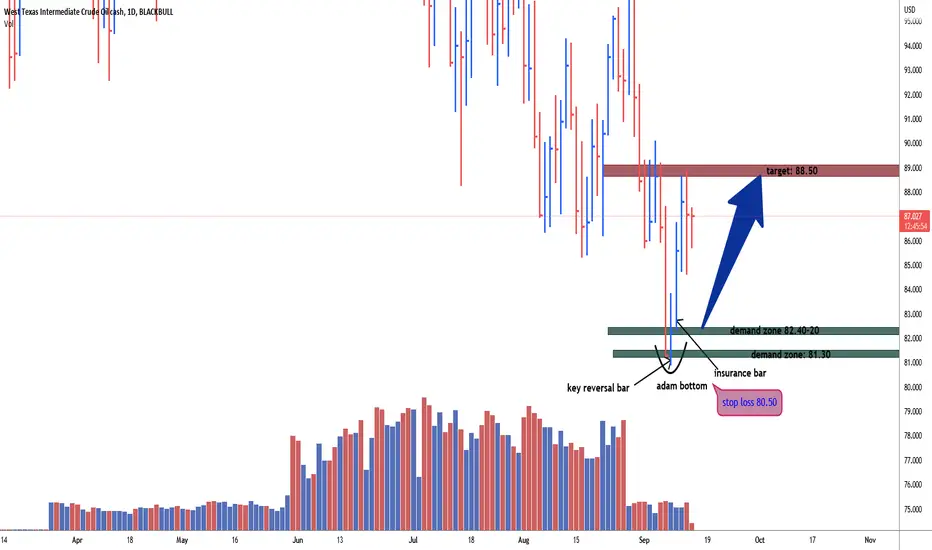
USOIL adam bottom demand zone 82.40 for long8th September daily key reversal bar, made a new low closed in the middle. 9th September daily insurance bar indication for strength ahead. high probability for long opportunity from demand zone as 82.40-20 with half risk, may use remaining half% risk from 81.30, stop loss 80.50, target: 88.50
WTI BULLISH OUTLOOKWTI rose in value in response of potential OPEC+ cuts and conflict in Libya. This possibility of supply cuts was enough to offset the effect of the strong US dollar.
WTI broke the resistance line of the ascending triangle pattern, a bullish outlook, supported as well by the RSI and MACD indicators.
The instrument might test its previous support level at 99.70, but if the break turns out to be false, the instrument might test its previous support at 94.70
Risk Disclosure: Trading Foreign Exchange (Forex) and Contracts of Difference (CFD's) carries a high level of risk. By registering and signing up, any client affirms their understanding of their own personal accountability for all transactions performed within their account and recognizes the risks associated with trading on such markets and on such sites. Furthermore, one understands that the company carries zero influence over transactions, markets, and trading signals, therefore, cannot be held liable nor guarantee any profits or losses.
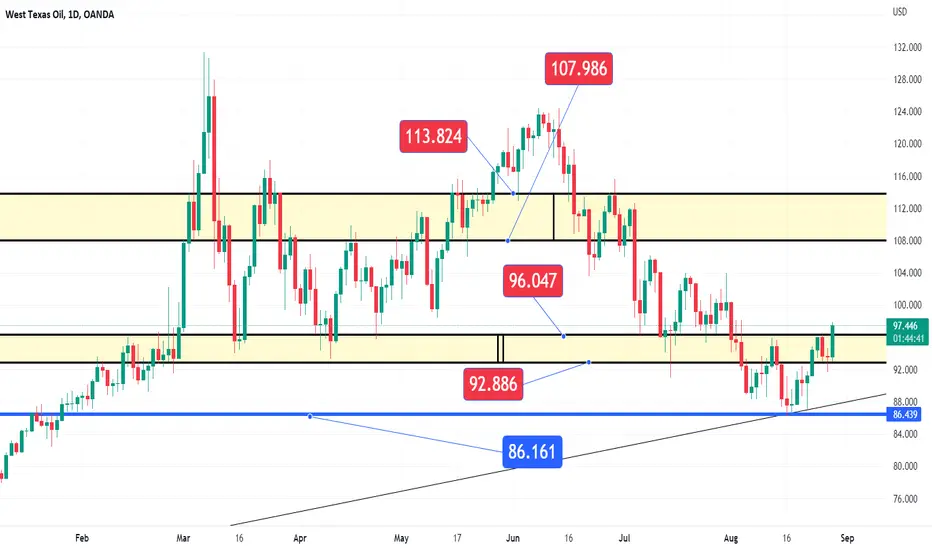
WTI - 29 Aug 2022 Considering the fact that Russian oil exports are not decreasing and Saudi Arabia is not agreeing to lower the price of oil, I expect the price to rise
USOILUSOIL LONG
DISCLAIMER: THIS IS ONLY A POSSIBILITY not a guarantee. The point of technical analysis is to understand structure and have clarity of the charts not so much predicting the chart but equip us for better reaction.
CRUDE OIL: Bullish Pin Bar SignalCRUDE OIL : Long-Tailed Bullish Pin Bar Signal
Price Action: Price formed a Long-Tailed Bullish Pin Bar Signal overnight.
The recent Bullish Tailed Bar Signal that had formed mid-last week failed (We suggested trading this signal in the July 11th members' weekly newsletter).
Potential Trade Idea: We are considering buying on a retracement lower to within the range of the most recent Long-Tailed Bullish Pin Bar Signal.

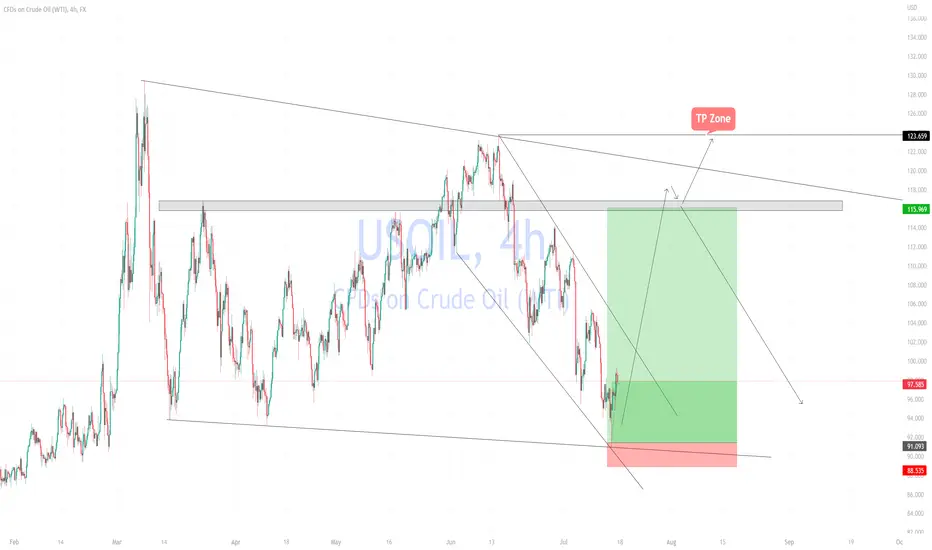
Outlook on WTI: Bearish play seen On the H4 time frame, prices are showing bearish order flow with lower lows and lower highs being formed. On the H1 time frame, a pullback to the resistance zone at 107.00, in line with the descending trend line, 78.6% Fibonacci retracement, graphical resistance level and 100% Fibonacci extension level presents an opportunity to play the drop. Our next support target at 100.20 coincides with the potential 61.8% Fibonacci retracement. Stochastic is also showing limited upside as well before it reaches resistance, in line with prices.

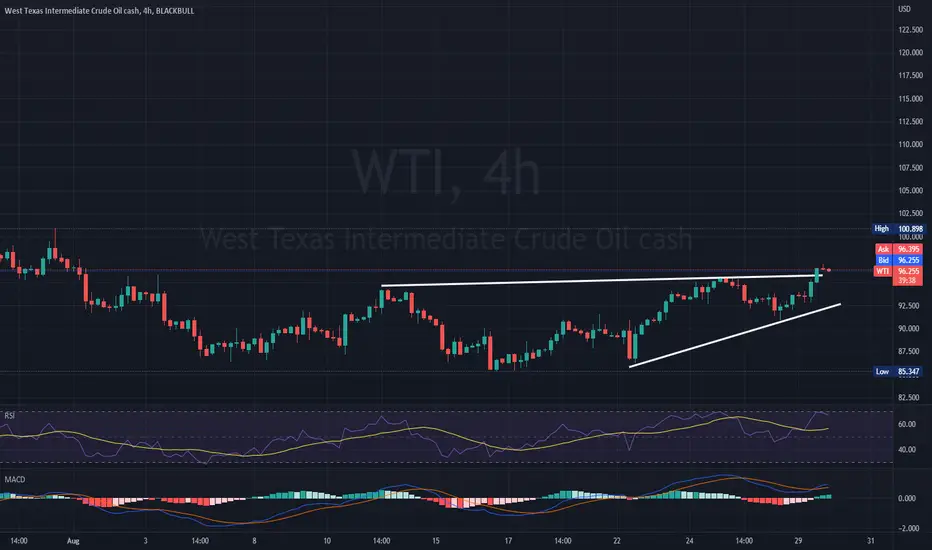
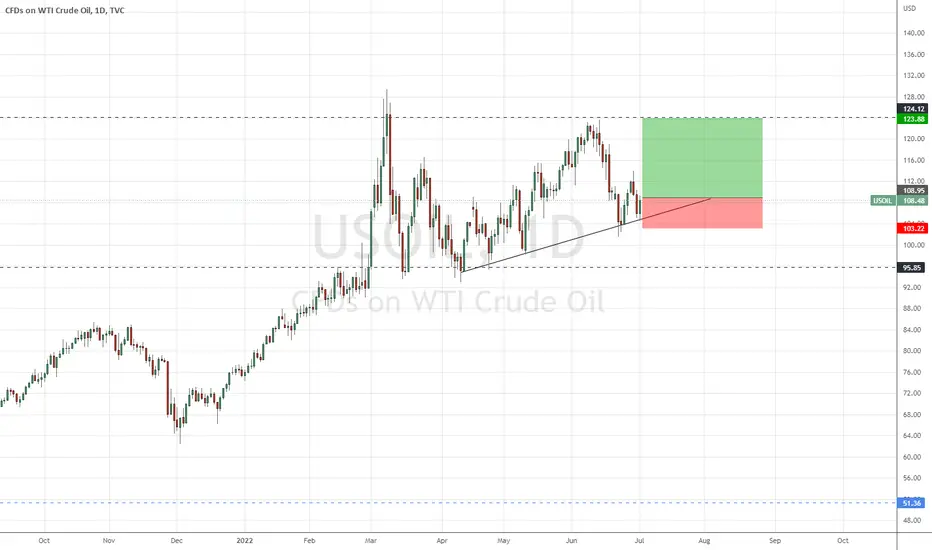
Remain Bullish?Remain bullish on oil with Friday's bullish candle bouncing from a short term bullish trendline. Entry buy stop 108.95 and target is previous swing high. R multiple is 2.6
CRUDE OIL – Futures: Buying Within The Range Of Pin Bar Signal CRUDE OIL – Futures: Buying Within The Range Of Pin Bar Signal
Price Action: Price moved slightly higher from the Bullish Pin Bar Signal that had formed late last week (We suggested trading this signal in the May 20th, daily newsletter).
Price moved higher from the recent Bullish Pin Bar Signal that had formed over a week ago (We did not consider trading this signal).
Price moved higher from within the range of the recent Bullish Tailed Bar Signal that had formed just above the $95.43 short-term support level around four weeks ago (We suggested trading the pullback to this signal in the May 1st, weekly newsletter and hopefully some traders got on board).
Potential Trade Idea 1: For more aggressive traders, we are considering buying on a retracement lower to within the range of the prior Bullish Pin Bar Signal that had formed last Thursday, May 19th.
Potential Trade Idea 2: We are considering buying on a retracement lower whilst price remains above the recent Bullish Tailed Bar Signal that had formed just above the $95.43 short-term support level.

CRUDE OIL: Bullish Pin Bar SignalCRUDE OIL – Futures: Bullish Pin Bar Signal
Price Action: Price formed a Bullish Pin Bar Signal overnight.
Price moved higher from the recent Bullish Pin Bar Signal that had formed late last week (We did not consider trading this signal).
Price moved higher from within the range of the recent Bullish Tailed Bar Signal that had formed just above the $95.43 short-term support level over three weeks ago (We suggested trading the pullback to this signal in the May 1st, weekly newsletter and hopefully some traders got on board).
Potential Trade Idea 1: For more aggressive traders, we are considering buying on a retracement lower to within the range of the current Bullish Pin Bar Signal.
Potential Trade Idea 2: We are considering buying on a retracement lower whilst price remains above the recent Bullish Tailed Bar Signal that had formed just above the $95.43 short-term support level.
