WTI OIL One last upside target. This is the signal to sell.We are updating our WTI Oil (USOIL) outlook on last week's buy signal:
Target 1 (78.50) has been hit as the price reached the Lower Highs trend-line that started on the January 27 High. If a 4H candle closes above this trend-line, you can extend buying towards Target 2 (80.00), which is where the 1D MA100 (green trend-line) is, posing as the Resistance.
We will open sells when the 4H RSI makes a Lower High. This has worked 100% on all three previous Highs of the December - February range.
-------------------------------------------------------------------------------
** Please LIKE 👍, FOLLOW ✅, SHARE 🙌 and COMMENT ✍ if you enjoy this idea! Also share your ideas and charts in the comments section below! **
-------------------------------------------------------------------------------
💸💸💸💸💸💸
👇 👇 👇 👇 👇 👇
Wtisignals

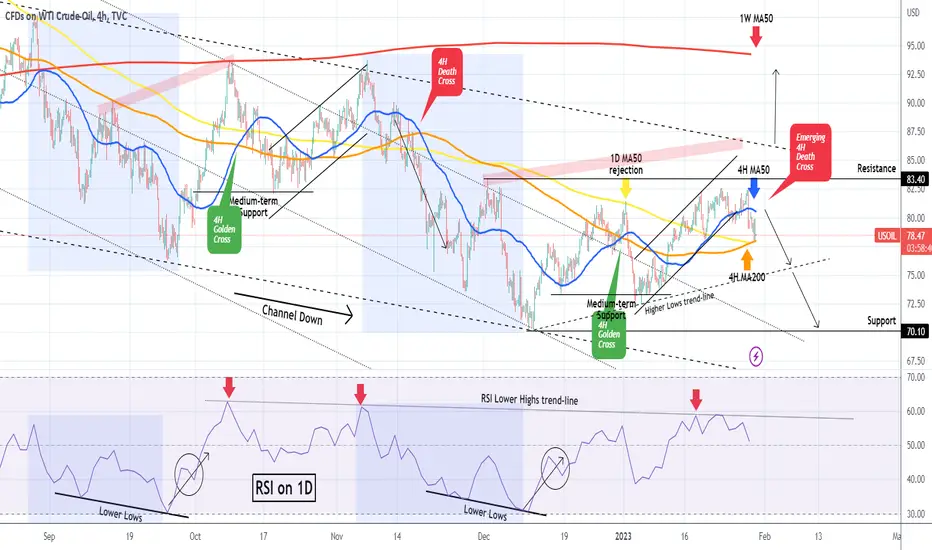
WTI OIL Bearish reversal confirmedWTI Oil (USOIL) is so far following the trading plan we presented 11 days ago, rising first towards the 83.40 Resistance and as it failed to break above it, it instead broke the short-term Channel Up downwards:
This basically confirms the bearish reversal of January's rally, with the price breaking below the 4H MA50 (blue trend-line) but at the moment finding Support on both the 4H MA200 (orange trend-line) and 1D MA50 (yellow trend-line). A new rejection on the 4H MA50 and closing below the 4H MA200/ 1D MA50 cluster, will be a sell signal for us, targeting first the Higher Lows (dashed) trend-line and the 70.10 in extension on the longer term.
Check also how the 1D RSI got rejected emphatically on its own Lower Highs trend-line.
-------------------------------------------------------------------------------
** Please LIKE 👍, FOLLOW ✅, SHARE 🙌 and COMMENT ✍ if you enjoy this idea! Also share your ideas and charts in the comments section below! **
-------------------------------------------------------------------------------
💸💸💸💸💸💸
👇 👇 👇 👇 👇 👇
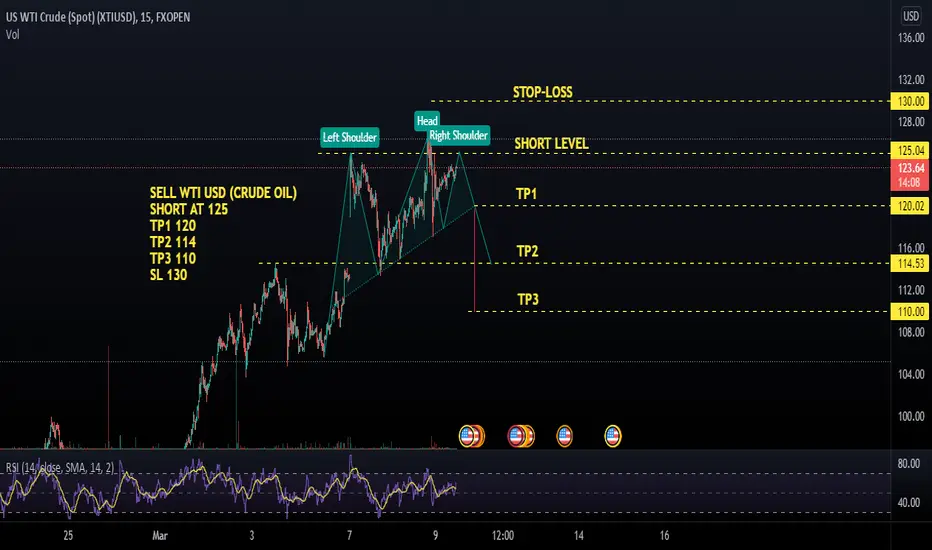
WTI: CRUDE OIL TREND OUTLOOKLet's look to Wti.
It moved up in the past weeks. But I think that trend is weakening and downside movement is possible soon.
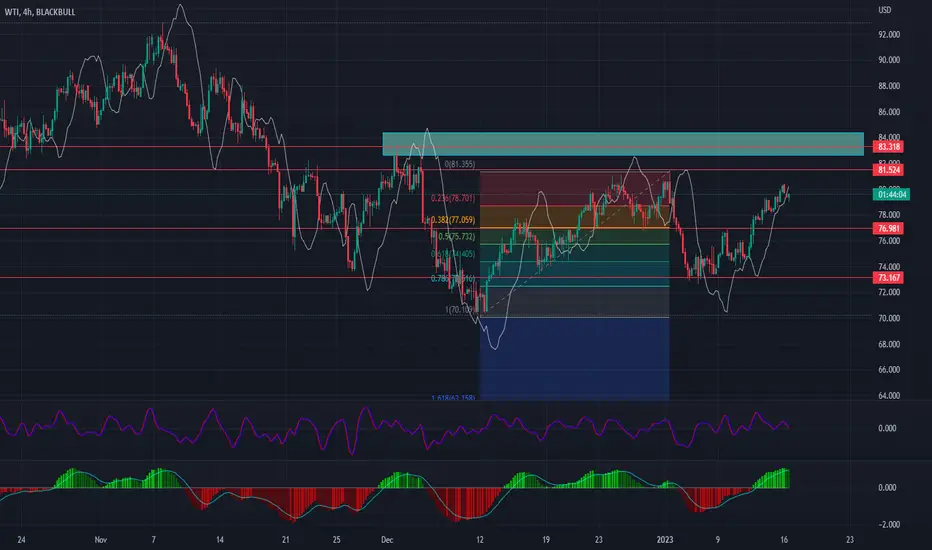
Because, Crude Oil is reaching to strong level - 83.83!
What should we do in this case?
1. Place sell stop order at 81.52
2. First target is 76.98
3. Second target is 73.16
4. Stop Loss is necessary at 83.50
But if it will continue upward movement? Then, we need place buy stop order also:
1. Open buy stop at 83.65
2. Target is 86.98
3. Stop is 81.01
That's all for today. Let's wait and see what will be happen in next days.
Good luck!
WTI or USOIL (XTIUSD): BUY analysisWe can see WTI price jumped up as our prognosis here:
Now, what will be happen?
Price tested upper level on the chart and it will not stop here or it will continue its nonstop movement.
Hereby, WTI confirms own strenght. This is very gratifying occasion for us, because we love WTI trading.
So, today WTI broke up trend channel to upward. You will see on the chart. We need draw new channel for further explanation. OIL was moving between blue-green channel and it is entering to red trend channel. I marked these channels on the chart. It tries to create a new channel by choosing the correct entry point.
What is next level?
I think that, WTI will continue own movement until it reachs to 82.35. Because, this point is keypoint and strong level also. On the technical side, this is non-breaking level. But we think that this barrier can be broken, taking into account the volatility of the oil price (of course, if there is no strong fundamental or strategic news).
You can open a BUY operation by setting a stop loss. It is possible to set 82.30-82.35 as a target. Let's trade and see what will happen in the coming days.
WTI (CRUDE OIL) shortterm forecastHi dear traders.
WTI (Crude OIL) created nice trend channel started from 73.37. Upper border of the channel is 75.60.
Although, oil prices is moving between these prices from 16 December, as soon as it will jump to 77.55 level.
This is my private opinion and this is good opportunity for buyers.
Signal characteristics:
WTI will move down firstly, then possibly impulse here. Small impulse will reach to 76.29. Then will come retracement. It will retest 75.80-76.00 secondly.
As a resut, second impulse will take us to target.
Of course, we need entry, take profit and stop loss levesl for signal:
ENTRY: 75.62
TP 77.50
SL 74.25
Signal can reach our target during this week. Do not forget to put Stop Loss because trading without SL is gambling only. This will be non-professionalism.
Good luck and follow us ))

Short OIL - BIG Swing - WHEN WTI LOSTUSOIL is at the verge of making a "terrific" decision.
I am selling and looking for a breach.
My Elliott Wave Analysis points me towards a Intermediate (C) wave.
Comment or DM on this.
P.S. It's that "sinking Titanic".

USOil | New perspective for the week | Follow-up detail3 days into the EU ban on Russian seaborne crude imports, oil producers in Russia are going against all expectations to ramp up production in recent weeks. With the Russian seaborne crude oil import ban around the corner, a potential OPEC+ output cut on the table, and ongoing discussions about capping Russian oil & gas prices, we looked at the charts from a technical perspective in this video to decipher how the recent developments will affect price movement in the coming week(s).
Disclaimer:
Margin trading in the foreign exchange market (including commodity trading, CFDs, stocks, etc.) has a high risk and is not suitable for all investors. The content of this speculation (including all data) is organized and published by me for the sole purpose of education and assistance in making independent investment decisions. All information herein is for your reference only and I take no responsibility.
You are hereby advised to carefully consider your investment experience, financial situation, investment objective, and risk tolerance level, and consult your independent financial adviser as to the suitability of your situation prior to making any investment.
I do not guarantee its accuracy and is not liable for any loss or damage which may result directly or indirectly from such content or the receipt of any instruction or notification therewith.
Past performance is not necessarily indicative of future results.

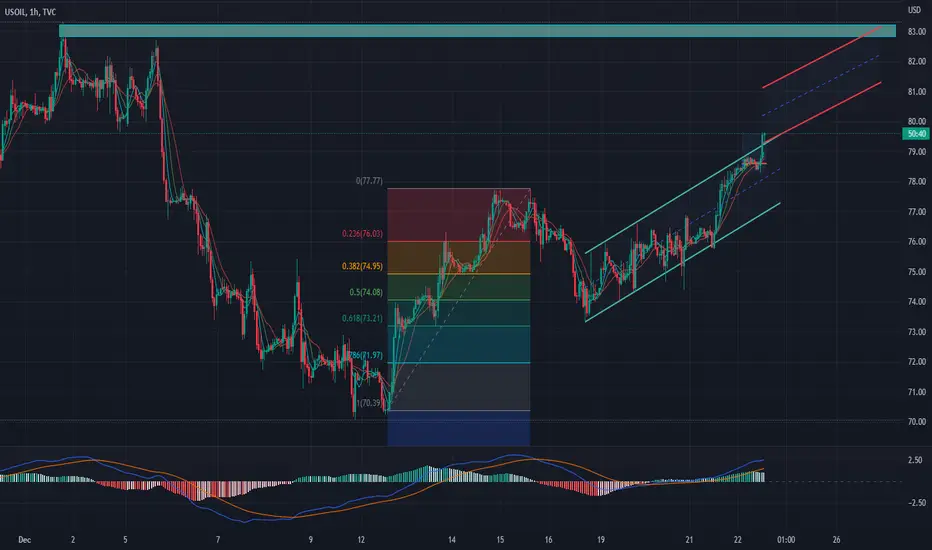
WTI OIL Near the top of the 4 month Channel Down.The WTI Oil (USOIL) rebounded on its 4H MA200 (orange trend-line) yesterday and is once again near the top (Lower Highs trend-line) of the long-term Channel Down pattern that started at the end of June.
On the short-term, it has been trading within a Channel Up (dashed lines) since the October 18 Low. Naturally, the Higher Lows on the 4H RSI draw comparisons with the August 30 - September 20 fractal, which formed a Channel Down and eventually bottomed around the 1W MA100 (yellow trend-line).
Our trading plan involves break-outs. A 1D closing above the top (Lower Highs trend-line) of the Channel Down, targets the 1D MA100 (red trend-line) on the short-term, also inside the August Resistance Zone. On the longer term, the upper Fibonacci retracement levels can be targeted once the previous breaks.
If the price breaks below the 4H MA200, a short-term Channel Down similar to that of mid September (blue) can be materialized and target the 1W MA100 again.
-------------------------------------------------------------------------------
** Please LIKE 👍, SUBSCRIBE ✅, SHARE 🙌 and COMMENT ✍ if you enjoy this idea! Also share your ideas and charts in the comments section below! This is best way to keep it relevant, support me, keep the content here free and allow the idea to reach as many people as possible. **
-------------------------------------------------------------------------------
You may also TELL ME 🙋♀️🙋♂️ in the comments section which symbol you want me to analyze next and on which time-frame. The one with the most posts will be published tomorrow! 👏🎁
-------------------------------------------------------------------------------
👇 👇 👇 👇 👇 👇
💸💸💸💸💸💸
👇 👇 👇 👇 👇 👇

WTI SHORT TERM RECOVERYWTI recovered some of its loses yesterday after expectations of supply slow-down due to the hurricane in the Gulf of Mexico. But the continuous straightening of the US dollar and the expectations of continuing slow-down of Chinese economy might decrease the demand of crude oil. This will probably put further pressure on the crude oil price. Bearish traders might take advantage of this scenario by waiting a bit for WTI to reach more favorable levels and enter into positions.
Although technical indicators on the 1H graph show "Buy" signals, on the 4H and the daily graph the indicators are still bearish, with MACD histogram below 0 line and RSI below 50 neutral line. This might indicate that the recovery is temporary and the bearish move has not finished, but just slowed down.
If bearish trend continues the price might test levels of 72 USD, but if the trend makes a more permanent reverse, it might test its previous high at 86 USD.
Risk Disclosure: Trading Foreign Exchange (Forex) and Contracts of Difference (CFD's) carries a high level of risk. By registering and signing up, any client affirms their understanding of their own personal accountability for all transactions performed within their account and recognizes the risks associated with trading on such markets and on such sites. Furthermore, one understands that the company carries zero influence over transactions, markets, and trading signals, therefore, cannot be held liable nor guarantee any profits or losses.
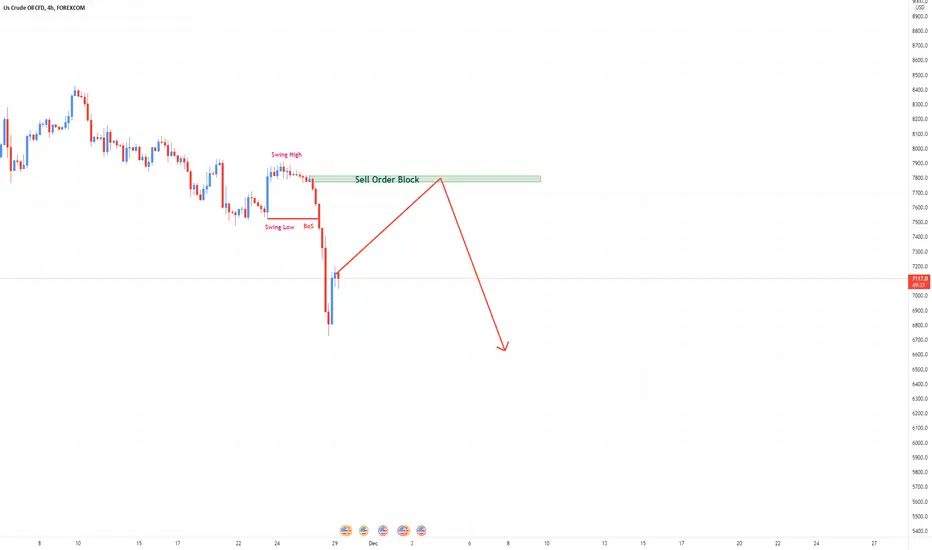
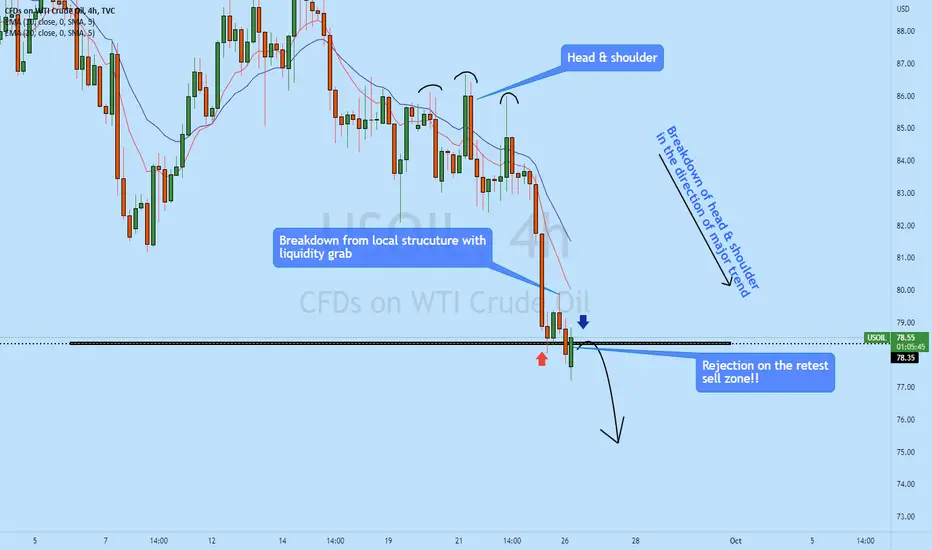
USOIL is in possible sell zone!!USOIL 4h Has broken down after creating a head & shoulder on the lower timeframe. Upon new opening, the price has formed a new bearish structure and again has broken down after a liquidity grab as soon as the market opens. Currently, price retesting the previous support as resistance on the local structure and rejecting that can give us another opportunity to sell WTI after our first successful trade as soon as the market opens.
Press the like button if you enjoy this content :)
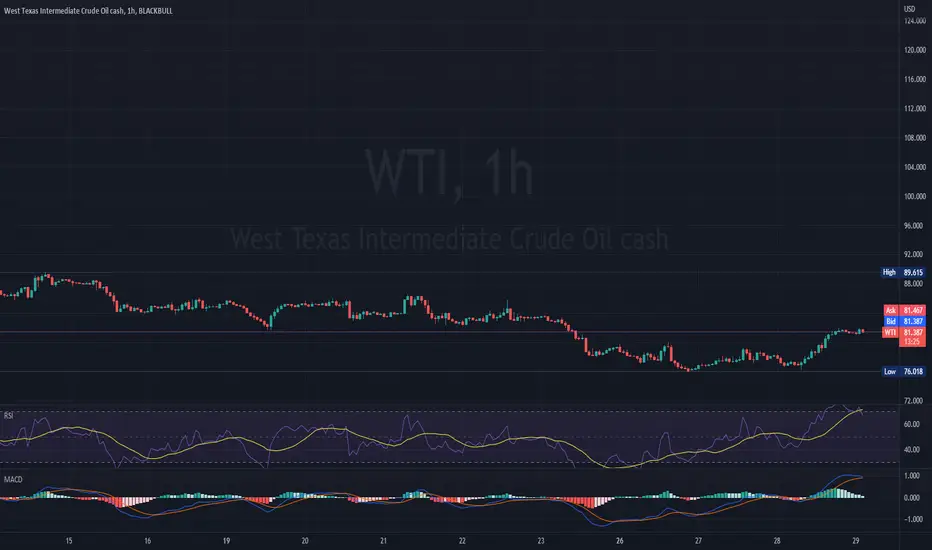
WTI DWINDLES BETWEEN HIGH RATES AND THIGHT SUPPLYWTI remains indecisive. On one hand traders are suspecting continuous increase of the interest rates, after Fed decision in Wednesday. On the other hand, the further escalation by Russia of the war in Ukraine and the thread by the Nigerian oil minister Timipre Marlin Sylva that OPEC+ will decrease production if prices keep falling, are creating fear of tightened supply.
All technical indicators are suggesting downtrend for WTI price, with MACD histogram being below the 0 line and RSI being below the neutral 50 line.
If price keeps falling, it might test its most recent low at 80.9, but if the trend reverses, it might test its resistance at 89.7 or even the one at 97.2
Risk Disclosure: Trading Foreign Exchange (Forex) and Contracts of Difference (CFD's) carries a high level of risk. By registering and signing up, any client affirms their understanding of their own personal accountability for all transactions performed within their account and recognizes the risks associated with trading on such markets and on such sites. Furthermore, one understands that the company carries zero influence over transactions, markets, and trading signals, therefore, cannot be held liable nor guarantee any profits or losses.
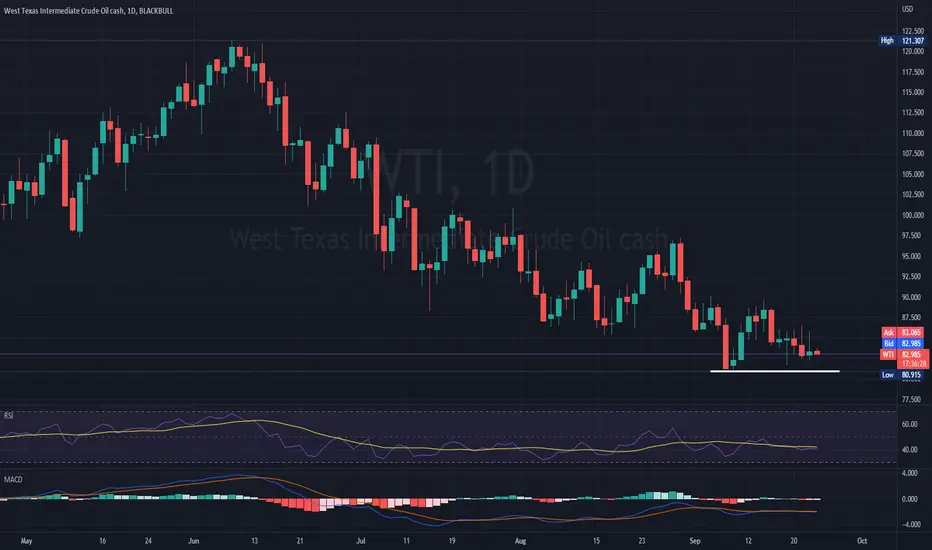
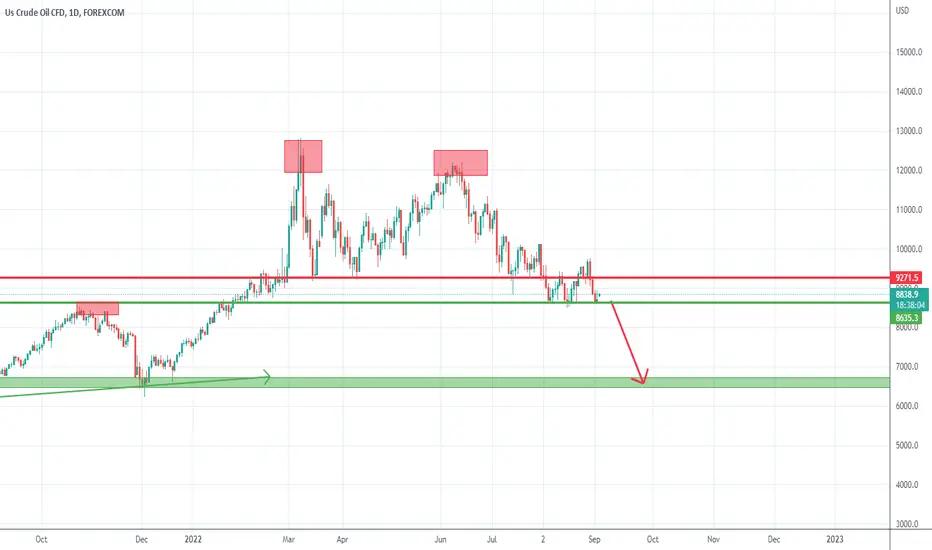
Will WTI Oil drop under 70?Since the double top marked by March and June's highs above 120, the price of Oil has started to fall and found support under 90 and under the neckline of the pattern.
Last week we have a false break above this neckline reversed with a strong bearish engulfing and Oil is trading again near 88 support (also an old resistance from Oct and Nov 2021)
The pressure seems to be on the downside and a clear break of support would confirm this outlook.
In such an instance we can have a continuation to the downside and a drop to 70 important horizontal support and also the measured target for the double top.
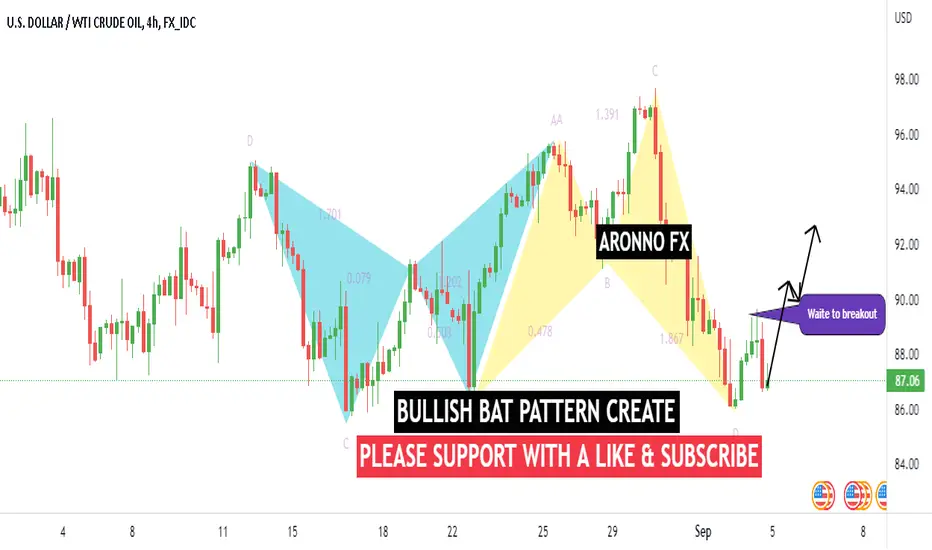
WTI Cude (OIL) WAITE TO BUY CONFARMANATION...
Hello Traders, here is the full analysis for this pair,
let me know in the comment section below if you have any questions,
the entry will be taken only if all rules of the strategies will be
satisfied. I suggest you keep this pair on your watch list and see if
the rules of your strategy are satisfied.
Dear Traders,
If you like this idea, do not forget to support with a like and follow.
PLZ! LIKE COMMAND AND SUBSCRIBE.
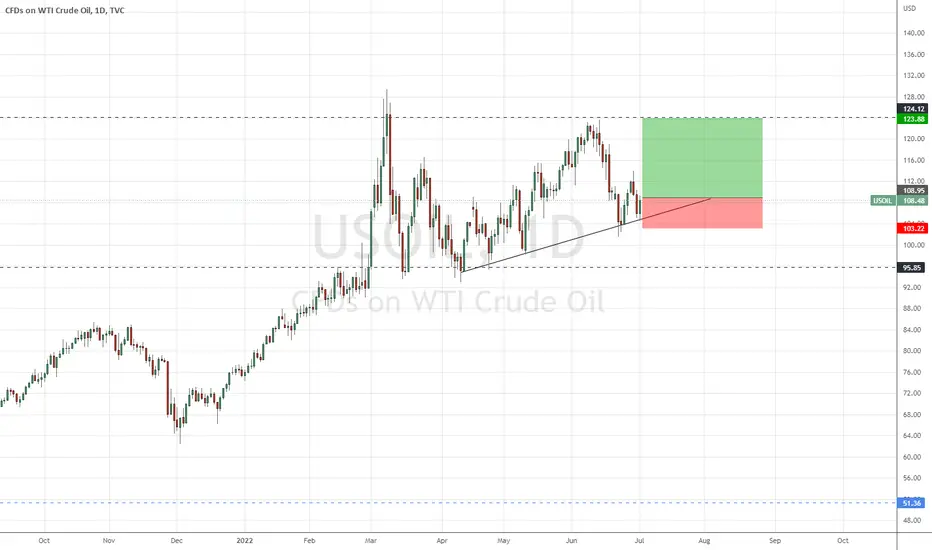
Remain Bullish?Remain bullish on oil with Friday's bullish candle bouncing from a short term bullish trendline. Entry buy stop 108.95 and target is previous swing high. R multiple is 2.6
WTI Crude Oil Hold above 21-EMAWTI on track for further downside. Bears eye cloud support at 109.23.
WTI remains on the back foot for the third consecutive session, OPEC meeting in focus

WTI OIL 1 month of scalping with 12 successful tradesAs mentioned on my last two ideas (April 19 and May 02), WTI Oil has been neutral on the medium-term where scalping was favored:
Today's analysis is on the 4H time-frame where you can see the range more clearly (Resistance at 116.60 and Support at 93.00). On this post I present the golden combination that offered 100% profitable results during this 1 month of scalping. The 4H MA100 (green trend-line) can be used as the Pivot Line. I've also plotted the Bollinger Bands (blue range).
As you see, every time the 4H RSI touched either its Resistance (sell signal) or Support Zone (buy signal), it bounced towards at least the 4H MA100 and in most cases even the top/ bottom of the Bollinger Bands before the next signal emerged.
So far this approach has given 100% success rate with 12/12 correct signals. We will continue scalping this until either the Resistance or Support level breaks.
--------------------------------------------------------------------------------------------------------
** Please support this idea with your likes and comments, it is the best way to keep it relevant and support me. **
--------------------------------------------------------------------------------------------------------

MEDIUM TERM WTI CRUDE OIL ANALYSISHEY ZEYAN HERE
Hello, zeyan. I was previously fairly bullish on oil, but as I can see now, oil prices will be settling back to below 100, with 82.50 being the next best probable position.
this is an idea a plan in a uncertain chaotic environment out of multiple plans to be certain
IF anything happens that changes the fundamentals of this idea, i will update.
please note that this is not financial advice. do your own research and use this information as conformational biase on top of your own analysis.
like for support!!!!

usoil short position h1hi
usoil can give a short position for 1:2.5 RR
but dont forget i publieshed another post for long position
check the post
carefull: this is countertrend position so just 0.5% risk involving is logical
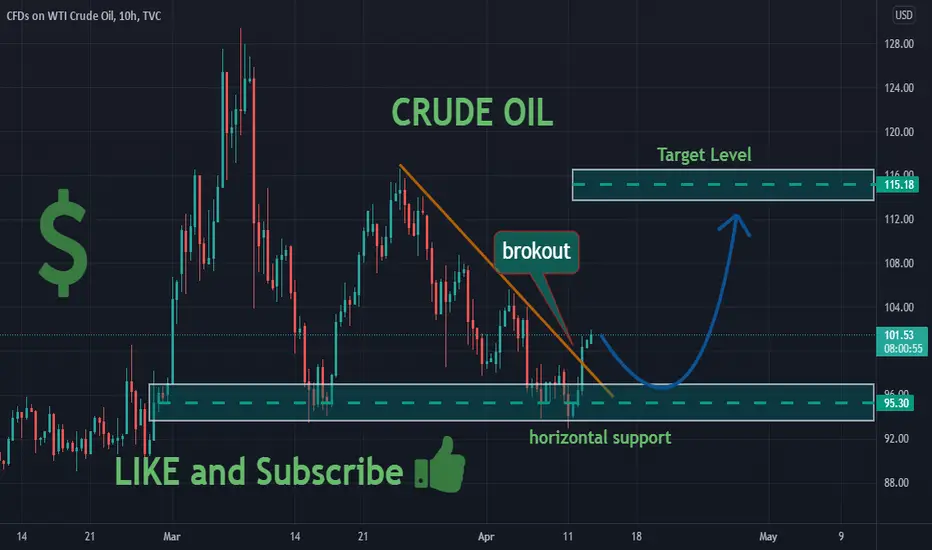
CRUDE OIL Breakout Long !!CRUDE OIL was trading in a downtrend
But then broke the falling resistance
After is retested a support level at 95.30
I think that we will see a move up
To retest the target above at 115.18
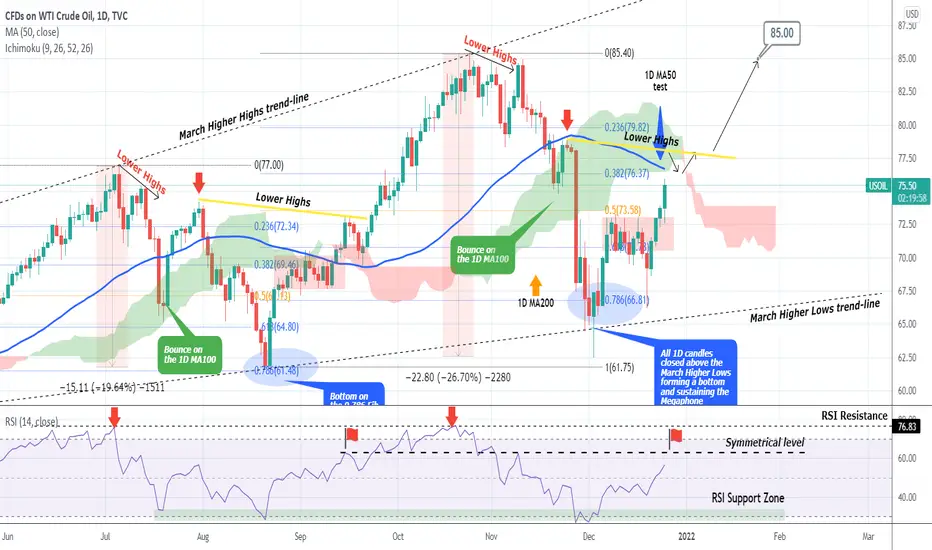
WTI OIL The important 1D MA50 testWell I've been tracking and trading the pattern you see on this chart for over a month and the very last formations have played out particularly well:
Right now WTI is ahead of the first important test of this uptrend, the 1D MA50 (blue trend-line) which is currently posing as a Resistance. If that breaks, we have a strong case of a bullish continuation. However, this the current wave is repeating that of August - September quite closely, the (yellow) Lower Highs trend-line will be critical as well, and what I am particularly looking as confirmation is a rejection there, hold on the 1D MA50 and the red Ichimoku area and then a strong bullish break-out. The RSI is so far on course for its Symmetrical Resistance of those Lower Highs. If that breaks, our next target will be $85.00.
--------------------------------------------------------------------------------------------------------
** Please support this idea with your likes and comments, it is the best way to keep it relevant and support me. **
--------------------------------------------------------------------------------------------------------
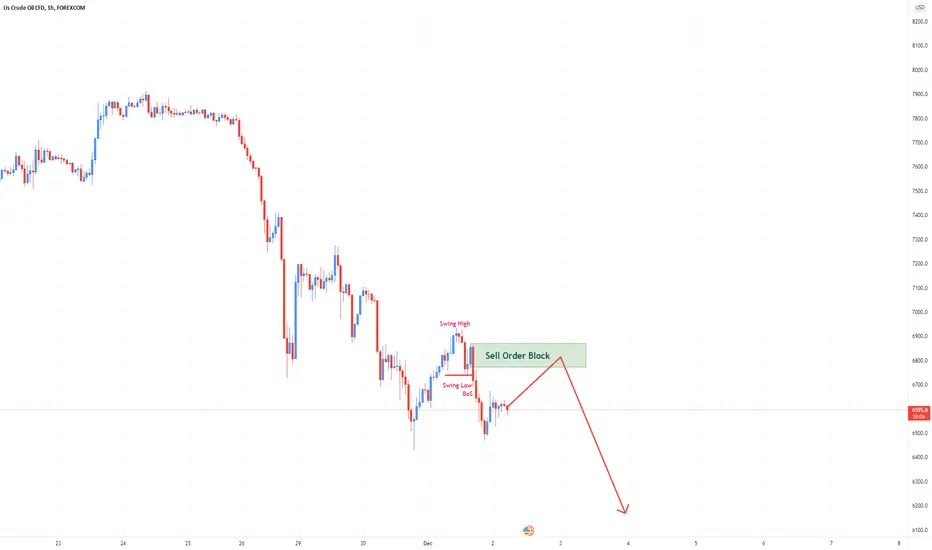
WTIUSD Pattern on H1Here's my idea for WTTIUSD. It should be going bullish. When reaching Order Block, it's your area to look out for. You can take 10R. Safe Trade!