WTI starting to recover from inflation driven plungeHello everyone, as we all know the market action discounts everything :)
_________________________________Make sure to Like and Follow if you like the idea_________________________________
Oil prices surged above $83 per barrel in volatile trading on Thursday, recovering from significant drops caused by concerns about rising US inflation, as OPEC reduced its 2021 oil demand prediction owing to high energy prices.
In a monthly report, the Organization of Petroleum Exporting Countries (OPEC) stated that it expected oil consumption to average 99.49 million barrels per day (bpd) in the fourth quarter of 2021, a 330,000 bpd decrease from last month's prediction.
Possible Scenario for the market :
The market is currently trading at $81.26 and looks like it going to the support line located at $80.17 where a battle will happen between the Bears and the Bulls over control, the outcome will probably be in favor of the bulls which will cause the market to increase in value reaching the first resistance at $84.08.
in case the demand for oil increases even more then we will most likely see a further push that could reach the $88.00 level by the end of the week.
Technical Analysis show :
1) The market is below the 5 10 20 MA and EMA indicating a Bearish Short-term movement, but still above the 50 100 and 200 MA and EMA indicating a Bullish Long-term trend
2) The RSI is at 51.61 showing good strength in the market with a small Bullish divergence that could be a sign of a Bearish short-term trend.
3) The MACD is above the 0 line still indicating a Bullish market, but it has a Negative crossover between the MACD line and the Signal line indicating a small Bearish movement.
Support & Resistance points :
support Resistance
1) 80.17 1) 84.08
2) 78.63 2) 86.45
3) 76.26 3) 87.99
Fundamental point of view :
OPEC expects global consumption to hit 100 million bpd in the third quarter of 2022, three months later than predicted last month.
On Wednesday, data indicated that inflation in the United States surged by 6.2 percent, the quickest rate in 30 years, owing primarily to increasing energy prices, which pushed the dollar higher while sending Brent and WTI oil down by 2.5 % and 3.3 %, respectively.
A surge in US oil supplies following the government's release of some critical reserves pushed up prices even further.
In reaction to rising inflation, US President Joe Biden stated he directed the National Economic Council to concentrate on lowering energy costs and the Federal Trade Commission to crack down on market manipulation in the energy industry in order to reverse inflation.
This is my personal opinion done with technical analysis of the market price and research online from Fundamental Analysts and News for The Fundamental point of view, not financial advice.
If you have any questions please ask and have a great day !!
Thank you for reading.
Wtisignals

WTI: Down, Down! 🥰Within the current setup, we are expecting WTI to fall a bit further. The goal of the current movement lays around $78.59. After hitting this area, the price should massively increase again.
Happy Trading!

WTI OIL is about to top soon. Reversal imminent.On my most recent WTI Oil idea I laid out the reason why I expected it to tun parabolic towards $82.50:
That target has now been reached and on the 1D time-frame, WTI is approaching a very strong Support cluster both on price and RSI terms.
As you see the price is close to the internal Higher Highs trend-line that connects the March 08 and July 06 Highs. Also it is approaching the 2.0 Fibonacci extension of the Fibonacci Channel that is trading on since March. This extension is key because as you see the previous Higher Highs have been rising on a +0.5 Fib interval (1.0 and 1.5). The next in line is arithmetically 2.0.
At the same time, the 1D RSI is testing the 76.30 Resistance. The July 06 High came on a RSI Triple Top. We already have a Double Top. Watch this sequence closely as a potential Triple Top may be the signal for the correction. The 1D MA50 and 1D MA200 are there to offer Support.
--------------------------------------------------------------------------------------------------------
** Please support this idea with your likes and comments, it is the best way to keep it relevant and support me. **
--------------------------------------------------------------------------------------------------------

USOIL told you exactly how the market is going to moveHello everyone, as we all know the market action discounts everything :)
_________________________________Make sure to Like and Follow if you like the idea_________________________________
On September 13 I posted an idea explaining how the USOIL was close to a breakout and that you should keep your eyes on the market for the next few days, and posted 2 Scenarios of how the market is most likely to move.
Looking at the market today we can see that the first Scenario has happened exactly as I predicted.
Over the past few weeks, oil prices have continued to proceed along an upward trajectory as commodity shortages remain a key concern for global economies. noticed that the market has brokeout the main resistance zone located between 70.40 - 70.63 and started to gain momentum that drove the price up hitting the 76.43 level yesterday, That is almost a 9% increase in 2 weeks alone
Possible Scenarios for the market :
Scenario 1 :
The market seems to be nearing the first support line located at 73.76, if the price was able to drop below and close then we could be seeing a small Bearish movement that could lead the market down to the second support at 72.89 or even below back to the main support zone at 70.40 - 70.63, where a bounce back in price will probably happen leading the price back up again to its current level.
Scenario 2 :
The Bulls are trying to gain control over the market today in hope of staying away from the support level and going back up near the first resistance level at 76.18 where a battle over control will happen and the winner will determine the outcome movement of the market, If the Bears were to win then we might see a drop to the first support at 73.76 where a bounce most likely will happen.
If the Bulls were to win then we will see an increase in price that could lead the market to the 77.73 or even the 80.74 level in the next period of time.
Technical indicators show :
1) The market is above the 10 20 50 100 and 200 MA and EMA (Strong Bullish sign)
2) The RSI is at 61.31 showing Great strength in the market, With no divergence found between the market and the indicator
3) The MACD is above the 0 line indicating that the market is in a Bullish state, With a positive crossover between the MACD line and the Signal line
Daily Support and Resistance :
support Resistance
1) 73.76 1) 76.18
2) 72.89 2) 77.73
3) 71.34 3) 78.60
Weekly Support and Resistance :
support Resistance
1) 71.06 1) 75.90
2) 67.93 2) 77.61
3) 66.22 3) 80.74
Fundamental point of view :
The price of Brent crude oil continues to soar, touching highs last seen three years ago as demand outstrips supply. The continued rollback of covid-19 restrictions in economies around the globe is driving demand ever higher with supply struggling to keep up. OPEC+ will meet next – October 4 – and they may need to increase production further to help alleviate the market shortage. Brent crude touched $80/bbl. earlier and may now set its sights on the October 2018 high at $86.65/bbl. if the OPEC+ leaves production at its levels. The Organization of the Petroleum Exporting Countries will also release its World Oil Outlook next week and this now takes on increased significance as prices rally hard. According to Dailyfx
This is my personal opinion done with technical analysis of the market price and research online from Fundamental Analysts and News for The Fundamental point of view, not financial advice.
If you have any questions please ask and have a great day !!
Thank you for reading.

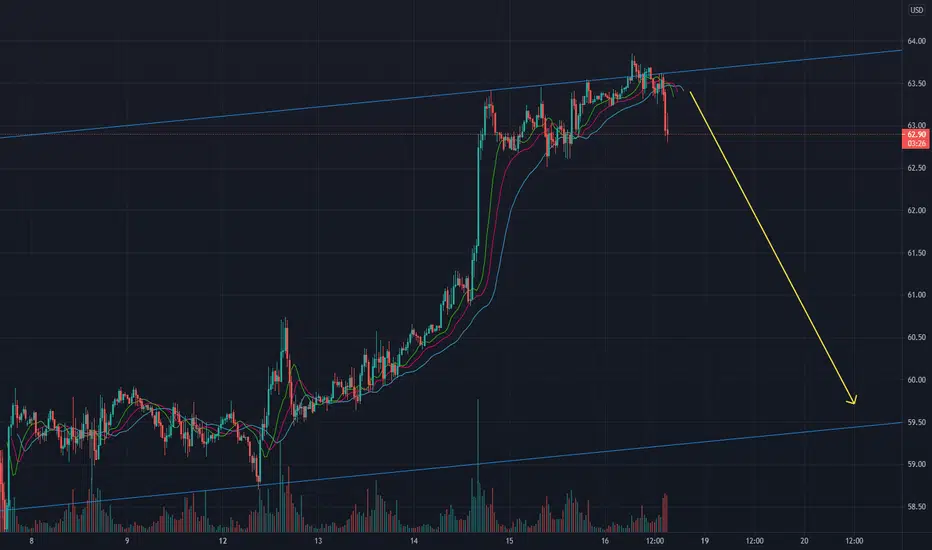
WTI Oil can correct to 70 zoneYesterday, after a short-lived spike above 76, WTI reversed strongly confirming this zone as strong resistance
A deeper correction can follow from this point and we can look to sell rallies under 76
A daily close above resistance would negate this scenario
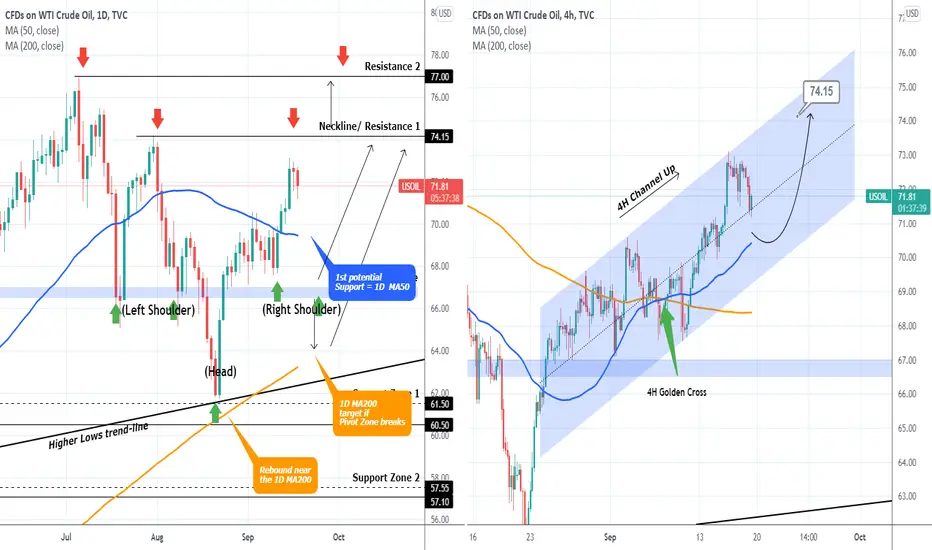
WTI OIL Inverse Head and ShouldersLast time I made a post on WTI Oil the price was still struggling to get past both a very strong Lower Highs trend-line and the 1D MA50 (blue trend-line on the left chart):
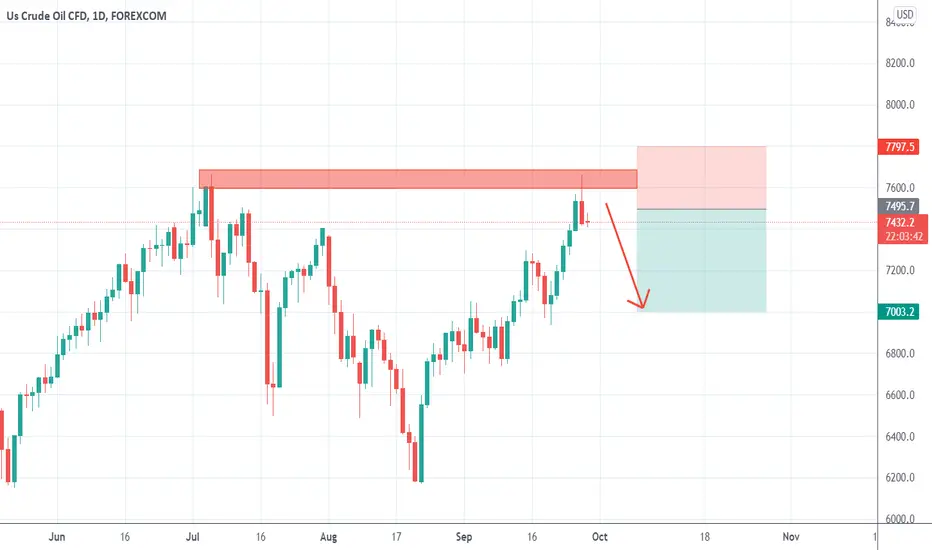
Well the price managed to break and close above both and rallied. The rejection though near the 74.15 Resistance has formed an Inverse Head and Shoulders (IH&S). Look how the Pivot Zone mentioned on the previous analysis is almost perfectly matched as the Shoulder line. Naturally, we should be expecting an initial pull-back and since the IH&S is a bullish reversal pattern, break above the 74.15 afterwards.
However we need to consider an earlier potential Support and that's the 1D MA50 which, as mentioned, was previously the Resistance since August 03. That fits well the pattern on the right side (which is on the 4H time-frame) which is a Channel Up whose Higher Lows trend-line limit is currently roughly where the 1D MA50 is.
Short-term target if the Pivot Zone holds is the 74.15 Resistance (1). Long-term target is the 77.00 Resistance (2). A candle close below the Pivot Zone temporarily sets this back to the 1D MA200 (orange trend-line on the left chart).
** Please support this idea with your likes and comments, it is the best way to keep it relevant and support me. **
--------------------------------------------------------------------------------------------------------
!! Donations via TradingView coins also help me a great deal at posting more free trading content and signals here !!
🎉 👍 Shout-out to TradingShot's 💰 top TradingView Coin donor 💰 this week ==> Vergnes
--------------------------------------------------------------------------------------------------------
WTIUSD DAILY TIMEFRAMESNIPER STRATEGY
WTIUSD Daily Timeframe
I warn you again this strategy will not predict pullbacks but it will give you huge profit at the end
Quite honestly no matter what the chart is, this strategy kills it.
Start believing
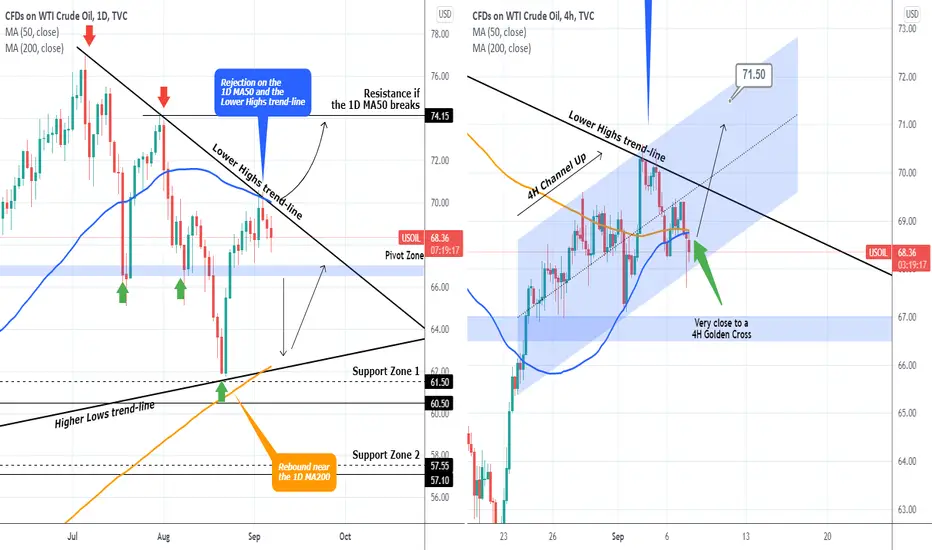
WTI OIL analysis on the 1D and 4H time-framesLast time I analyzed WTI Oil on August 24, I made it clear that it was trading within a long-term Triangle and until it broke, its price action would be sideways:
I stressed out the importance of the 1D MA50 (blue trend-line) and the Lower Highs trend-line of that Triangle. Well as you see on the chart, WTI Oil got rejected exactly on that Resistance level twice and has been pulling-back since. Until the price closes a 1D candle above the 1D MA50, the bias are towards the Pivot Zone. A 1D closing below it, sees the 1D MA200 (orange trend-line) as target, which last time held (August 20-23). That is on the left chart which is on the 1D time-frame.
On the 4H time-frame (right chart), a Channel Up has been formed, which naturally is limited by the Lower Highs trend-line (and 1D MA50) of the Triangle. The previous 4H candle, even though it broke below the Channel Up, it managed to close inside it, so as long as we close within the pattern, the short-term target is 71.50. On the long-term, as shown on the 1D chart, it is the 74.15 Resistance.
** Please support this idea with your likes and comments, it is the best way to keep it relevant and support me. **
--------------------------------------------------------------------------------------------------------
!! Donations via TradingView coins also help me a great deal at posting more free trading content and signals here !!
🎉 👍 Shout-out to TradingShot's 💰 top TradingView Coin donor 💰 this week ==> GJMRealEstate
--------------------------------------------------------------------------------------------------------
WTICOUSDhe West Texas Intermediate Crude Oil market has broken higher during the course of the trading session on Thursday as we broke above the $70 level. That is an area that I have been talking about for a while, and the fact that we broke above there is a very good sign and it is likely that we could go looking towards the $74 level. The $74 level is an area where we have sold off drastically in the past, and as a result it looks like we are going to continue to see that as important.
On the other hand, we could turn back around and go looking towards the 50 day EMA underneath, which is near the $60.75 level. That is an area that I think could offer quite a bit of support, and therefore think it is only a matter of time before the buyers would come back into that area. At this point in time, the $67 level is an area that has been support during the previous session, as well as many other days. As long as we can stay above the $67 level then it is likely that we will continue to go higher. However, breaking down below that level would open up a completely different scenario.
If we were to break down below the $67 level, then it is likely that the market would fall towards the $65 level, possibly even the 200 day EMA after that. When I look at this chart, that could very well be what happens next, but once we get past the jobs number will have a quite a bit more in the way of clarity, so therefore it is worth paying attention to how things end up at the end of the session. I feel at this point time we are at the precipice of some type of bigger move, so it is interesting to see how the market plays out at the end of the day.
The size of the candlestick is relatively impressive, although I do not necessarily think that it is an explosive move to the upside. If we can break above the top of the candlestick, then it is likely that we go much higher. Ultimately, this is a market that looks like we are going to see volatility coming soon. In that scenario, the end of the day on Friday is crucial.

Usoil Double Top Monthly pattern/likely to test the 65 handle 76.50 level monthly resistance/top looks like a strong rejection level ,profit booking like pattern has already formed after the OPEC meeting and indications are clearly visible in the weekly chart. Speculative sentiment index is around 50/50 hence we are expecting the price to drop and test the 65 handle monthly support .
Signal : Sell every rise
Target ; 65 Handle
Stop loss / Buy stop : Above 76.50

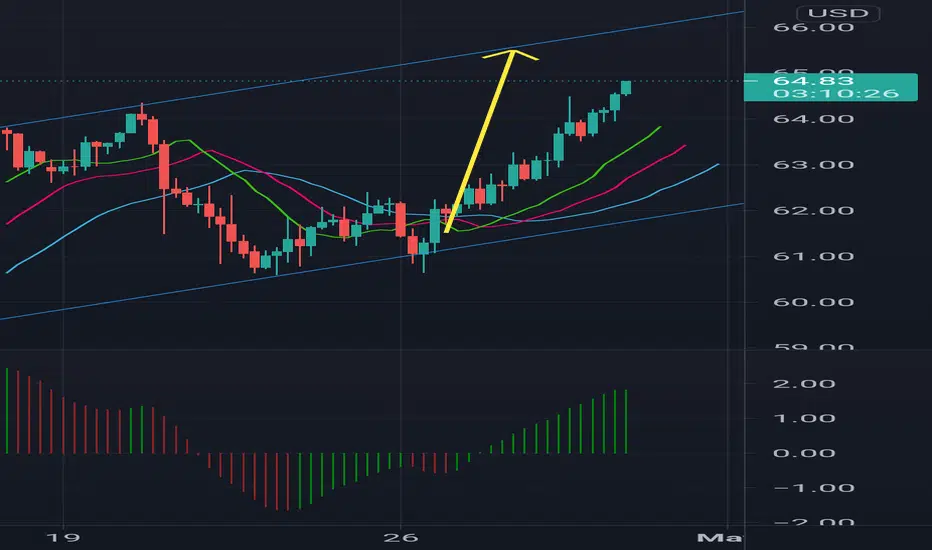
WTI OIL Getting closer to a buyPattern: Channel Up on 1D.
Signal: Buy when contact is made with the 1D MA50 (blue trend-line) or the RSI enters the long-term buy zone.
Target: 79.50 (top of the Channel).
** Please support this idea with your likes and comments, it is the best way to keep it relevant and support me. **
--------------------------------------------------------------------------------------------------------
!! Donations via TradingView coins also help me a great deal at posting more free trading content and signals here !!
🎉 👍 Shout-out to TradingShot's 💰 top TradingView Coin donor 💰 this week ==> ridethepig
--------------------------------------------------------------------------------------------------------

WTI Oil : 73.75-76 level possible short term target ?Seems like a clear upside break out with a short term support near 67 handle ( previous resistance) + SSI is around 30% on an average
Trend : Bullish
Signal : Buy @ 68.50 (weekly pivot) , Buy limits above 64.25 - 66.00 (Supports)
Strategy : Split positions
Target : 73.75 - 76 Handle
Stop Loss : Manual close / Parallel position below 64

WTI Oil : Upside break out is possible targeting 72-74 Handle As of now trading around 67 area with speculative sentiment index around 20% hence an upside break out is highly possible targeting the 72+ levels coming weeks . However, considering the trade on the last day of month + price around the range top , You can try putting sell limit orders 100-150 pips above the 67 top although success rate will probably very low as the HERD is in mass selling mode.
Trend : Up
Pattern : Possible upside break out
Signal : Buy Dips
Target : 72-74 handle
Trade to try : Sell limit @ 68-68.50
Stop Loss : 69
Target : 63-64
Accuracy : Less than 50%

WTI Oil : Stop Hunt /HH to 67.80 -68.20 handle possibleAfter the stop hunt /HL around 61.65 ,Price returned to the old daily range 63.50-67 indicating it will continue to trade inside the range or an upside break out since the SSI is around 25% and every dip is bought strongly .
Trend : Range
Signal : Sell Limit 67.80-68.20
Stop Loss : 68.75
Target : 65-63.75

WTI Crude Oil.. Analysis..Crude oil is one of the most in-demand commodities, with the two most popularly traded grades of oil being Brent Crude and West Texas Intermediate (WTI). Crude oil prices reflect the market’s volatile and liquid nature, as well as oil being a benchmark for global economic activity. The oil price charts offer live data and comprehensive price action on WTI Crude and Brent Crude patterns. Get information on key pivot points, support and resistance and crude oil news.
Daily Classical Pivot Points. Last Updated: Apr 25, 2021
WTI Crude Oil..Wait for sell..Trade At Your Own Risk (TAYOR)Decending triangle.. Wait untill break below triangle..
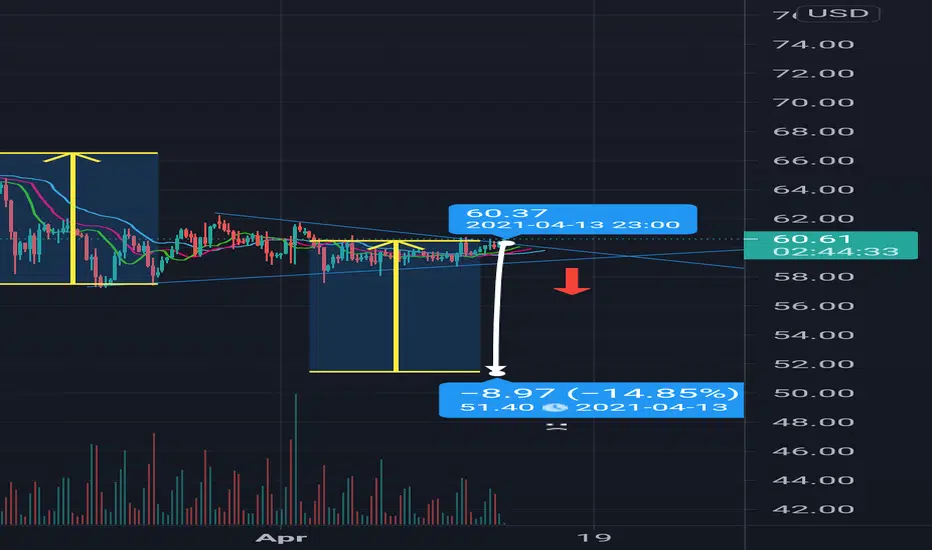
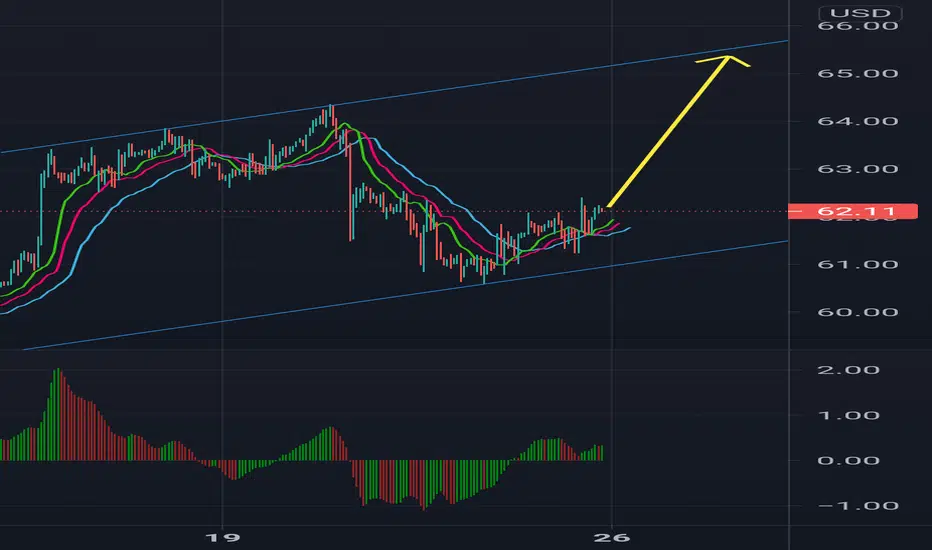
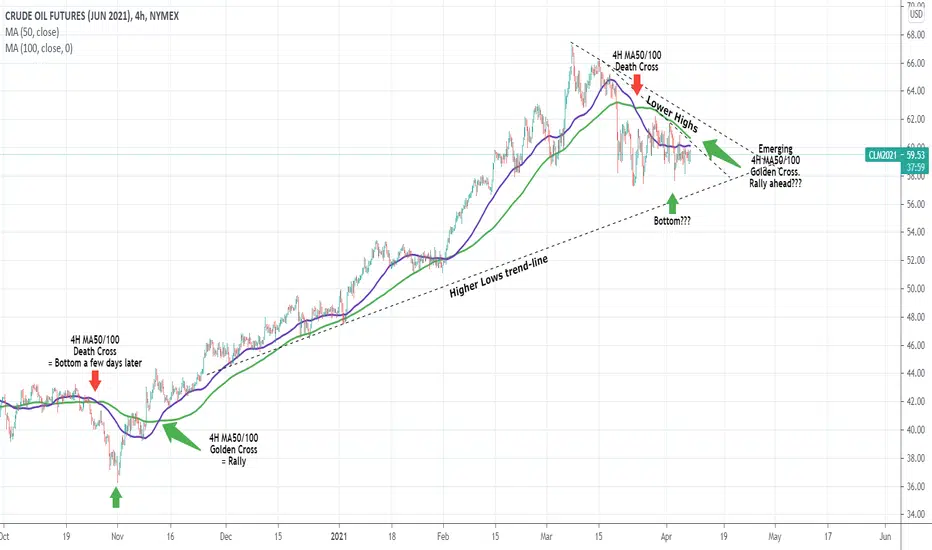
WTI OIL Emerging 4H MA50/100 Golden Cross. Rally ahead?Simple fractal comparison on WTI as the price is consolidating since the March 23 low and is approaching the Higher Lows trend-line that started on December 01.
As you see the current price action is quite similar to the late October - early November one. After the 4H MA50 crossed below the 4H MA100, a bottom was formed a few days later. Once the two crossed again on a Golden Cross this time, the very aggressive rally of December - March was initiated. We are on a similar situation right now. Has the March 23 MA50/100 Death Cross priced the Bottom? And if yes will an emerging MA50/100 Golden Cross kick-start a rally?
** Please support this idea with your likes and comments, it is the best way to keep it relevant and support me. **
--------------------------------------------------------------------------------------------------------
!! Donations via TradingView coins also help me a great deal at posting more free trading content and signals here !!
🎉 👍 Shout-out to TradingShot's 💰 top TradingView Coin donor 💰 this week ==> hujianghua
--------------------------------------------------------------------------------------------------------
WTI OIL should avoid this fractal at all costs.I don't call it Fractal of Doom for nothing. As you see WTI Oil hit the 2 year Resistance trend-line (red zone) that was first created on the April 23, 2019 High, and got strongly rejected on March 08, 2021. This is a Triple Top (counting the Jan 08, 2020 almost hit). A common characteristic of all three rejections is that after the initial drop, the price consolidated (orange rectangle) around on the 1D MA50 (blue trend-line). On the first 2 occasions, a bigger fall took place after this consolidation. Will it happen again this time?
It is worth pointing out also the important of the 50.00 - 51.00 zone (blue) as a long-term Support. It didn't only hold from January 2019 to January 2020 (broke due to the COVID pandemic) but also on January 2021. If the bigger fractal fall comes after the current consolidation, will that (blue) Support Zone hold again and cause another lengthy sideways period between this and the (red) Resistance?
I am really interested to read your opinions on it.
P.S. See the RSI similarities
** Please support this idea with your likes and comments, it is the best way to keep it relevant and support me. **
--------------------------------------------------------------------------------------------------------
!! Donations via TradingView coins also help me a great deal at posting more free trading content and signals here !!
🎉 👍 Shout-out to TradingShot's 💰 top TradingView Coin donor 💰 this week ==> xBTala
--------------------------------------------------------------------------------------------------------

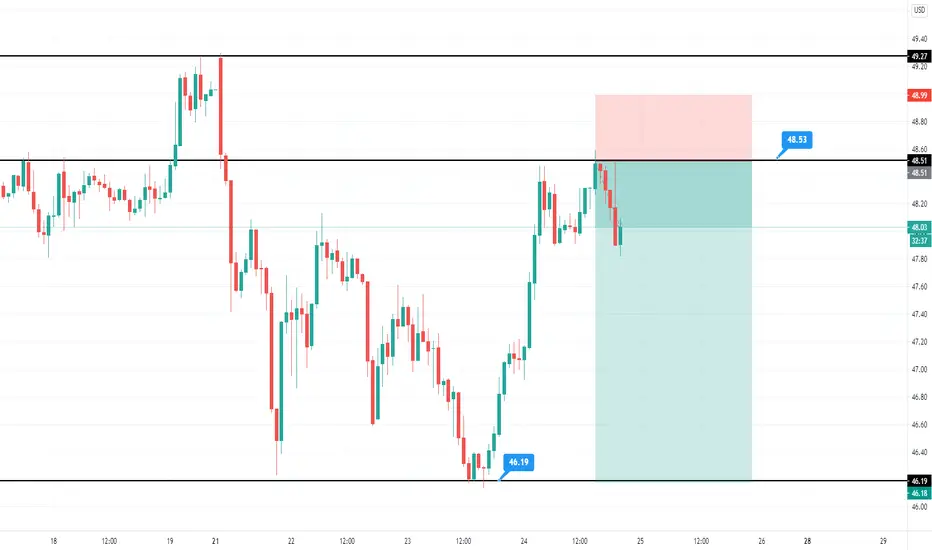
SELL WTITP : 46.18
SL: 48.99
Hello everyone and thank you for your support on our page and supporting. We wish everyone a happy Christmas and a Happy New Year
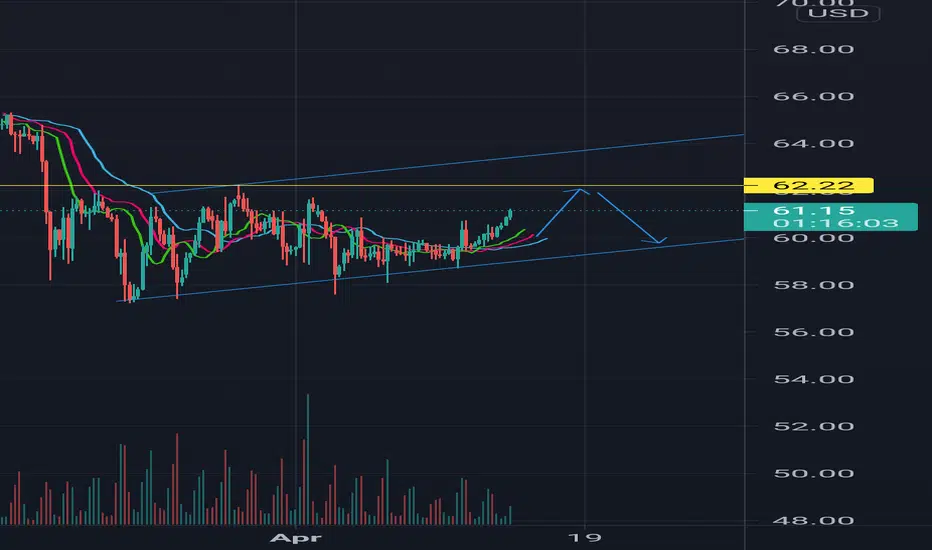
WTI OIL Are we repeating May's Channel Up? Slow rise to $55?This is a strange but quite interesting fractal I found as I was trying to break-down the current Channel Up on the 1D time-frame that WTI is trading in.
As you see the current pattern resembles the sequence of May-early June 2020. Both started rising aggressively after the 1D MA50 (blue line) turned into Support. Shortly after the RSI turned sideways and in the case of May/ June, it stayed sideways and consolidated until the end of August.
So far we see this RSI consolidation on full display and it leads me to believe that we may have a similar development into early 2021. Is $55 possible by March? What do you think?
** Please support this idea with your likes and comments, it is the best way to keep it relevant and support me. **
--------------------------------------------------------------------------------------------------------
!! Donations via TradingView coins also help me a great deal at posting more free trading content and signals here !!
🎉 👍 Shout-out to TradingShot's 💰 top TradingView Coin donor 💰 this week ==> TradingView
--------------------------------------------------------------------------------------------------------
