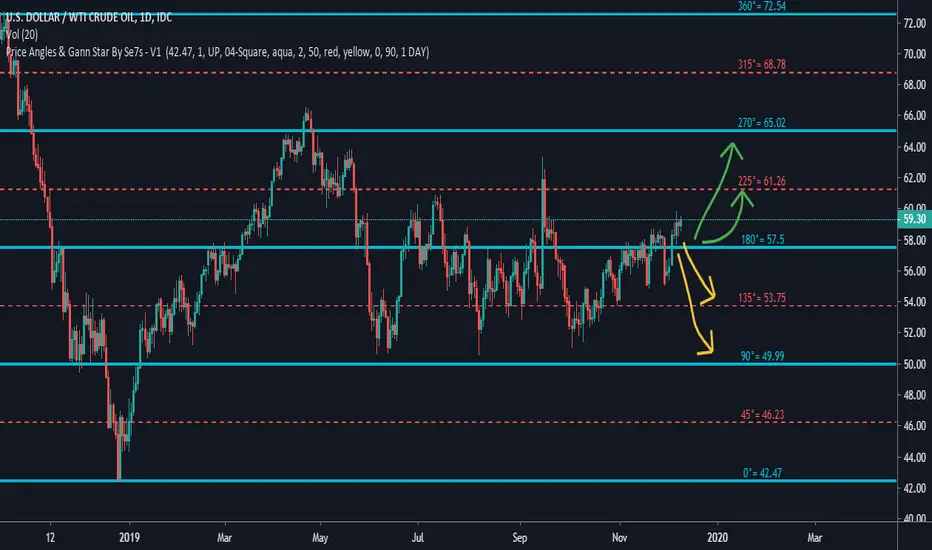
USDWTI on both ways on chart you will see if the price going up 180 it well hit 225 angel and if close bullish going to 270 angel
and if close below 180 angel it well going to 135 angel and close below that well going to 90
Wtisignals
WTI is Trading Sideway Around 61.8% FiboOil fell from its highest close in almost 3 months after the API inventory reported a build bearish to consciences while uncertainly over the December tariff deferral added to the soft tone. The WTI Crude oil has been trading around 61.8% Fibonacci retracement of its September-October declines and the price action here will determine the next move direction.
Fundamentally, the Federal Reserve will be in the spotlight today and if policymakers sound positive about economic conditions, crude prices could respond with gains.
The key resistance level to watch on WTI now is $60. However, with OPEC cutting production by another 500,000 barrels and beyond that the extension of the 1.2 million barrels cut, one would think that there is the possibility of a breakout. This will be further exacerbated if the US and China come together with any type of “phase 1 deal.” In this event we could see further upside pressure towards $61, followed by 62.55 - 63 resistance. Otherwise, we expect a lot of sideways action over the next several days.
On the downside, the energy benchmark is expected to find support at $58.50, and a fall through could take it to the next support area of 58.00 - 57.50. There are located 200- day SMA and the middle lice of Bollinger Bands. We're expect the uptrend line bellow to provide a support.

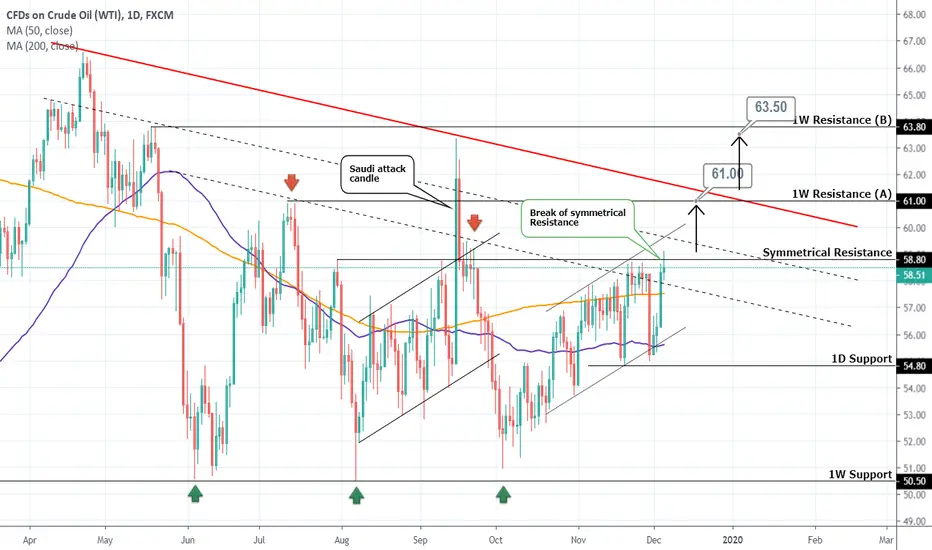
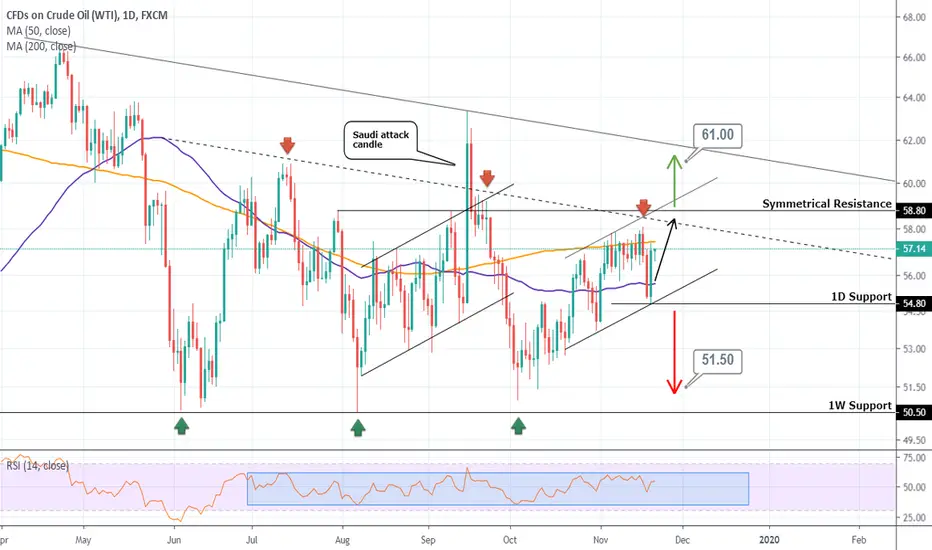
WTI OIL Bullish Trading planPattern: 1D Channel Up.
Signal: Bullish as the price broke the 58.80 Symmetrical Resistance, which (excluding the Saudi attack on September 16th) has been holding since July.
Target: 61.00 (1st 1W Resistance) and if the Lower High trend line (red bold) of the Descending Triangle breaks, 63.50 (2nd 1W Resistance).
See how accurate the 1W Descending Triangle has been on my last Support Buy:
WTI Crude Oil Preparing for OPEC MeetingThe West Texas Intermediate Crude Oil market initially tried to rally during the trading session on Monday, bouncing from the uptrend line and reaching towards and above the 50-day SMA initially. The crude oil market kick off the week with rally, as an Iraq oil minister suggested that not only would OPEC continue its production cuts, but it would possibly even consider cutting an additional 400,000 barrels a day. The rally ran into a brick wall though as President Trump announced new tariffs in Latin America and threatened new ones on Europe.
At the end of the day Brent crude and WTI gave up their gains to finish almost unchanged. Now WTI crude oil is showing convergence with its hourly 20 SMA and trading below its 50 SMA on the same chart.
Near-term action is weighed by Friday’s massive bearish daily candle, with Friday’s close below 38.2% Fibo support at $55.78 (on last 2 months rise of $50.55 to $58.71) adding to negative near-term tone, which is expected to persist while recovery attempts remain capped by daily high ($58.15).
It is because of this that the $55 level underneath will offer plenty of support, but if it does in fact get broken, the market should goes down towards the $52.50 level (78.6% Fibo).
On the upside, the daily 200 SMA line remain relevant and are additional barriers against upward movement. The first resistance is at 56.50. Next is resistance from the 200-EMA at 57.51.
Overall, we believe that the market is going to continue the overall uptrend and channel for the rest of the week, but it will more than likely be very choppy, and news driven.
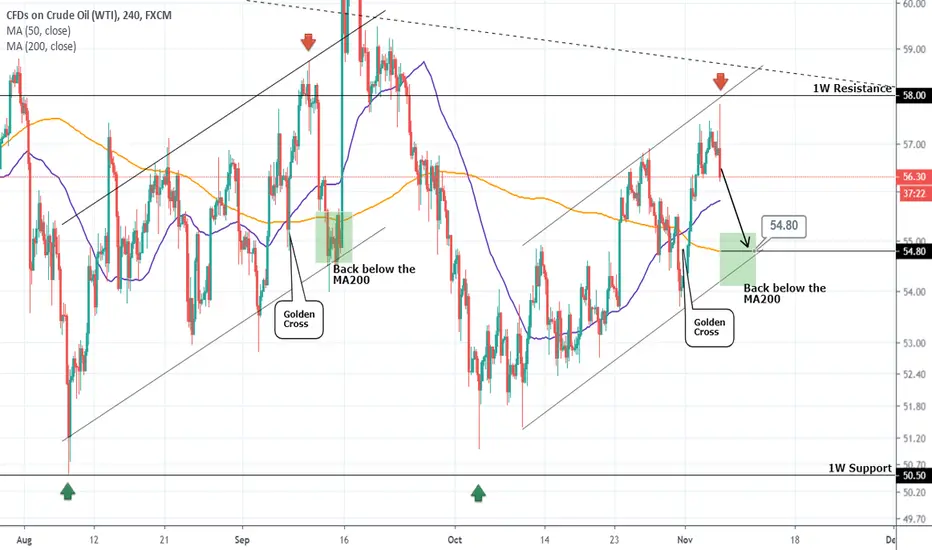
WTI OIL Neutral sentiment. Trade the break-out.Pattern: 1W Descending Triangle .
Signal: Bullish within the 1D Channel Up. Neutral outside so trade the break out: (A) Bullish above the 58.80 Symmetrical Resistance, (B) Bearish below the 54.80 1D Support.
Target: Within the 1D Channel Up it is always the 58.80 Resistance. Outside is (A) = 61.00, (B) = 51.50.
See how accurate the 1W Descending Triangle has been on my last Support Buy:
Crude Oil Markets Seems Try to Recover After Initially FallingRecently, the oil market follow the general run of risk sentiment. However, oil markets are still weaker this morning despite the rebound in risk sentiment.
The last main story in oil markets was the news over the weekend of the discovery of new oil reserves by Iran. They were reported to have discovered an oil field containing the equivalent of 53bn barrels of oil. However, it is not clear how much of that is new or commercially viable. The last thing OPEC needs is more oil discoveries given oil’s current level of abundance...
In spite of a large inventory build the net long oil positions on US crude increased last week for the third consecutive week mainly due to the tariff rollback headlines. So without a reaffirmation of progress between the US and China, these new contracts remain susceptible to headline risk and even a long position squeeze.
Technically, on the daily chart the West Texas Intermediate Crude Oil market initially fell towards the $56 level underneath before turning around and showing signs of strength. At this point, the market looks very likely to turn around and try to reach towards the $58 level. Breaking through that level of course would be very bullish but will run into a significant amount of trouble near the $60 level. In that area is located 78.6% Fibo retracement level (of the fall from the Sept. high 63.68 to the October low $51.06) at $60.77.
To the downside, there is a significant amount of support near the 200-day EMA which is closer to the $55.40 level. Underneath there, the $54 - 53.70 area be targeted for support as well.
Looking at the overall market though, we are essentially in a massive consolidation area.

WTI OIL Sell SignalPattern: Channel Up on 4H.
Signal: Bearish as the pattern made a Higher High just below the 1W Resistance. Also as per the previous symmetrical Channel Up after the Golden Cross a pull back below the 4H MA200 follows.
Target: 54.80.
USOIL Buy SignalPattern: Break out from 1D Channel Up.
Signal: Bullish either at the top of the Channel's trend line or where the MA50/200 currently are.
Target: 66.00 (below the 1W Resistance).

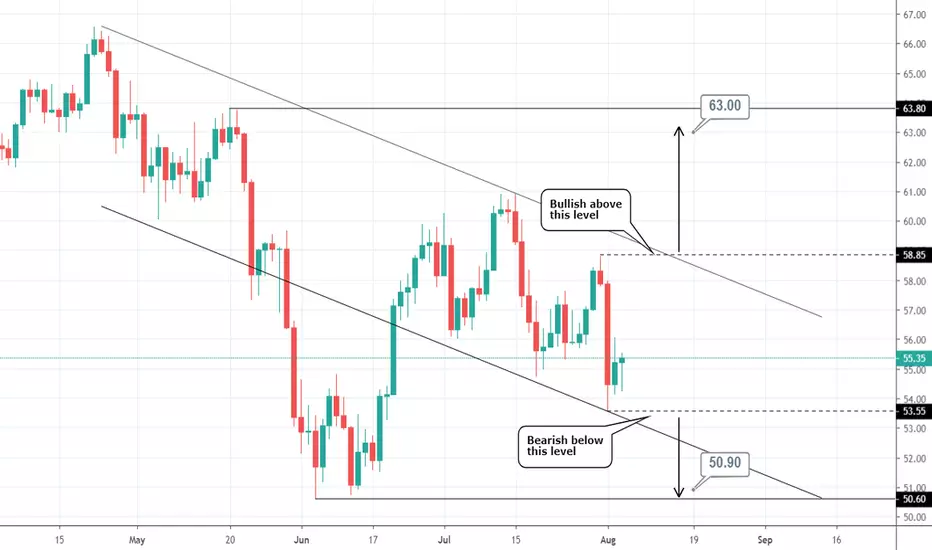
WTI OIL Break out pointsPattern: Channel Down on 1D.
Signal: Bullish above 58.85, bearish below 53.55.
Targets: 63.00 and 50.90 respectively.
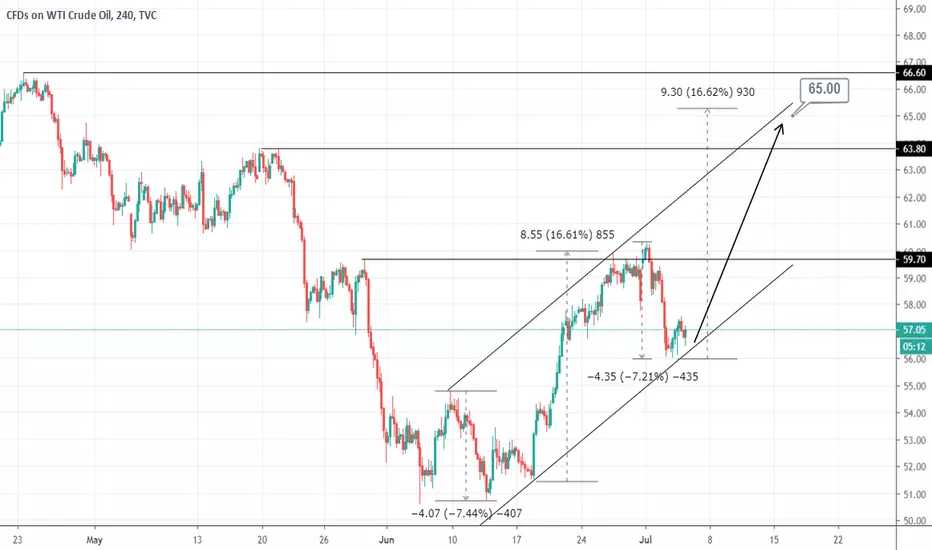
WTI OIL Buy SignalPattern: Channel Up on 1D.
Signal: Bullish as the price hit the Higher Low.
Target: 65.00 (median of the 1W Resistance Zone and a 16.60% extension from the Higher Low).
WTI OIL Buy SignalPattern: Channel Up on 4H.
Signal: Bullish as long as the 4H Support holds or the Golden Cross takes place.
Target: 59.50 (mid term) 63.80 (long term).

WTI OIL Waiting for the break outPattern: 4H Rectangle (blue shape).
Signal: Bullish every time it hits the 1W Support Zone (1) or if 54.85 breaks (2).
Target: (1) = 54.80 (2) = 57.45.
*The break out from the 1D Lower High (dashed line) practically gives a bottom signal waving a medium term bullish reversal.

WTI OIL Buy SignalPattern: Resistance/ Support trading based on Fibonacci levels.
Signal: Bullish as the price is near the 0.618 Fibonacci retracement level and the 50.40 - 51.25 1W Support Zone.
Target: 57.45 (the 0.382 Fibonacci level which may act as a Resistance).

WTI OIL The worst is over. Buy Signal long term.Pattern: Emerging Channel Up on 1W. Symmetrical pattern with 2018.
Signal: Bullish after the 1W Support was tested.
Target: 66.70.

WTI OIL Can the road to $70.00 be that easy?I am not going to over analyze this. Just a little possibility that the pitch fan indicates.
As long as the median provides Support (which was converted from a Resistance on the previous bullish leg) the 70.00 medium term target is possible. These indicators show that under those circumstances another +11% bullish sequence is certainly possible.
I know it may seem too ideal to be true but patterns serve this purpose. What do you think?

very overbought market on wti, looking for pullback
hey guys,
wti is currently very overbought and I am looking for counter trend trades.
on 1H chart we see a formation of a descending triangle in an uptrend.
It is a very important reversal pattern and it is worth to focus your attention on it.
just wait and sell the breakout of the triangle's support.
your target will be based on structure around 60.0 level.
good luck!

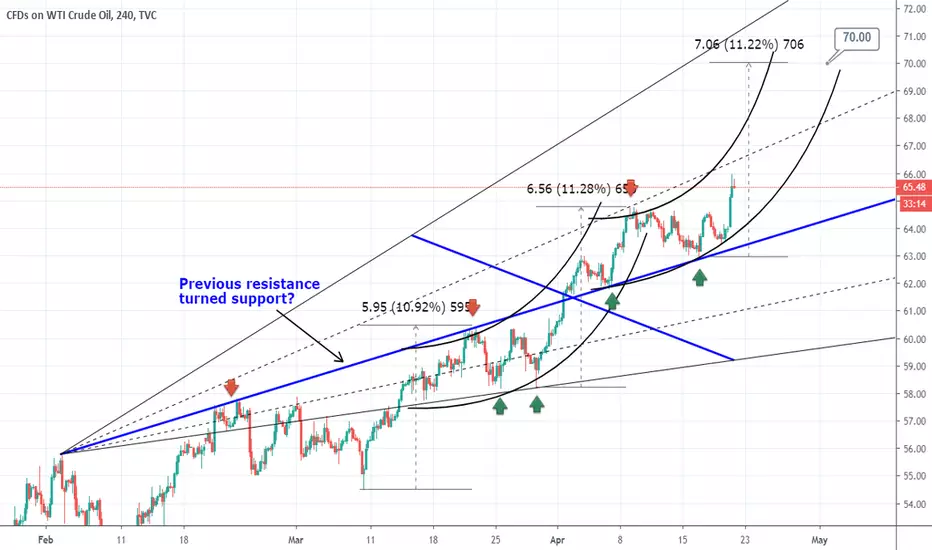
USOIL (WTI) Previous Resistance turning Support?We all know WTI oil is bullish. It has been so since the violent bottom last December. The question is where it is better to buy?
Two scenarios:
1. The former Higher High Resistance (red line) has become a Support and the 1D Channel Up breaks aggressively upwards. So far it has provided support twice.
2. The 1D Channel Up pulls back and makes a Higher Low near the inner Higher Low Support (green line).
In both cases my TP is 65.00.

WTI OIL Sell Signal (Inverse H&S and support levels)Pattern: Inverse Head and Shoulders on 4H. Channel Up on 1D.
Signal: Bearish after the Resistance (Double Top) rejection.
Target: 58.40 (1st supporting line) 57.50 (1D Higher Low).

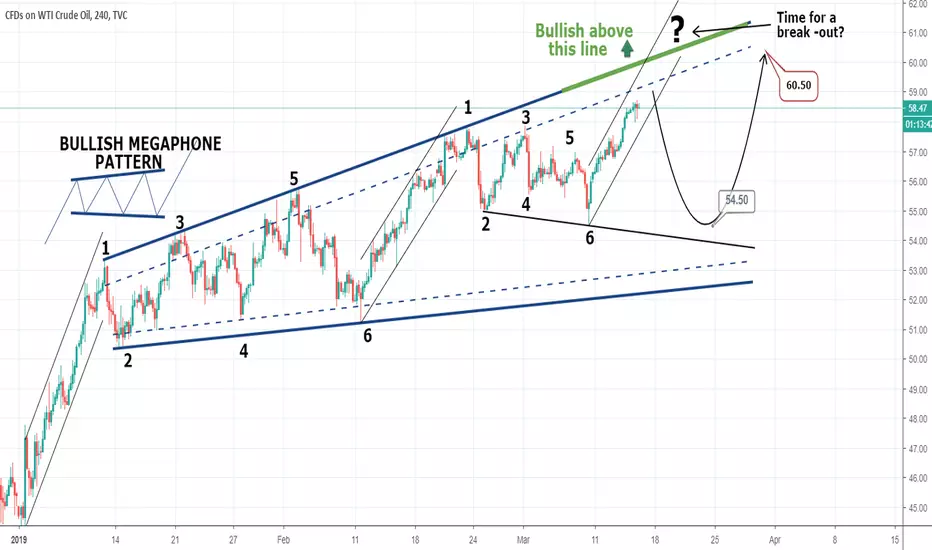
WTI OIL Buy low. Sell high. Repeat.Pattern: Extended Bullish Megaphone on 1D that is posting a repetitive High Low candle sequence after each Channel Up.
Signal: Bullish but with a lower entry either at 56.00 or 54.50. Long term bullish break-out if the green line breaks (60.00 - 61.00).
Target: 60.50.
USOIL Rangebound Morning everyone! I hope you all are doing well. Following oil this week, we should continue to stay rangebound with the 50-EMA and the 200-EMA offering support/resistance. No news yet has triggered a push in either direction. Alarms have to been set to trigger at 55.20 and 57.10 to signal upward or downward momentum. If the market continues to stay range bound, shorting at 57.10 and going long at 55.20 should continue to reap rewards. Triggering in either direction with an igniting factor (supply cuts etc.), would indicate the opposite (going short at 55.20, long at 57.10).
Happy Trading!
Zak
WTI OIL Sell SignalPattern: Channel Down on 4H.
Signal: Bearish after making a Lower High.
Target: 55.00 (previous Low).
