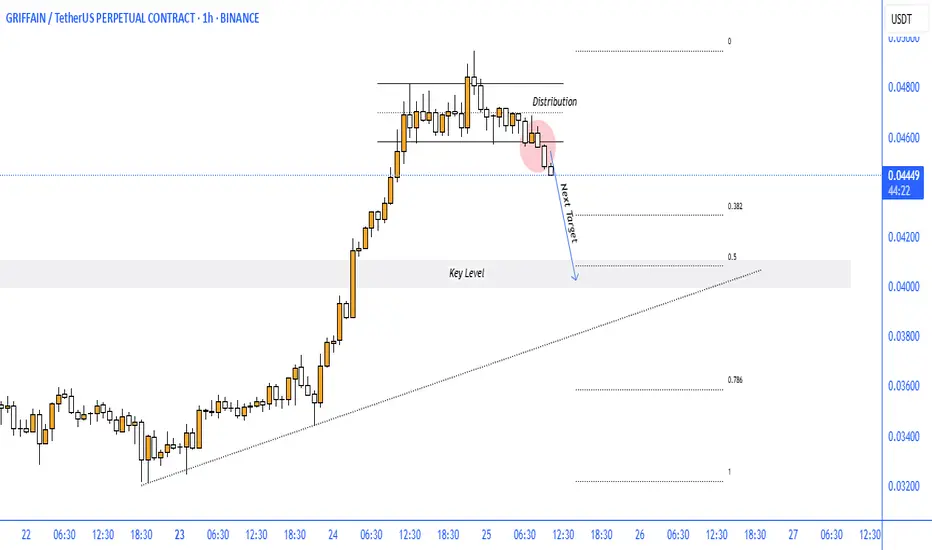
GRIFFAIN BEARISH SETUPGRIFFAIN/USDT (1H Chart) – Distribution Phase Signals Short-Term Bearish Reversal
The 1-hour chart of GRIFFAIN/USDT on Binance displays a distribution pattern at the recent high, suggesting bullish exhaustion and an imminent correction. Price has now broken below the consolidation range, confirming a shift in intraday sentiment.
🔍 Key Technical Insights:
Distribution Zone Formed: Price stalled at the top with several failed attempts to push higher, forming a range – a classic sign of distribution before reversal.
Bearish Breakdown: The bearish candle has breached support, initiating a potential downward move toward the 0.5 Fibonacci retracement level.
Key Level to Watch:
Next Target: $0.0400 (50% Fib level + historical demand zone)
Further Support: $0.0360 (Fib 0.786 region)
📉 Outlook & Expectations:
Short-term bias remains bearish below the $0.0458 zone. As long as price stays below the distribution range, expect continuation toward the $0.0400 support area, aligning with key structural and Fibonacci levels.
This setup is ideal for intraday or short-term swing traders watching for pullback entries or breakdown continuation.
Wulfofwallst
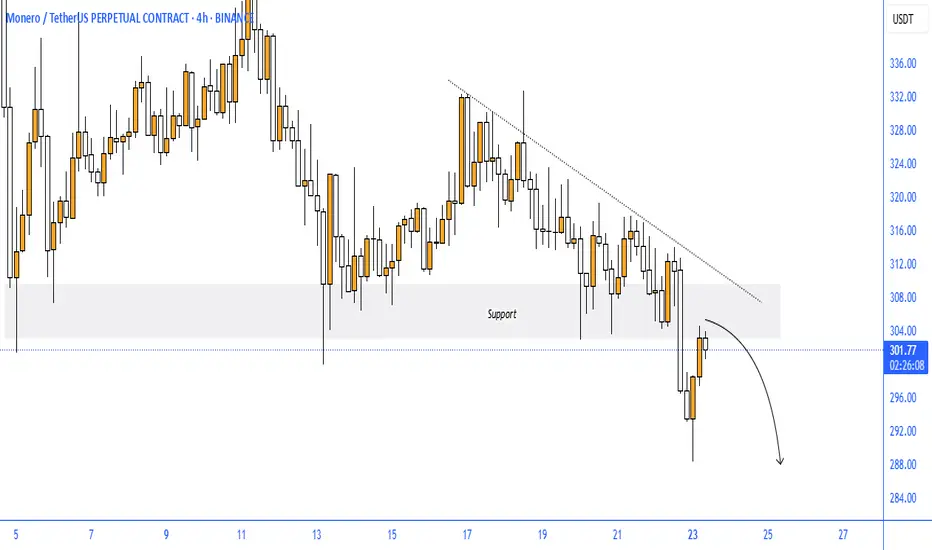
XMR BEARISH SETUPWith the recent bearish momentum we have witnessed a breakout on support and the recent pullback can trigger another selling pressure as a continuation of the major bearish trend to the downside.
ZECUSDT BEARISH SETUPIdentified a trend breakout under the daily timeframe which has a potential for a retest back on the key zone highlighted. Expecting a continuation in the bearish trend to follow up price target close to $40.

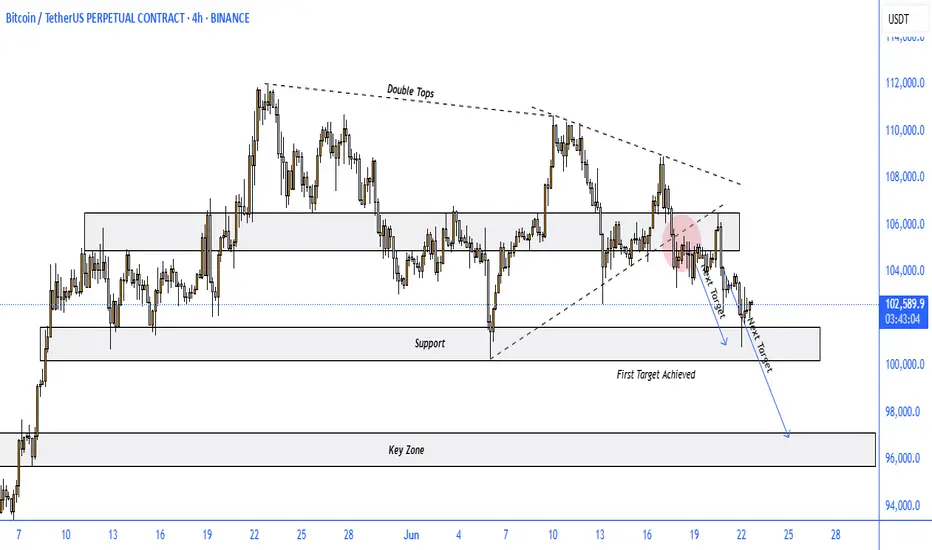
BITCOIN BEARISH SETUPBitcoin (BTC/USDT) – Breakdown from Double Top Confirms Bearish Trend Continuation
The 4-hour chart of BTC/USDT (Binance Perpetual Contracts) presents a textbook double top formation followed by a confirmed breakdown below structural support levels. The bearish trend has already met its first target, and technicals suggest the move could extend lower toward the key demand zone around $96,000.
🔍 Key Technical Highlights:
Double Top Pattern: Clear double top structure formed between $109,000–$110,000, followed by a strong rejection.
Support Break: Price broke down below key support at ~$105,000, triggering a sell-off and validating the bearish reversal.
Bearish Retest: After the breakdown, price retested the broken trendline (highlighted with a red zone) and failed to reclaim the range.
First Target Hit: Price achieved the first projected support zone at around $101,000.
Next Target: Based on measured move projection and previous structure, the next downside target lies near the $96,000 mark.
📉 Outlook:
The structure remains bearish as long as BTC trades below the broken support-turned-resistance zone (~$105,000). Momentum favors continued downside toward the next key zone unless a significant bullish reversal signal emerges.
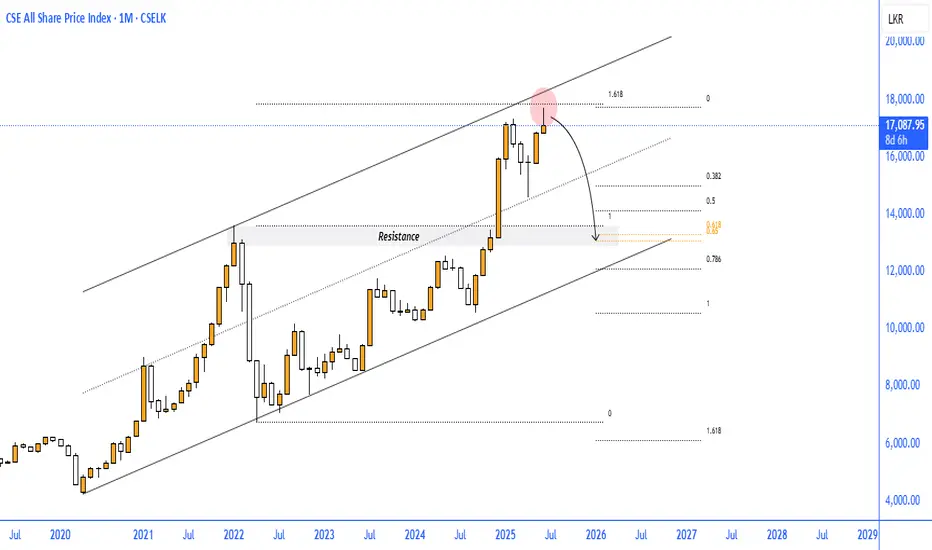
CSE ASI BEARISH SETUPThe monthly chart of the CSE All Share Price Index (ASI) reveals a technically significant scenario: the index is currently testing the upper boundary of a long-term ascending channel while also aligning with the 1.618 Fibonacci extension, both of which signal potential reversal pressure ahead.
Key Observations:
Long-Term Resistance: The price is testing the channel’s upper resistance line near the 17,000 – 17,700 zone, where rejection often occurs historically.
Fibonacci Confluence: The current high coincides with the 1.618 Fibonacci extension, a critical level where long rallies often stall or reverse.
Bearish Candlestick Pattern: The formation of a potential bearish reversal candle near the resistance zone is an early signal of seller interest.
Expected Retracement Levels:
Initial support lies at the 0.382 and 0.5 Fibonacci retracement zones, around 15,000 – 14,000.
Deeper correction could target the 0.618 level (~13,000), which aligns with previous breakout structure and the channel midline.
Conclusion:
The ASI appears overextended after a strong bullish leg and is currently showing signs of exhaustion at the top of a multi-year channel. Unless price breaks above and sustains above 17,700, a correction toward the 13,000–14,000 zone is likely, supported by Fibonacci retracement levels and the channel structure.
This presents a potential medium-term bearish outlook for investors and swing traders, with caution advised around current highs.
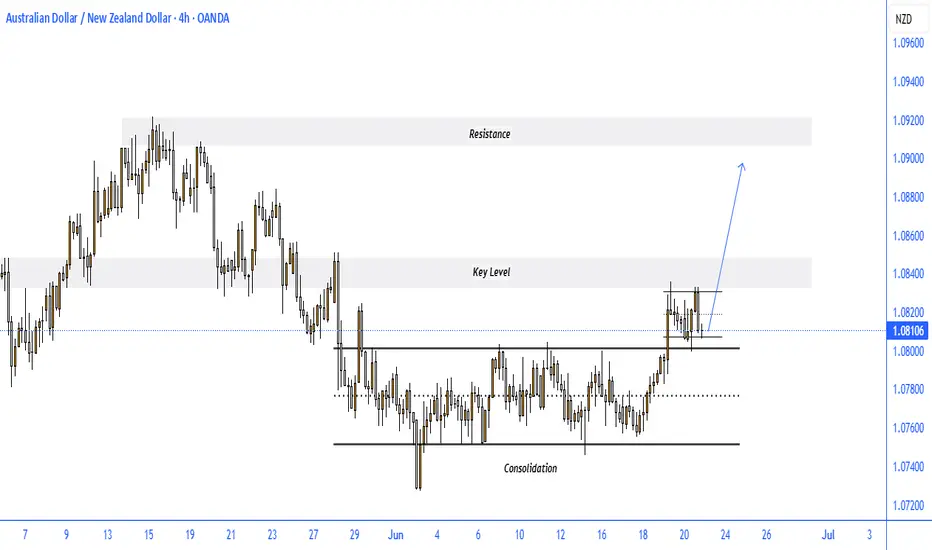
AUDNZD BULLISH SETUPThe 4-hour chart of AUD/NZD shows a strong bullish breakout from a prolonged consolidation phase, followed by a healthy retest of the breakout level, suggesting the pair is gearing up for further upside.
Key Observations:
Consolidation Breakout: After spending several weeks in a tight consolidation range between 1.0760–1.0800, the price has convincingly broken above the range resistance near 1.0810.
Key Level Retest: The breakout zone (previous resistance) is now acting as new support, confirmed by multiple rejections (highlighted area).
Bullish Momentum: Structure is forming higher highs and higher lows, indicating continuation of upward trend.
Upside Target: With the breakout holding, the next logical target lies near the resistance zone around 1.0910, which served as a previous swing high.
Conclusion:
AUD/NZD is showing bullish strength after breaking out of consolidation and holding above the retested key level. As long as 1.0800–1.0810 support holds, the pair remains poised for a bullish continuation toward the 1.0900–1.0920 resistance zone. A break below this level would invalidate the setup and bring price back into the previous range.
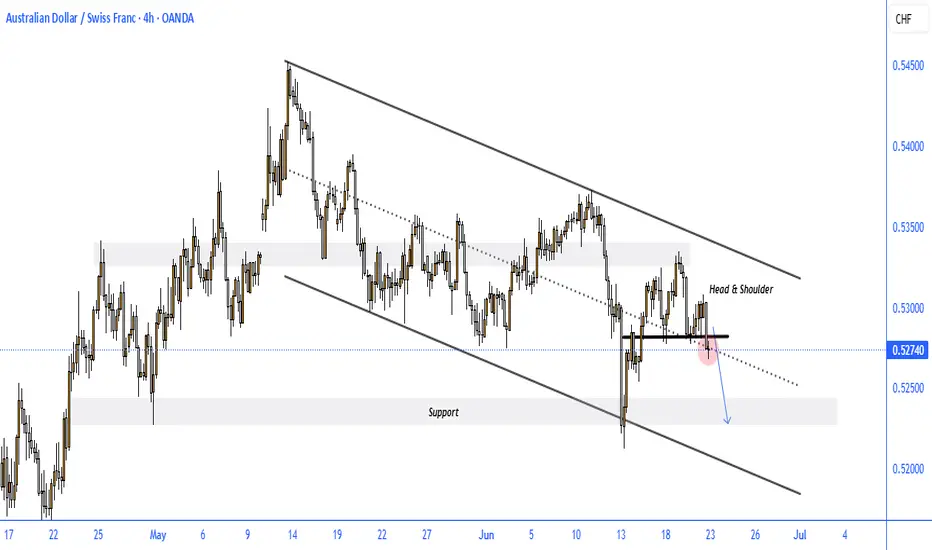
AUDCHF BEARISH SETUPThe AUD/CHF 4-hour chart is presenting a classic Head & Shoulders pattern within a well-defined bearish descending channel, signaling a likely continuation to the downside if neckline support fails.
Key Observations:
Bearish Channel in Play: The broader trend remains bearish, with price action respecting both channel boundaries.
Head & Shoulders Formation: A visible Head & Shoulders pattern has formed near the top of the channel, with the neckline around 0.5275.
Neckline Break Risk: Price is currently testing the neckline area (highlighted in red). A confirmed break below would likely trigger bearish momentum.
Downside Target: A break below the neckline could push AUD/CHF toward the support zone near 0.5220, in line with the lower boundary of the channel.
Trend Structure: Lower highs and lower lows continue to dominate, reinforcing the bearish bias.
Conclusion:
AUD/CHF remains technically weak, and the emerging Head & Shoulders breakdown may act as a strong continuation signal within the existing downtrend channel. A clear close below 0.5270 could open the door for a further drop toward 0.5220. Caution is warranted for bulls unless a significant reversal signal emerges.
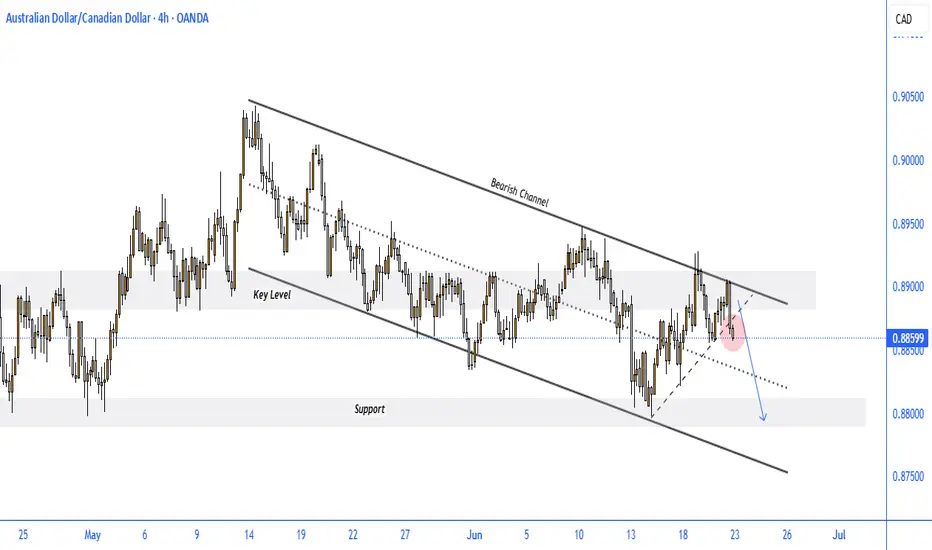
AUDCAD BEARISH SETUPThe 4-hour chart for AUD/CAD shows a well-respected bearish descending channel, where price action remains capped below a strong dynamic resistance. Price recently rejected a key resistance zone near 0.8900, signaling a potential continuation to the downside.
Key Observations:
Bearish Channel Intact: Price continues to respect the upper and lower bounds of the descending channel.
Key Resistance Rejection: The pair tested the 0.8900 resistance area and faced immediate rejection (highlighted in red), forming a lower high.
Break of Trendline: A rising trendline from the recent low has been broken, reinforcing bearish pressure.
Support Zone in Sight: If bearish momentum continues, the next major support lies around 0.8780 – 0.8800, offering a possible target area.
Short-term Setup: Minor upward retracement may retest the broken trendline, but unless 0.8900 is breached, the bias remains strongly bearish.
Conclusion:
AUD/CAD remains under bearish control within the descending channel. The recent rejection from the upper boundary and break of the rising trendline suggest a high-probability move toward the 0.8800 support zone. Traders should look for confirmation of lower highs or bearish engulfing patterns to position short.
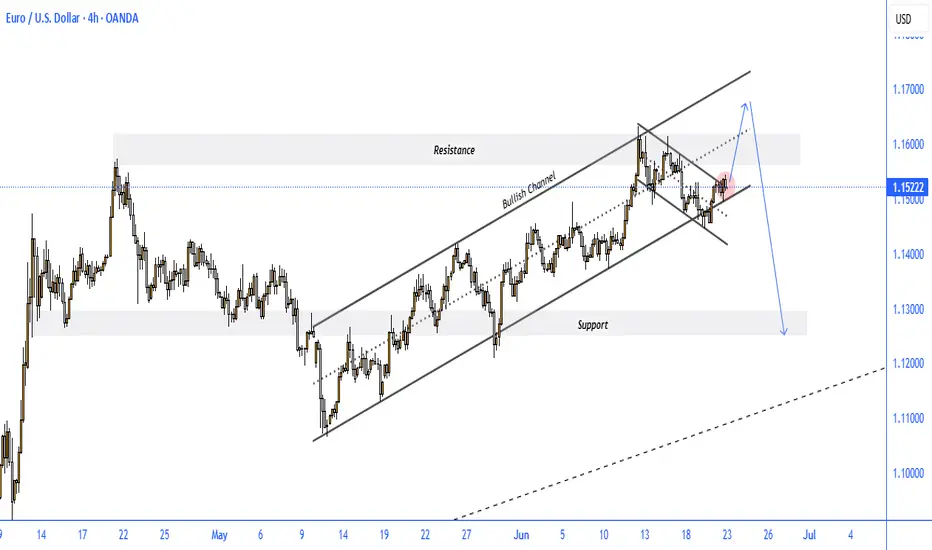
EURUSD BEARISH SETUP
The EUR/USD 4-hour chart reflects a significant technical setup, showing price action within a bullish ascending channel that has recently broken to the downside, forming a falling wedge pattern—typically a bullish continuation signal.
Key Observations:
Bullish Channel Broken: The price broke below the ascending channel earlier this month, signaling initial weakness.
Falling Wedge Formation: A bullish falling wedge has developed, and the pair is now testing its upper boundary near 1.1522, attempting a breakout.
Resistance Zone: The price is approaching a key resistance area between 1.1550 – 1.1600, which aligns with previous highs and the wedge's upper edge.
Scenario Projection:
A temporary bullish breakout toward the resistance zone is expected.
If the pair gets rejected from this resistance, a sharp decline toward the major support area near 1.1300 is likely.
Bearish Confirmation: A clear rejection at the resistance zone followed by a break below the recent minor support (red zone) would confirm the bearish move.
Conclusion:
While short-term bullish momentum may push EUR/USD slightly higher, the confluence of resistance levels suggests a high probability of rejection. Traders should watch for reversal signals in the 1.1550–1.1600 zone, as failure to break higher could lead to a bearish move toward 1.1300 in the coming days.
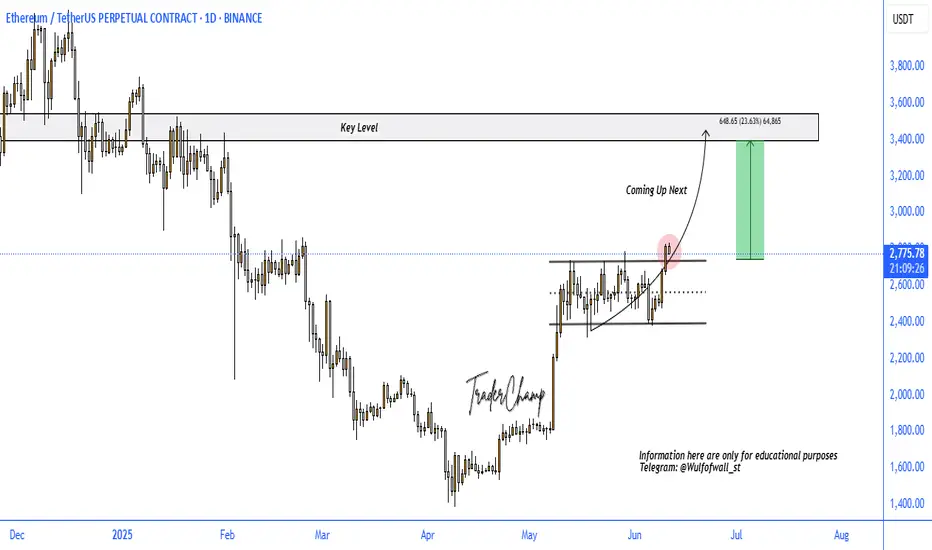
ETH BULLISH SETUPEthereum has recently broken out bullishly on higher timeframes, signaling a potential move toward the key resistance zone around $3,460. This level holds significant technical importance. The breakout above the hourly flag pattern confirms bullish momentum. As long as price holds above $2,300, the setup remains valid. A drop below this level would invalidate the current bullish outlook.
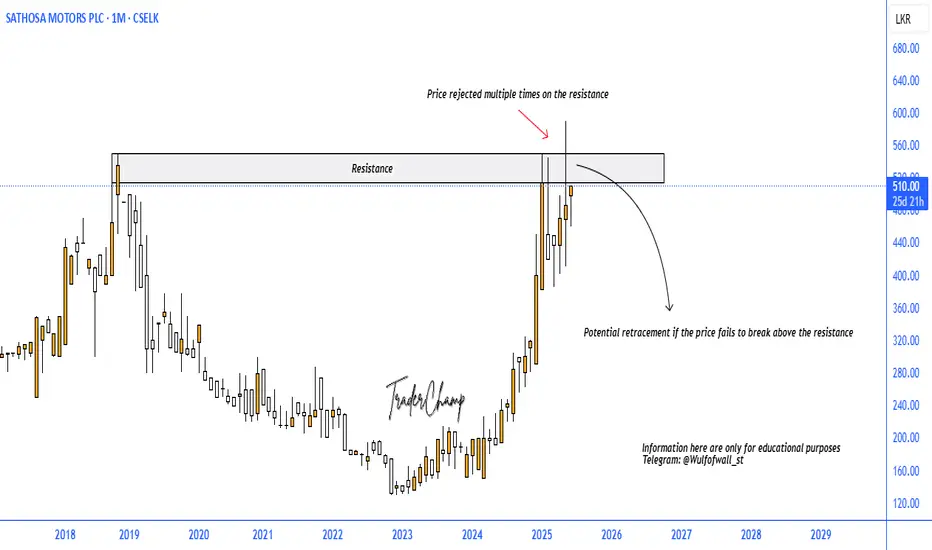
SMOT BEARISH SETUPWe have witnessed a major resistance zone under the monthly timeframe with multiple price rejections formed close to this area. We are expecting a retracement next, if the price remains unbreakable above the highlighted zone.
GOLD BEARISH SETUPIdentified a breakout on the support / neckline on the head and shoulder pattern under the hourly timeframe. We witness a possibility of a filling the imbalance created inside the 1hour candles close to 3273-3250 region with the continuation of bearish trend expected.

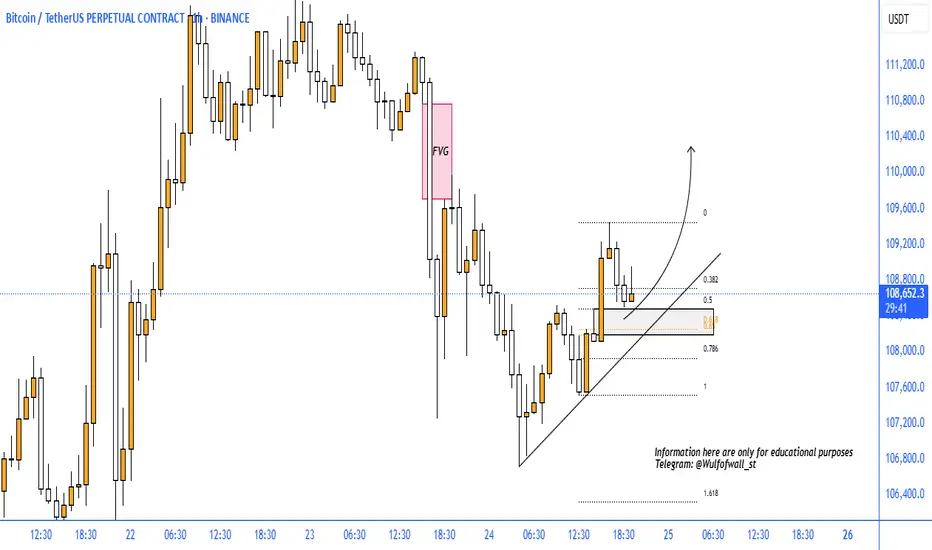
BTC BULLISH SETUPBTCUSDT is looking for a reversal and to take the bullish trend extended towards the FVG formed on top. Under the lower timeframes we have a valid reversal indication identified.
TAO BULLISH SETUPTAOUSDT on a major hourly support, where we are looking for a possible short term reversal for a high accuracy opportunity.
