W/USDT Breaks Downtrend! Is This the Start of a Bullish Reversal🔍 Pattern and Chart Structure:
Timeframe: 1D (Daily)
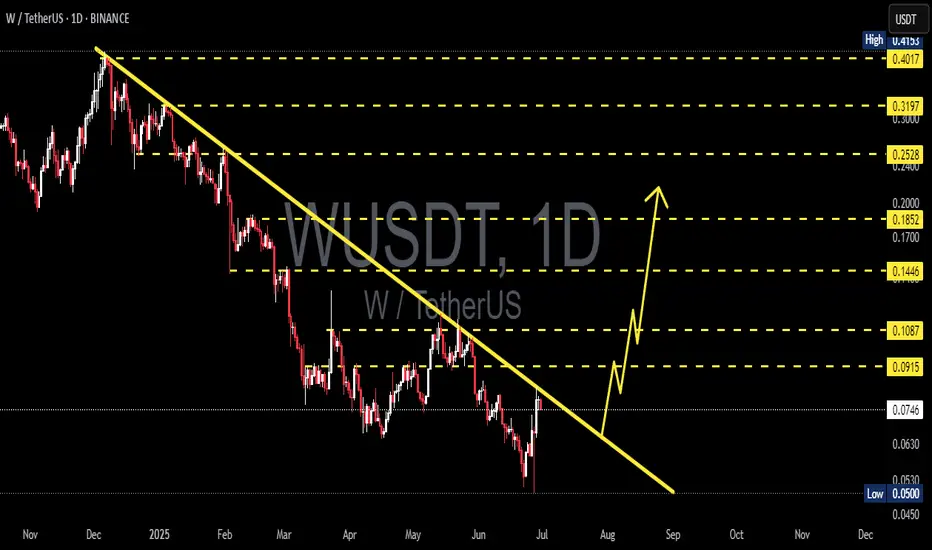
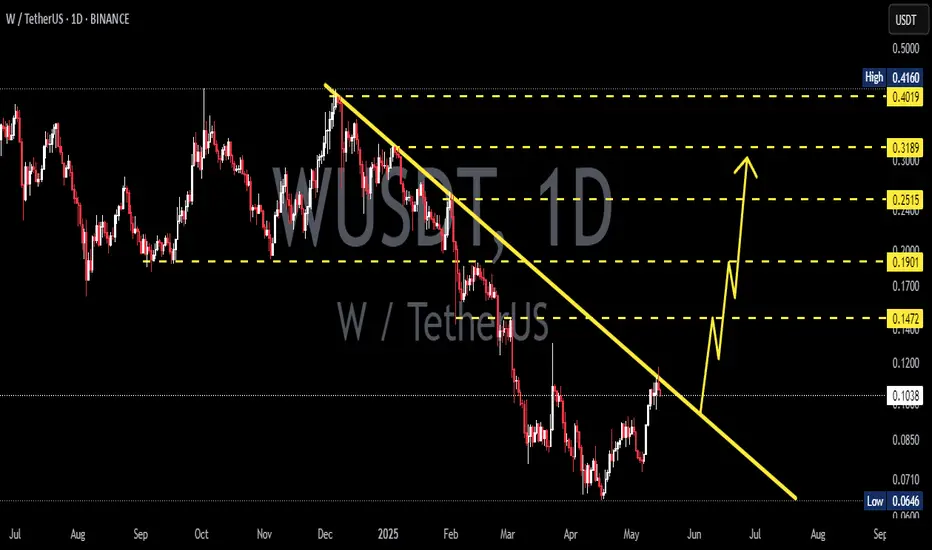
Pattern: Breakout from a Descending Trendline that has been intact since late 2024.
Support and Resistance Levels:
Closest support: $0.0744
Key resistances: $0.0915 – $0.1087 – $0.1446 – $0.1852 – $0.2528 – $0.3197 – $0.4017
Volume & Momentum: The chart shows a price breakout above the descending trendline, likely accompanied by increased buying volume (volume confirmation is important).
🚀 Bullish Scenario:
If the price holds above the broken trendline:
A confirmed breakout occurs if the daily candle closes above $0.0744 and pushes toward $0.0915 and beyond.
Gradual target levels:
1. $0.0915 → $0.1087
2. $0.1087 → $0.1446
3. $0.1446 → $0.1852 (strong psychological resistance)
4. With strong bullish momentum, potential rally towards $0.25 – $0.40 range
📌 Note: If the price forms a higher low after the breakout, it further confirms a trend reversal.
🔻 Bearish Scenario:
If this breakout turns out to be a false breakout:
Price fails to hold above $0.0744
Drops back down to the support range around $0.0630 → $0.0500
If the price breaks below $0.0500, a further decline toward historical support at $0.0450 is possible
📌 A bearish confirmation would come from a daily candle closing back below the trendline with increased selling volume.
🧩 Conclusion:
Currently, W/USDT shows signs of a possible reversal after breaking the major long-term downtrend.
Breakout validation requires volume confirmation and strong follow-through.
The potential upside is attractive, but caution is advised in case of a false breakout.
#WUSDT #CryptoBreakout #AltcoinAnalysis #BullishReversal #TechnicalAnalysis #CryptoTrading #DescendingTrendline #BreakoutAlert #AltcoinSeason #SupportResistance
Wusdttrade
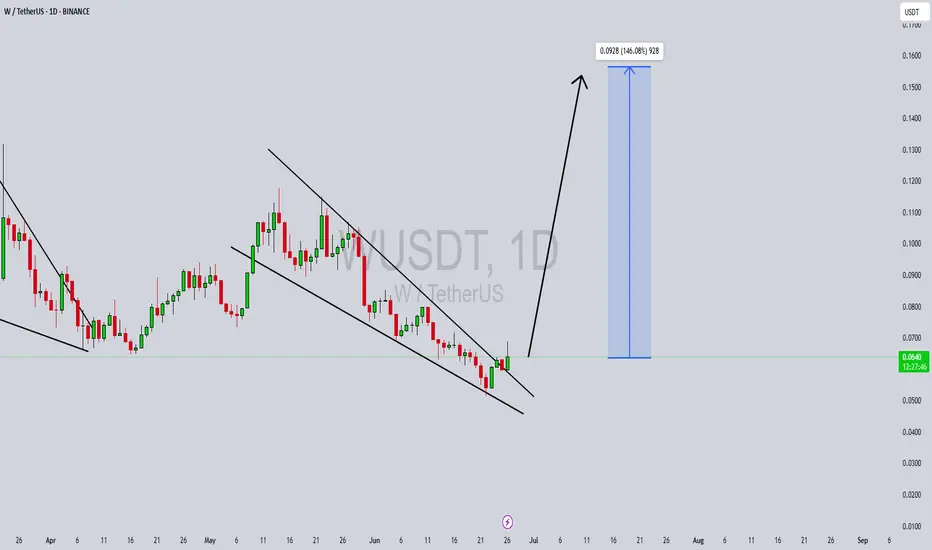
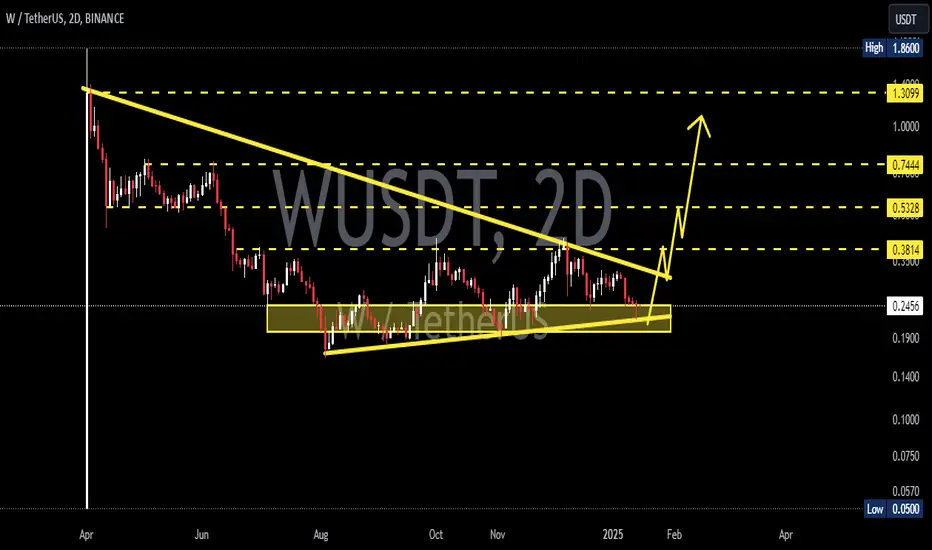
WUSDT Forming Falling WedgeWUSDT is beginning to show a powerful breakout signal from a well-defined falling wedge pattern, a classic technical setup often followed by strong bullish momentum. After weeks of steady downward pressure, the price has now pushed above the upper trendline, supported by growing volume, which further confirms the potential reversal in trend. This technical structure typically precedes large percentage moves, and in this case, an upside potential of 130% to 140%+ is projected.
This surge in price action is drawing significant attention from investors and traders alike, as WUSDT is currently trading at relatively undervalued levels with a visible shift in sentiment. The bullish wave forming on the chart shows not only strong technical demand but also a renewed sense of accumulation across the market. The broader altcoin market cycle also supports such aggressive moves as traders rotate into undervalued tokens with high reward potential.
Increased trading activity and volume on the breakout confirms that institutional and retail interest is gaining momentum in WUSDT. The aggressive price target zones indicate strong confidence among market participants. The coin’s technical setup aligns well with the crypto market’s current appetite for breakout plays, particularly those emerging from falling wedges and descending channels.
Given these factors, WUSDT presents an exciting opportunity for traders who are looking to capture sharp upward moves. With strong chart structure, breakout confirmation, and positive investor sentiment, the probability of a sustained bullish trend is high. A close watch on price continuation and support holding will be key as this move unfolds.
✅ Show your support by hitting the like button and
✅ Leaving a comment below! (What is You opinion about this Coin)
Your feedback and engagement keep me inspired to share more insightful market analysis with you!
WUSDT 1D Analysis W ~ 1D Analysis
#W Buy back gradually from here if you still have confidence in this coin with a short term target of at least 15%+
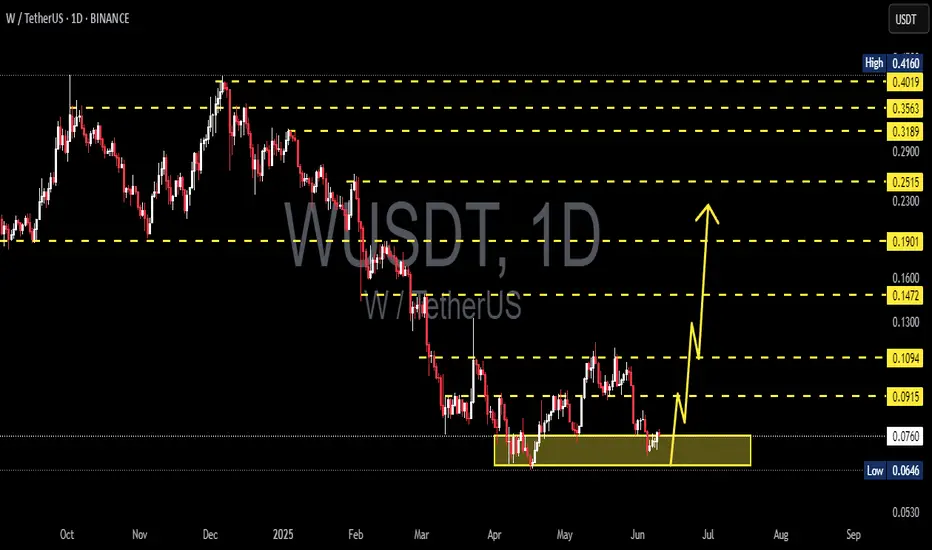
WUSDT 1D AnalysisW ~ 1D✅ Analysis
#W Buy after successfully breaking through this resistance line with a short-term target of at least 10%+
WUSDT – Major Resistance Zones Ahead! “This is where the battle happens—will resistance hold, or are we about to see an explosive breakout?”
🔥 Key Insights:
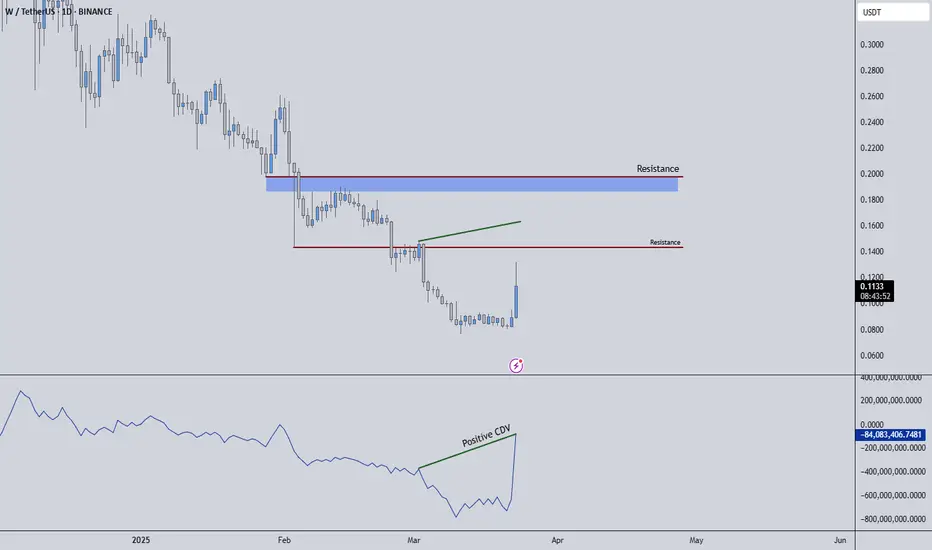
✅ Red Lines = Strong Resistance – These levels have proven themselves before, and now they are back in play.
✅ Risking 1R on Both – Calculated risk, sniper execution. No random entries, just smart positioning.
✅ LTF Confirmation is Everything – Price touching resistance means nothing—we wait for true weakness or strength before pulling the trigger.
💡 How I’m Trading This Like a Pro:
If Price Rejects Hard: I’ll wait for a clear LTF (5M/15M) breakdown with CDV divergence before shorting.
If We Break Resistance: No panic buys—I’ll wait for a clean breakout, retest, and LTF strength confirmation before considering longs.
Stops? Last swing high. Precision over emotions.
📉 Final Thought:
Retail traders FOMO, real traders wait. Patience, execution, and data-driven decisions win the game. We don’t guess—we react like pros.
“Follow me if you’re tired of chasing bad trades. Let’s trade like the 1%.” 🚀🔥📊
A tiny part of my runners;
💼 STMXUSDT: 2 Buying Areas
🐢 TURBOUSDT: Buy Zones and Buyer Presence
🌍 ICPUSDT.P: Massive Upside Potential | Check the Trade Update For Seeing Results
🟠 IDEXUSDT: Spot Buy Area | %26 Profit if You Trade with MSB
📌 USUALUSDT: Buyers Are Active + %70 Profit in Total
🌟 FORTHUSDT: Sniper Entry +%26 Reaction
🐳 QKCUSDT: Sniper Entry +%57 Reaction
j
A tiny part of my runners:
🎯 ZENUSDT.P: Patience & Profitability | %230 Reaction from the Sniper Entry
🐶 DOGEUSDT.P: Next Move
🎨 RENDERUSDT.P: Opportunity of the Month
💎 ETHUSDT.P: Where to Retrace
🟢 BNBUSDT.P: Potential Surge
📊 BTC Dominance: Reaction Zone
🌊 WAVESUSDT.P: Demand Zone Potential
🟣 UNIUSDT.P: Long-Term Trade
🔵 XRPUSDT.P: Entry Zones
🔗 LINKUSDT.P: Follow The River
📈 BTCUSDT.P: Two Key Demand Zones
🟩 POLUSDT: Bullish Momentum
🌟 PENDLEUSDT.P: Where Opportunity Meets Precision
🔥 BTCUSDT.P: Liquidation of Highly Leveraged Longs
🌊 SOLUSDT.P: SOL's Dip - Your Opportunity
🐸 1000PEPEUSDT.P: Prime Bounce Zone Unlocked
🚀 ETHUSDT.P: Set to Explode - Don't Miss This Game Changer
🤖 IQUSDT: Smart Plan
⚡️ PONDUSDT: A Trade Not Taken Is Better Than a Losing One
💼 STMXUSDT: 2 Buying Areas
🐢 TURBOUSDT: Buy Zones and Buyer Presence
🌍 ICPUSDT.P: Massive Upside Potential | Check the Trade Update For Seeing Results
🟠 IDEXUSDT: Spot Buy Area | %26 Profit if You Trade with MSB
📌 USUALUSDT: Buyers Are Active + %70 Profit in Total
🌟 FORTHUSDT: Sniper Entry +%26 Reaction
🐳 QKCUSDT: Sniper Entry +%57 Reaction
📊 BTC.D: Retest of Key Area Highly Likely
I stopped adding to the list because it's kinda tiring to add 5-10 charts in every move but you can check my profile and see that it goes on..
#WUSDT is setting up for a breakout📉 Long BYBIT:WUSDT.P from $0,08897
🛡 Stop loss $0,1985
1h Timeframe
⚡ Plan:
➡️ Waiting for consolidation near resistance and increased buying activity before the breakout.
➡️ Expecting an impulsive upward move as buy orders accumulate.
🎯 TP Targets:
💎 TP 1: $0,09275
💎 TP 2: $0,09465
💎 TP 3: $0,09566
🚀 BYBIT:WUSDT.P is setting up for a breakout—preparing for an upward move!

WUSDT 1WW ~ 2D
#W If you still have Conviction on this coin,. This is a very good support block for now,. Buy in stages. Target 20%++
WUSDT 1WW ~ 2D
#W If you still have Conviction on this coin,. Buy gradually inside this pattern,. Or if you are a trader who plays it safe, wait for this resistance line to be successfully broken. minimum target 20%++
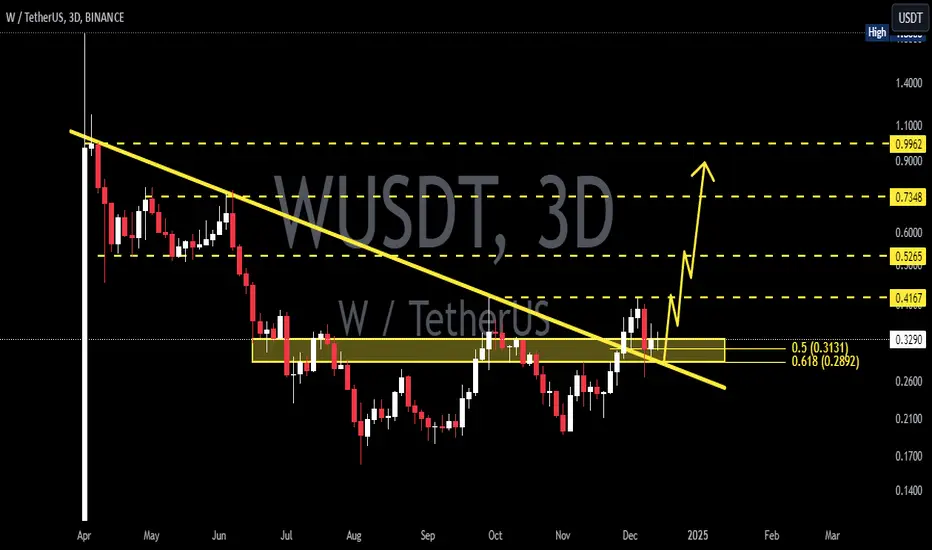
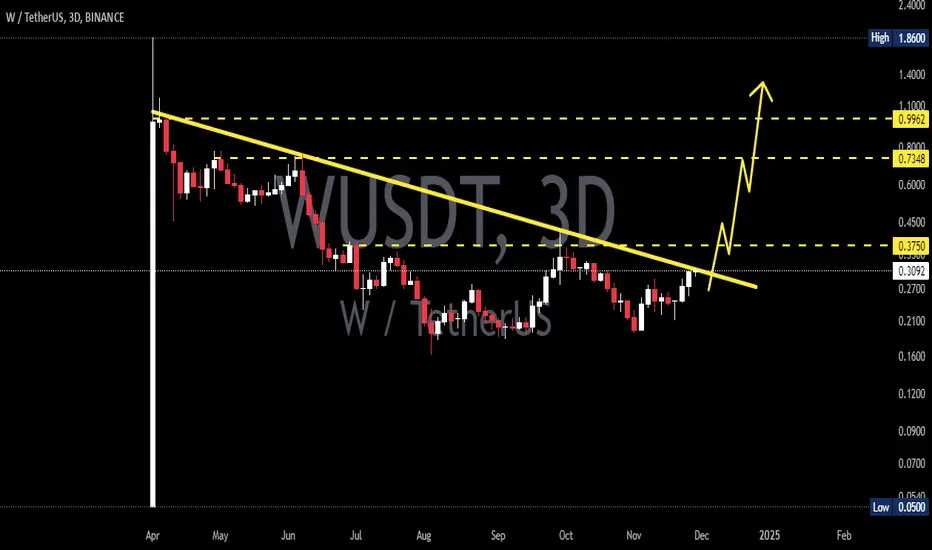
W / USDT : Approaching trendline resistance -W/USDT: Approaching Trendline Resistance – A Bullish Rally on the Horizon
W/USDT is setting up for an exciting move 📈 as it nears a critical trendline resistance zone 📊. The price action has been consolidating, creating a textbook setup for a potential breakout 💥. A successful breakout above this level could ignite a strong bullish rally 🚀. Keep this pair on your radar 👀 and wait for confirmation before taking action.
Key Insights:
1. Trendline Resistance: W/USDT is approaching a significant trendline that has historically acted as resistance. A break above this level could pave the way for an extended upward move.
2. Volume Surge: A noticeable increase in trading volume during the breakout will validate buyer strength 🔥.
3. Bullish Signals: Indicators like RSI and MACD are showing positive momentum ⚡, supporting the potential for a bullish breakout.
Steps to Confirm the Breakout:
Wait for a clear 4H or daily candle to close above the trendline 📍.
Monitor trading volume during the breakout for a surge in activity, signaling strong buying interest 📊.
Watch for a retest of the broken resistance as a new support zone to confirm the move ✅.
Be cautious of false breakouts, such as sharp reversals or wicks above the trendline ⚠️.
Risk Management Strategies:
Utilize stop-loss orders to mitigate risks 🔒.
Ensure your position size aligns with your overall trading strategy and risk tolerance 🎯.
This analysis is for educational purposes only and does not constitute financial advice. Always conduct your own research (DYOR) 🔍 before making investment decisions.

WUSDT 3DW ~ 3D
#W Retesting this support level,. If you still have Conviction on this coin,. This support block would be a very good buy for now, with minimal short-term targets 20%+
WUSDT Potentially a low risk buyThe crypto space is potentially set for a bull run as we have seen BINANCE:BTCUSDT gain momentum and finally breaking above the 73,630.47 recent high to hit a new all time high of about flying slightly above the 76,000 mark. This has triggered momentum in most alt coins and BINANCE:WUSDT is no different.
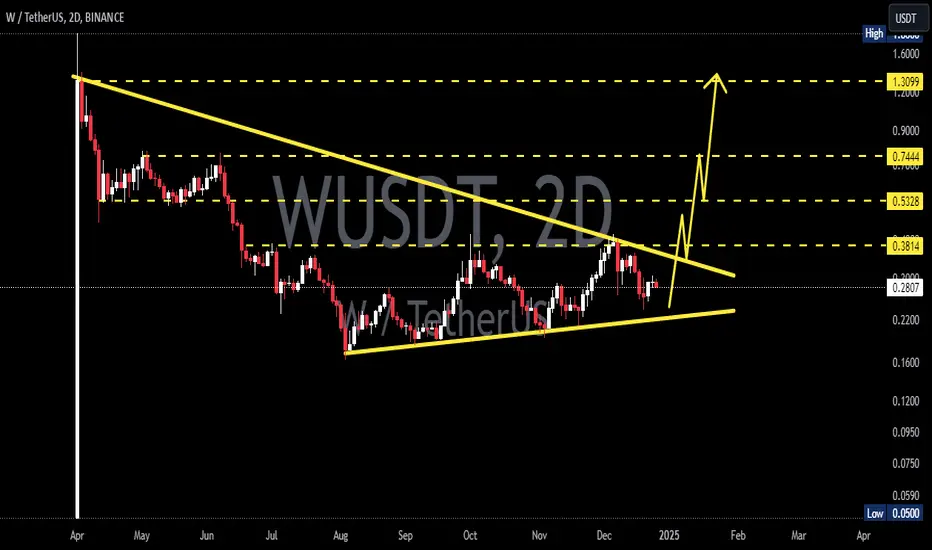
We have seen market creating multiple bottoming out around the 0.1947 zone, I would love to see price breaking out of the 0.2787 area and retest same before taking a long with targets at 0.5 and probably 1.3 area.
For every trade you plan to take, do a thorough analysis yourself as past results does not guarantee future results. #WUSDT
WUSDT 3DW ~ 3D
#W If you still have Conviction on the coin,. Buy gradually within this pattern, with a minimum target of 20%+,. When this resistance line is successfully broken,. Bulls will start to dominate.
WUSDT Double Bottom Pattern: Preparing for a Significant RallyWUSDT Technical analysis update
WUSDT's price broke the double bottom neckline resistance line a few days ago after 175 days of downtrend. The price is now retesting this level and preparing for a move to new highs.
And Price formed a flag pattern just above the resistance line in the 1H chart.
Regards
Hexa

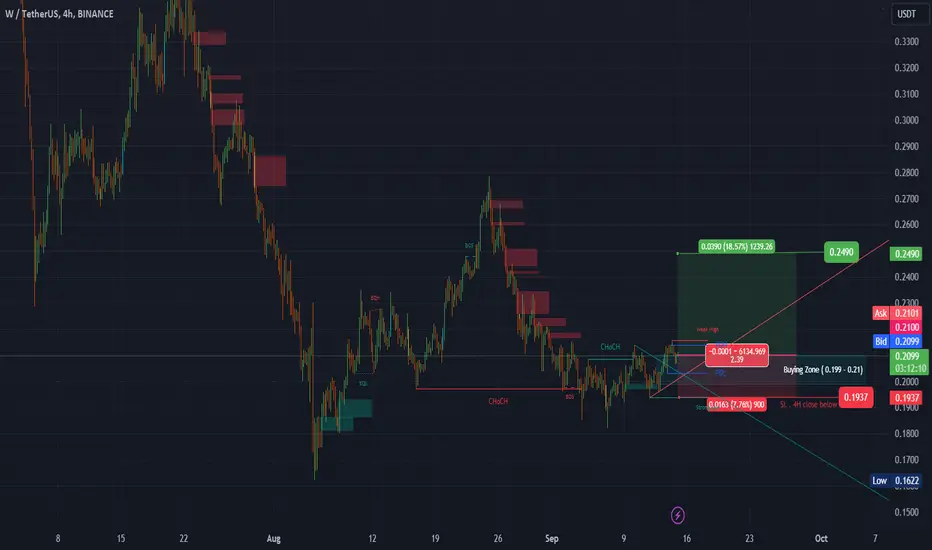
#W (SPOT) entry range( 0.199 - 0.21) T.(0.249) SL (0.1937)entry range ( 0.199 - 0.21)
Target(0.249)
SL .4H close below (0.1937)
1:2 Trade
**** #Manta ,#OMNI, #DYM, #AI, #IO, #XAI , #ACE #NFP #RAD #WLD #ORDI #BLUR #SUI #Voxel #AEVO #VITE #APE #RDNT #FLUX #NMR #VANRY #TRB #HBAR #DGB #XEC #ERN #W ****