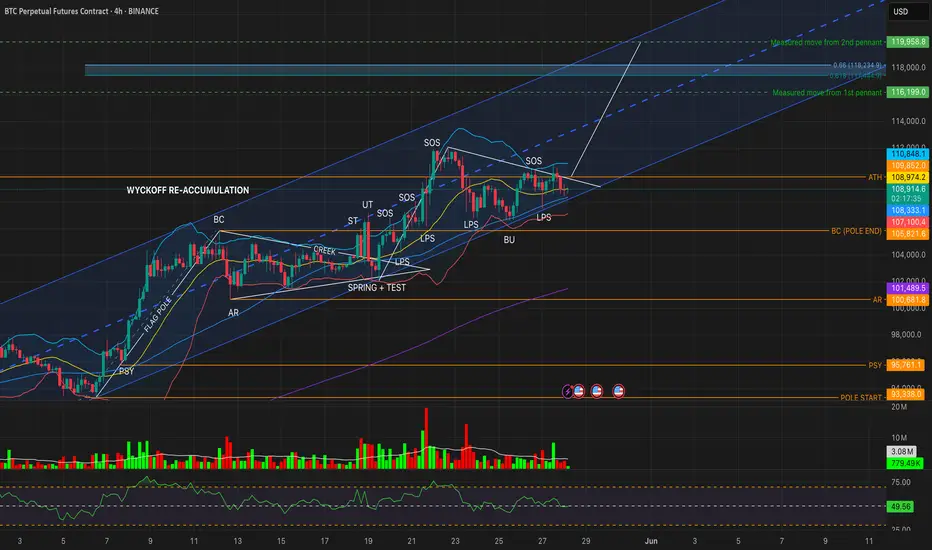
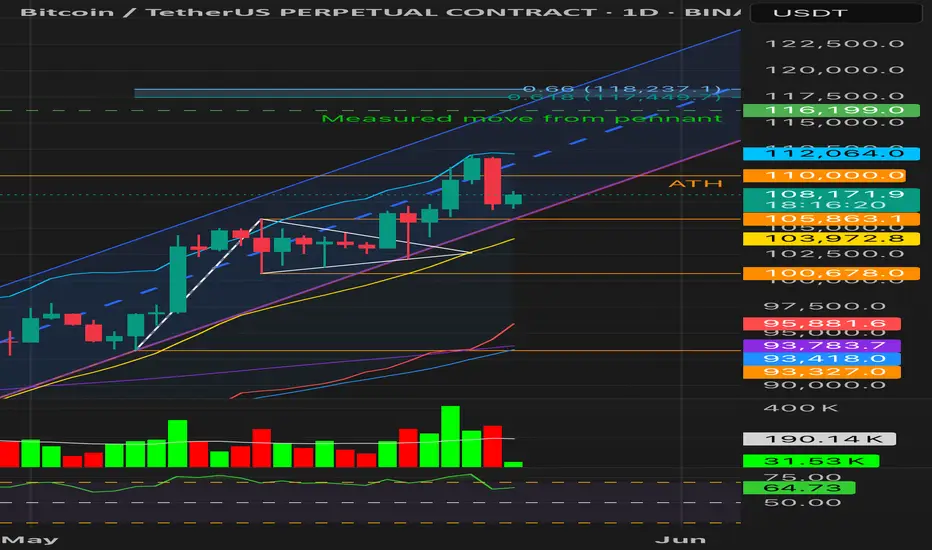
BTC 4H – Final Shakeout Before Markup?Bitcoin continues to coil below ATH resistance, now forming a second symmetrical pennant after the first flagpole breakout. Price is wedged between the ascending trendline support and persistent ATH rejection (~109.8K) — and the next move could define the entire Phase D → Phase E transition.
🧠 Wyckoff Reaccumulation Context:
✅ Spring + Test confirmed ~May 19
✅ Multiple LPS retests held around 107–108K
✅ Two clear SOS rallies tested above the creek
📌 Currently in late Phase D, facing third rejection from ATH
⚠️ Compression Observations:
RSI (14): 49.88 → neutral to bearish momentum
Volume: No conviction from either side
Lower BB + BU lows (~107K): A logical Spring zone for a potential wick-down fakeout
Price remains within channel and trendline support
🔄 Key Scenarios:
🟡 Bullish (Spring + Markup)
Wick below trendline to 107K zone
RSI bounce + green volume spike
Break + close above 110K → Confirms Phase E Markup
🎯 Targets:
Measured Move 1: 116,199
Measured Move 2 (Pennant): 119,958
Fib Cluster: 117,444 – 118,234
🔴 Bearish Breakdown
Close below 107K LPS with volume
RSI drops < 45
Structural failure → risks reversion to AR (~100.6K) and possibly BC
🧭 Conclusion:
Bitcoin is in the decision apex of a second pennant. If we see a wick-down + bounce (Spring-like behavior), it could be the last reload before a markup wave.
But without volume and momentum, this remains a fragile structure — stay patient, let the chart confirm.
#Bitcoin #BTCUSDT #Wyckoff #Pennant #CryptoTA #BTC4H #VolumeAnalysis #RSI
Wyckoff
BTCUSDT 4H – Reaccumulation Apex Compression | Decision Time📌 Price is now being squeezed between major trendline support and ATH resistance (~110K) — forming an apex structure, typical of Wyckoff Phase D → Phase E transitions.
🧠 Wyckoff Structure So Far:
Phase A/B/C: BC → ST → UT → Spring → LPS
Phase D: Multiple SOS rallies followed by a BU (backup to edge of creek)
Now: Testing the upper boundary of the range again — is this the launch point for Markup (Phase E)?
🔼 Bullish Breakout Conditions:
✅ 4H close above 110,625
✅ Rising volume above 27.4K MA
✅ RSI > 60
🟢 Targets:
TP1: 116,199 (measured move from pennant)
TP2: 117,449–118,237 (Fib confluence zone)
TP3: Trailing TP with 1.0% callback
🔽 Bearish Breakdown Risk:
❌ Close below 107,867 with RSI < 45 + rising volume
Would signal failure of the BU and reversion toward:
BC: 105,863
AR: 100,678
📊 Indicators:
RSI: 55.77 (neutral/bullish)
Volume: Still below average — shows compression
55 SMA: 107,762.7
BB Midline: 108,653.9
⚖️ No hedge short entry valid yet
Let the apex resolve — patience until confirmation.
#Bitcoin #BTCUSDT #Wyckoff #CryptoTrading #TechnicalAnalysis #BTC

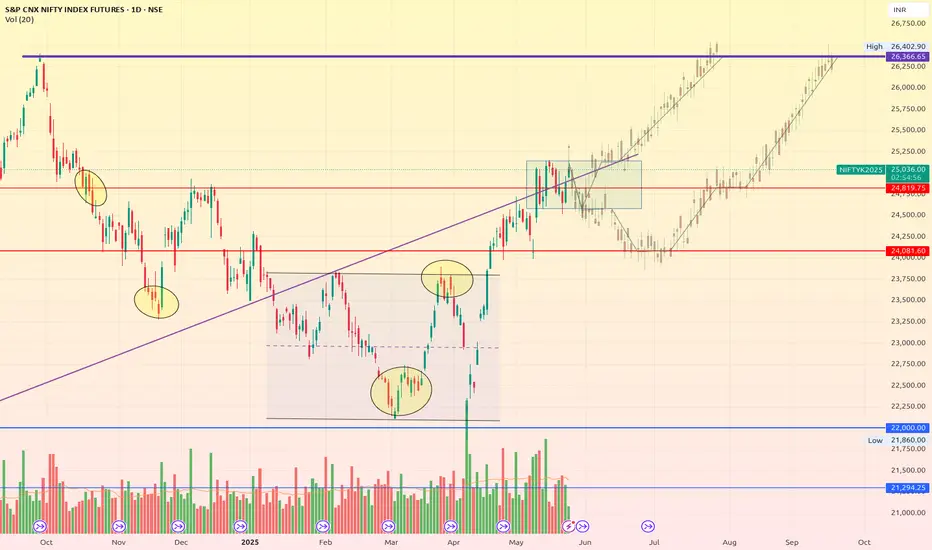
Path of Nifty 50 to 26KWe are trading in a tight trading range at the resistance, forming a classic Wyckoff reaccumulation structure at the micro-frame. We may or may not see spring shake out, but we should be ready for both.
BTCUSDT – Reaccumulation Breakout or Bearish S/R Flip?Timeframes: 1W • 1D • 4H
Structure: Wyckoff Reaccumulation nearing Phase E — but ATH is acting as resistance
🔹 WEEKLY OUTLOOK: Macro Structure Points to Markup
Last weekly candle closed above the reaccumulation Buying Climax (BC), showing bullish intent
Weekly upper Bollinger Band is rising toward 113k
RSI at 67, strong but not overbought
Structure suggests we’re entering Wyckoff Phase E
Weekly Targets:
🟢 TP1: 113,049 (Upper BB)
🟢 TP2: 116,199 (measured move)
🟢 TP3: 118,237 (Fib 0.66 extension)
🔹 DAILY OUTLOOK: Still Holding Above Reaccumulation Range
Multiple daily closes above the BU (backup) zone, but all below 110k ATH
RSI is strong (~66), and price is tracking near the upper BB, but volume is not convincing
Until a daily close above 110,000, breakout remains unconfirmed
🔹 4H OUTLOOK: Structure Valid, Momentum Rising
BU zone held; price made two lower lows followed by a higher high
RSI has reclaimed 57+, and volume is picking up modestly
4H structure looks like an early Phase E breakout attempt, but...
⚠️ Caution: Is This a Bearish S/R Flip?
While the broader Wyckoff structure suggests a transition into markup, we must also consider the bearish scenario:
BTC may be failing a support/resistance flip at 110k
All timeframes have rejected at or below 110k, despite multiple attempts
If we see a lower high under 109k + 1D close below 105,863 with red volume and RSI < 45 → this becomes a confirmed bull trap
📊 TL;DR:
BTC is structurally bullish — but we are at the final test zone.
🔓 Breakout confirmed: Daily close above 110k
🔒 Failure confirmed: Close below 105,863 + red volume + RSI breakdown
Stay nimble. This is either the last shakeout before markup… or the top of the range before reversal.
#Bitcoin #BTCUSDT #Wyckoff #CryptoTrading #TechnicalAnalysis #Reaccumulation #Breakout #SupportResistance
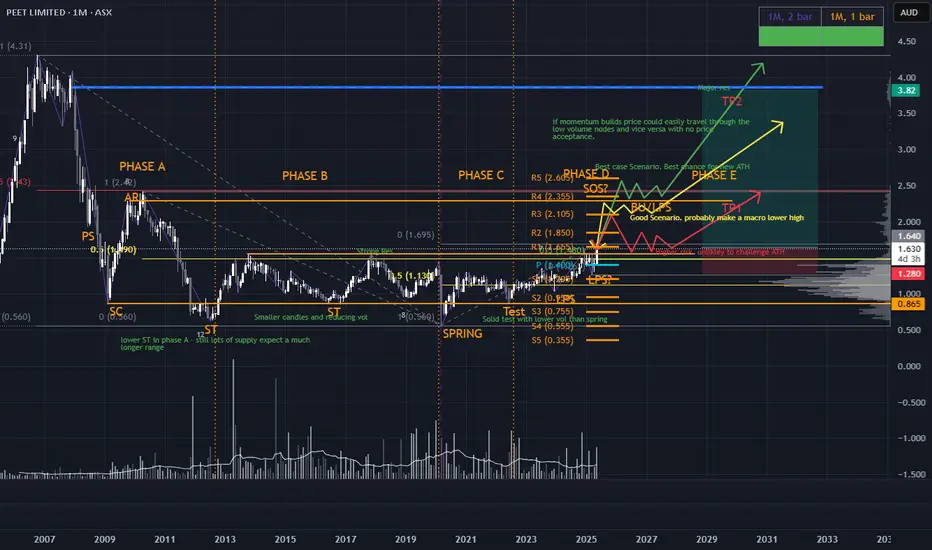
Looking for new ATH for PPC?Interesting chart with a few options. Overall, liking the current 4th time breakout (pending current monthly close), but must be careful as it's a small cap. The range has been developing well since 2009 with price now in a clear uptrend. We're now expecting a SOS to range highs/major 50% level followed by a pullback to continue into phase E. Once we get the pullback there isn't much resistance until the supply structure then near ATHs
*please note the lines are not time analysis just price pathing
Bitcoin Breakout Under Threat or Bullish Retest?1D Chart
• Price broke above ATH (~110K) on May 22 with a +1.87% gain, backed by strong volume (~413K vs 190K avg) — signaling legitimate breakout intent.
• May 23 followed with a -3.93% bearish engulfing candle, closing back below ATH on elevated sell volume (~279K).
• Despite the rejection, the breakout bar showed no upper wick exhaustion, so not a blow-off.
• RSI = 63.26 — still bullish but curling down.
• Price is testing the channel midline; Fib extensions (117.4K–118.2K) remain unmet.
Conclusion: Initial breakout was technically valid and volume-confirmed, but price is now under threat.
Loss of 103.9K would invalidate the structure and raise distribution risks.
⸻
4H Chart
• Price closed 4 times below mid-Bollinger Band — short-term momentum has weakened.
• RSI bounced back above 50, avoiding breakdown territory.
• Volume is tapering (weekend), and price is hovering just above the previous LPS zone.
• Watching for resolution from a potential Backup (BU) retest.
⸻
Wyckoff View
• Still within Phase E of re-accumulation — unless 103–105K breaks decisively.
• Valid structure: Spring → LPS → SOS → BU(?)
• A break below structure = possible UTAD scenario
⸻
Key Levels
• Support: 105,863 / 103,986 / 100,678
• Resistance: 110,000 / 112,100 / 116,199
• Target Extension Zone: 117,449 – 118,237
BTCUSDT 4H — Re-Accumulation in Play or Breakdown Brewing?Bitcoin is currently testing a critical confluence zone just below the prior ATH breakout (110k). After a clear Sign of Strength (SOS) breakout, price has retraced to retest the:
🔸 Mid Bollinger Band (108.9k)
🔸 Previous ATH breakout zone
🔸 Local channel support & uptrend line
RSI is neutral at 50.76 and volume remains slightly elevated — suggesting a potential BU/LPS retest phase in this Wyckoff re-accumulation.
📉 Breakdown Risk?
So far, no breakdown triggers confirmed per our risk model:
⛔ Price > lower BB (104.5k)
⛔ RSI > 45, not in weak momentum
⛔ No pattern breakdown with RSI < 40
That means no short hedge activated yet — but caution is warranted. A close below 104.5k with weak RSI & volume spike would invalidate the bullish structure.
🎯 Upside Targets if BU Holds:
Resistance: 113.2k (Upper BB)
Measured move from the pennant: 116.2k
Further confluence at 118.2k (Fib 0.66 extension)
🧠 Weekend Watchlist:
Do not trade based on 4H chart to avoid fakeouts and traps. Use it as early signal and confirm with daily close!
🔹 Hold above mid-BB keeps re-accumulation valid
🔹 Breakdown below lower-BB = structural failure
🔹 Volatility likely to spike — stay risk-managed
📚 Still within Wyckoff markup logic unless proven otherwise.

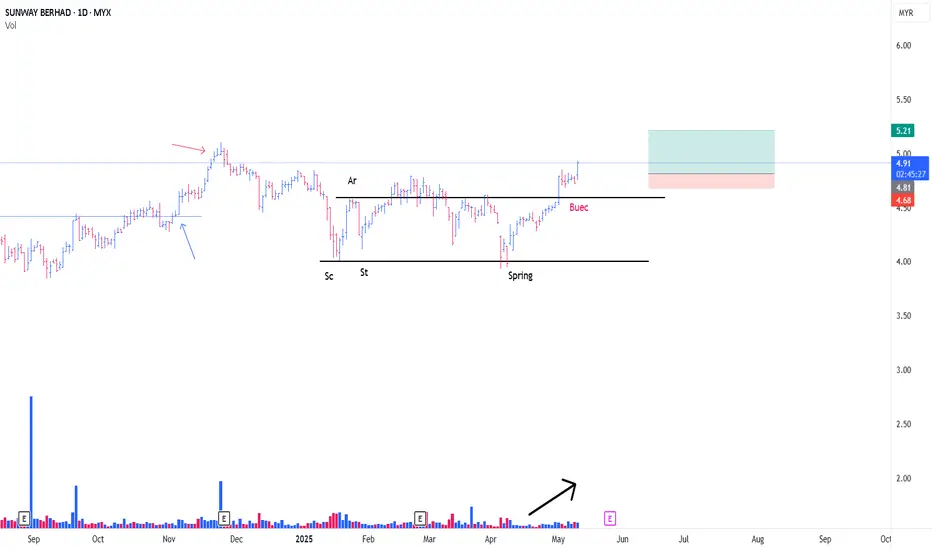
SUNWAY TO CONT MARK UPAs plotted , this is a rare Type #1 Schematic of Re-Accmulation
for a wyckoffian, our eyes are trained to spot any possible / confirmed Spring
Noticed the increase in Supply @ 9/5/25 (Black Arrow)
Despite that, Trigger Bar formed today
-This is A sign of SpringBoard that formed through absorption
As such, entry initiated as attached with a very tight SL
PureWyckoff
BTC Re-Accumulation Breakout | Daily Close Confirmed | Phase DBitcoin just confirmed its first daily close above the pennant breakout, reclaiming the previous ATH (~110K) with conviction.
We now have both structural breakout confirmation on the 1D chart and clear Wyckoff Phase D progression on the 4H.
⸻
1D Chart Highlights:
• Daily Close: 110,993
• Breakout from bullish pennant
• Volume expanding into the breakout
• RSI: 75.38 → strong momentum, not overbought exhaustion
• TP Ladder:
• TP1: 112.8K (Upper BB)
• TP2: 116.2K (Fib 0.618)
• TP3: 118.2K (Fib 0.66 + trailing)
⸻
4H Chart Highlights (Wyckoff Re-Accumulation):
• SPRING → TEST → LPS → SOS
• Structure has shifted into Phase D
• Currently forming a BU→ATH zone retest (textbook Back-Up)
• Volume declining, showing lack of supply
• RSI: 67.60 (bullish territory)
⸻
No Short Hedge Triggered
⸻
Summary:
This is a low-risk consolidation above previous ATH, backed by strong momentum and classic Wyckoff mechanics.
As long as BTC holds above ~110K and volume remains controlled, bullish continuation toward 116–118K remains the base case.
⸻
#Bitcoin #BTCUSDT #Wyckoff #Crypto #Reaccumulation #Breakout #TradingView #TechnicalAnalysis #PhaseD

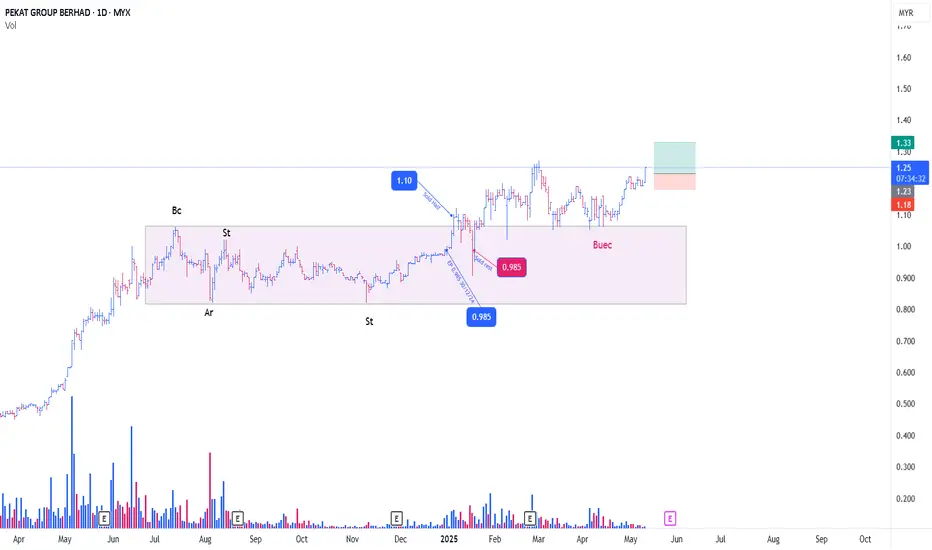
PEKAT MARKING UPA Type #2 of Re-Accumulation Schematic
previous entry as attached (not too much profit secured)
Past few days noticed the BUEC (phase D)
With that in mind, possiblity starting of the campaign for phase E, which is price to mark up outside the Trading Range (BOX)
With A Trigger Bar today, position initiated with tight risk
PureWyckoff
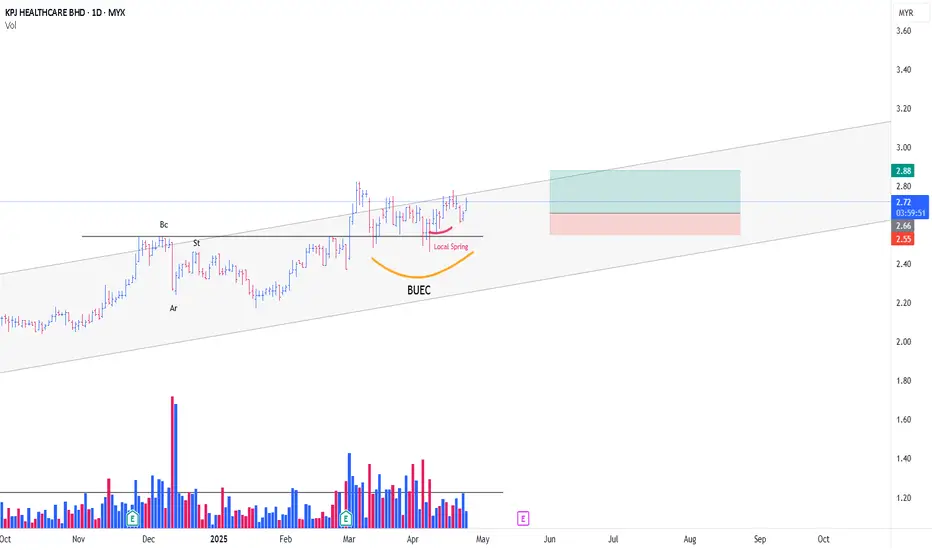
KPJ MARKING UPAn Atypical Re-Accmulation Scehmatic # 2 (The rising bottom)
Very Straighforward Chart
- BUEC in Action (yellow Line)
Noticed the formation of SpringBoard (Red Line)
-Position initiated @ 10/4/25 & 15/4/25
-interestingly, there is a an atypical local spring with huge vol,
that 'looks' like a success 'test' after that
Tight SL (Original SL moved up)
PureWyckoff
BTC | Testing ATH — Breakout or Trap?Daily close just under ATH at 109,609
We had only 1H confirmation above ATH, with the first 4H close above ATH likely in 30 minutes. The breakout volume is well above average (Volume MA: 172.89k), but daily candle still below resistance.
This could be:
• A Sign of Strength (SOS) transitioning into Phase E markup,
• Or a premature breakout without higher timeframe validation.
⸻
Breakout Validation Checklist:
1. 1H Close Above ATH (~110k) ✅
▸ Initial signal confirmed, but not sufficient alone.
2. 4H Close Above ATH (Pending ~30 mins)
▸ Must close above 110k, with no strong upper wick.
▸ Confirms intermediate-term strength.
3. Daily Close ≥ 110k
▸ Still missing. Required for macro breakout confirmation.
▸ Watch for candle body, not just wick.
4. Throwback & Support Hold at 109.6–110k
▸ Ideally after 4H confirmation, a retest and bounce = textbook
SOS → BU → Markup pattern.
5. Invalidation Risks:
▸ Daily close <109k with high volume
▸ RSI divergence on 4H
▸ Rejection from 114k–116k Fib cluster
▸ Large bearish engulfing below ATH
⸻
Wyckoff Context:
We’re likely in Re-Accumulation Phase D, testing the breakout.
No signs of UTAD or distribution — but low conviction breakouts at ATH are known trap zones.
⸻
What’s Next?
If 4H + Daily confirm, momentum may push toward:
• TP1: 114,449 (Fib 0.618)
• TP2: 116,199 (Measured move)
• TP3: 118,237 (Upper Fib extension)
⸻
Follow for real-time BTC setups based on structure, RSI, and volume — no hopium.
Like & share if this helps clarify the levels you’re watching.

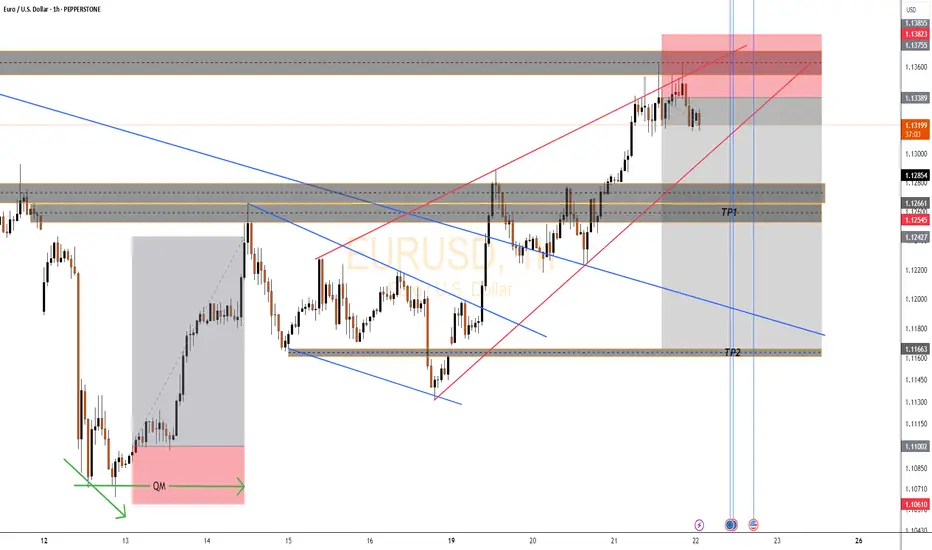
EURUSD Bearish Setup📌 Market Structure & Setup Summary
Major Supply Zone Rejection (Red Zone at Top):
Price tapped into higher timeframe supply zone at 1.13755 (red box).
This was a buy-side liquidity grab just above the previous high → textbook distribution zone.
Now price is respecting that zone and rejecting it with bearish momentum.
Bearish Rising Channel Broken:
Red trendlines show a rising wedge → often leads to a bearish breakout.
Price is currently breaking out of that wedge to the downside.
Premium Pricing Confirmed:
Price was pushed into the premium zone (above equilibrium), inducing buy orders → now being reversed.
🔄 Trade Plan (Short Bias)
✅ Entry: Activated inside the red supply zone after confirming wick rejections and structure shift.
🛑 Stop Loss: Above the red supply zone (above 1.13755).
🎯 Targets:
TP1 → 1.12545: Structure support and breaker block.
TP2 → 1.11663: Previous demand zone and trendline intersection.
TP3 (Optional) → 1.11002 – 1.10610: External liquidity + trendline + FVG zone.
📉 RR Ratio: Estimated 1:4 to 1:5+ if TP2/TP3 hits.
⚠️ Key Confluences
🔹 Bearish break of rising wedge = structural shift.
🔹 Rejection wick inside red supply + BOS.
🔹 TP zones aligned with previous OB, breaker blocks, and liquidity pools.
🔹 News/volatility likely during the double blue vertical lines, so expect reaction spikes.
🚫 Invalidation Criteria
If price closes above 1.13755, the idea is invalid.
Watch for manipulation or false breakouts during high-impact news.
🔮 Market Forecast
If current rejection holds, expecting price to seek sell-side liquidity from 1.12545, then 1.11663, and possibly lower. This is a classic distribution > BOS > retrace > expansion sequence.
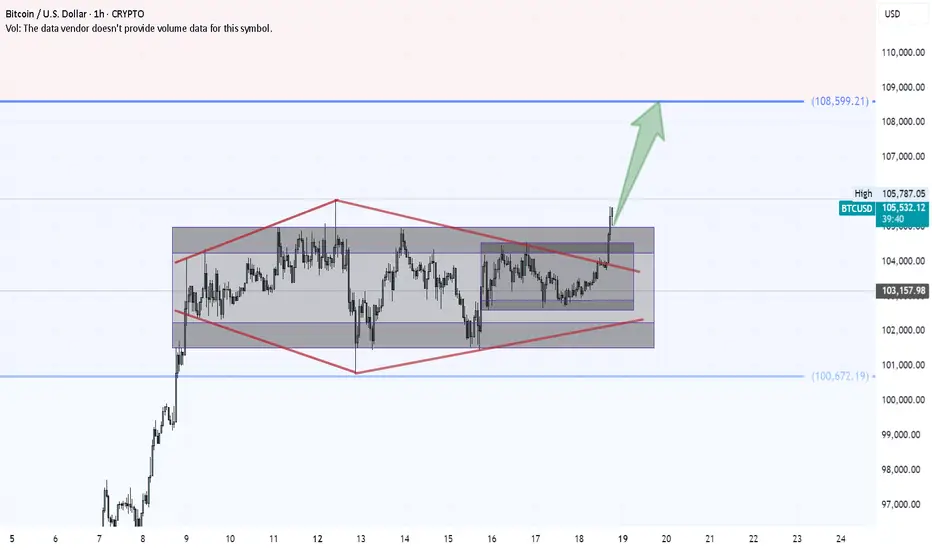
Bitcoin: Precision Breakout in MotionBitcoin is moving steadily toward its next major target—step by step.
A breakout from a rare double inside Wyckoff structure, confirmed by a diamond continuation pattern, has put the bulls back in control. The technical roadmap points us toward the next key level at $108,600.
Let's meet there!
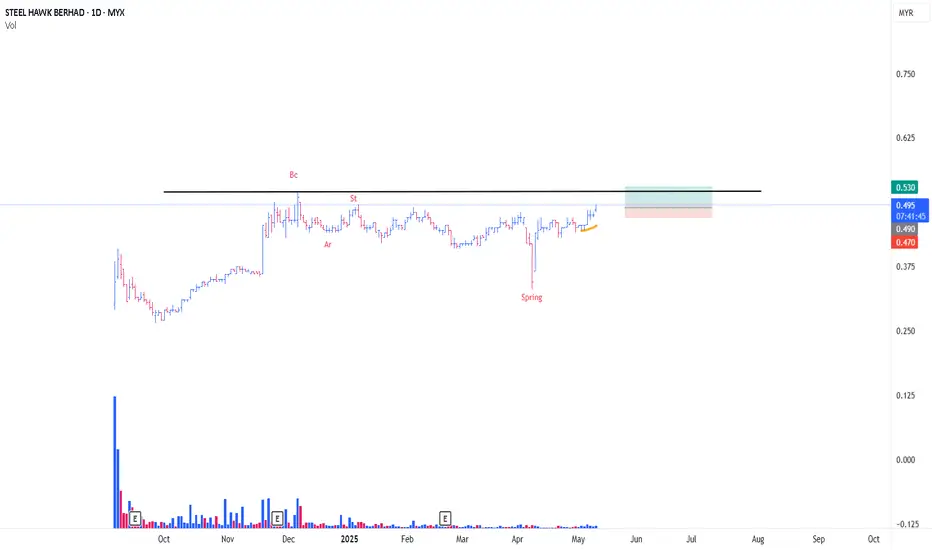
HAWK MARKING UPA rare Schematic of, Re accumation #1
Based on a lengthy causal for a marking up (3rd Wyckoff Law)
Spotted Spring Board past few days (Yellow Line)
Thus, with trigger bar today, position initiated with tight risk
PureWyckoff
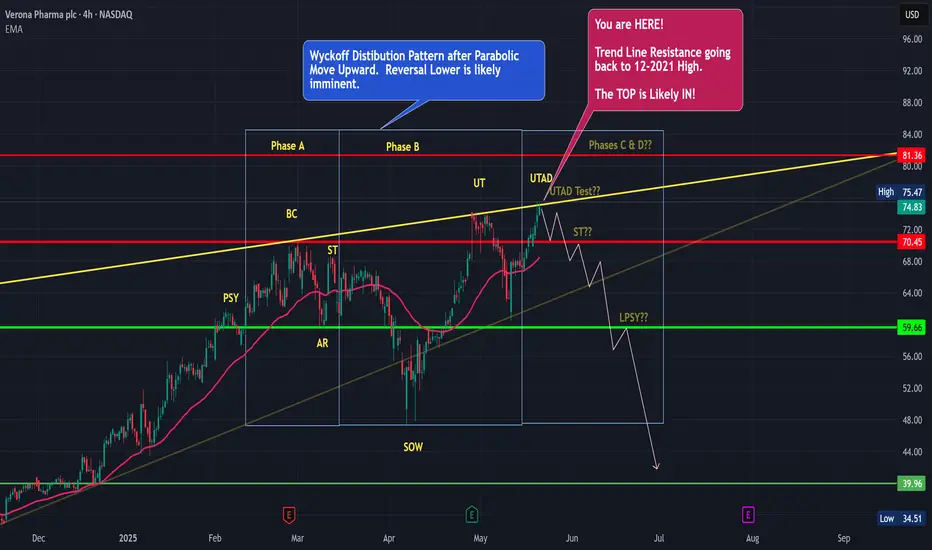
VRNA Likely Wyckoff Distribution with Topping pattern - SHORT!VRNA has had a Parabolic Run higher with Price > 2 Standard Dev from Mean for 11 WEEKS before showing weakness and Selling to $48 range. Price is forming a pretty picture perfect WYCKOFF Distribution. I believe we have just had the UTAD (Up Thrust After Distribution) Likely, we have lower prices in store.
Target Price $41.36.
Trade what you see.
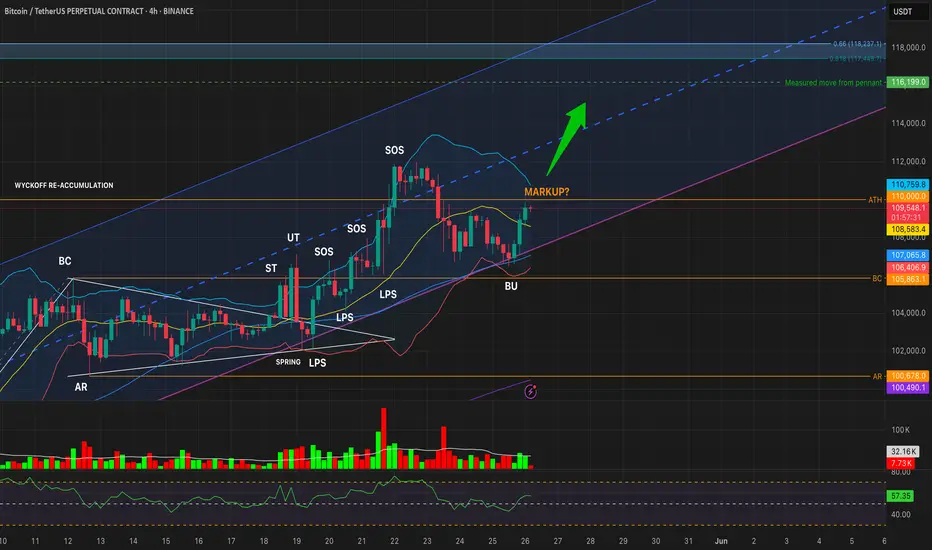
Wyckoff Re-Accumulation – LPS in Play (BTC 4H)
After weeks of sideways action, Bitcoin shows classic **Wyckoff Re-Accumulation** behavior:
### 🧱 Phase Breakdown:
🔹 **Phase A**
* **PSY**: Initial supply surge
* **BC**/**AR**: Range boundaries established
🔹 **Phase B**
* **ST**: Testing top of range
* **UT**: Upthrust above resistance, followed by rejection
🔹 **Phase C**
* **Spring**: Trap move below major trendline
* Cleared liquidity, shook out weak hands, rebounded fast
🔹 **Phase D**
* **LPS**: First higher low after spring
* **SOS**: Breakout from resistance on strength
* **LPS?**: Ongoing retest, holding higher low structure
---
📈 If current LPS holds, this confirms Phase D and opens the path to **Phase E (markup).**
💡 A valid Spring + LPS combo can be one of the highest R/R setups in Wyckoff methodology.
#Wyckoff #BTC #ReAccumulation #Spring #CryptoTrading

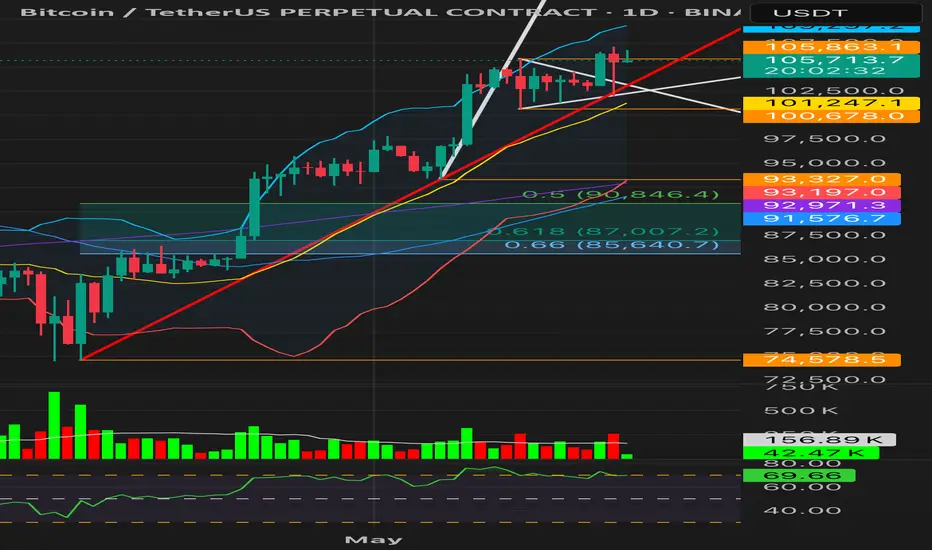
BTC – Distribution Denied. Reaccumulation Confirmed?
Timeframes: 1H (breakout retest) | 1D (macro continuation)
⸻
Updated Context
BTC invalidated the LPSY scenario on 1H:
• Price broke above the golden pocket (0.618–0.66)
• Also cleared the symmetrical triangle range high
• Now retesting the breakout with declining volume = classic reaccumulation behavior
The earlier 1H structure mimicked distribution, but failed to follow through. There was no markdown — instead, price reclaimed the range.
⸻
Daily Chart Support
• Second daily close above triangle apex
• RSI > 70 (currently ~70.3) → sustained bullish momentum
• Yesterday’s candle: long lower wick + above-average volume = demand stepping in
• Structure is building above $100K, which had been a major psychological barrier since Dec 2024
⸻
$100K – The New Base
BTC has tested and reclaimed $100K multiple times (Dec, Jan, May).
Now it’s acting as a macro accumulation floor, not resistance.
The longer price holds above this zone, the higher the probability of explosive continuation.
⸻
Next Levels to Watch
• Support (retest): 105.3–105.8K
• Validation: Strong 1H or daily close above 107.1K
• Targets: Upper BB (109.3K), then psychological round number → 110K
⸻
Conclusion
The bearish 1H thesis is now invalid.
BTC is above the range, retesting it, with macro structure and momentum on its side.
This is how reaccumulations trap early shorts and fuel the next markup.
#BTC #Bitcoin #Crypto #Reaccumulation #Wyckoff #Breakout #100K #TriangleBreakout #BTCUSDT #PriceAction
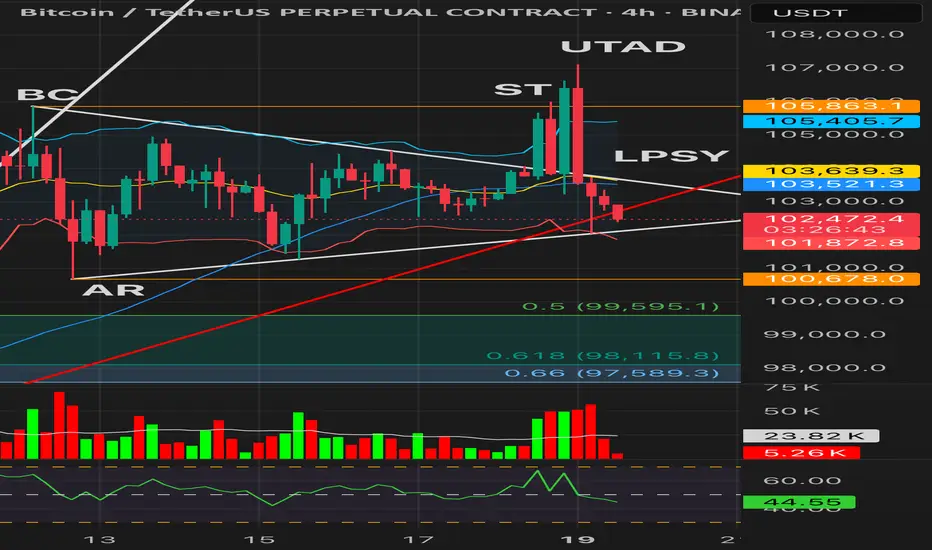
Wyckoff Distribution Unfolding: UTAD Confirmed, LPSY In ProgressThe 4H BTC/USDT chart presents a textbook Wyckoff Distribution structure nearing completion:
• Buying Climax (BC) defined the supply ceiling
• Secondary Test (ST) confirmed resistance zone
• Upthrust After Distribution (UTAD) swept above 106K, trapping late breakout buyers
• Price is now back at triangle support, potentially forming Last Point of Supply (LPSY)
Technical Snapshot (4H):
• Current Price: 102,540
• Bollinger Bands:
▸ Upper: 105,400
▸ Basis: 103,522
▸ Lower: 101,884
• 55 SMA: 103,642
• RSI: 44.85 (bearish momentum)
• Volume: Red bars rising, above 23.7K MA
What to Watch For:
A confirmed close below the triangle apex and lower Bollinger Band, with RSI below 45 and increased volume, would solidify the LPSY and trigger a likely markdown phase. Until then, the structure remains vulnerable but unconfirmed.
Bearish Targets (if breakdown confirms):
• TP1: 100,678 (horizontal + psychological)
• TP2: 99,595–98,115 (Fib retracement zone)
• TP3: Trail below breakdown with 1% callback logic
Wyckoff Perspective:
This appears to be Phase C, following a clear UTAD. If LPSY forms and support breaks, the market transitions into Phase D with accelerated markdown potential. Holding here may imply range extension or reaccumulation — next 1–2 candles are pivotal.
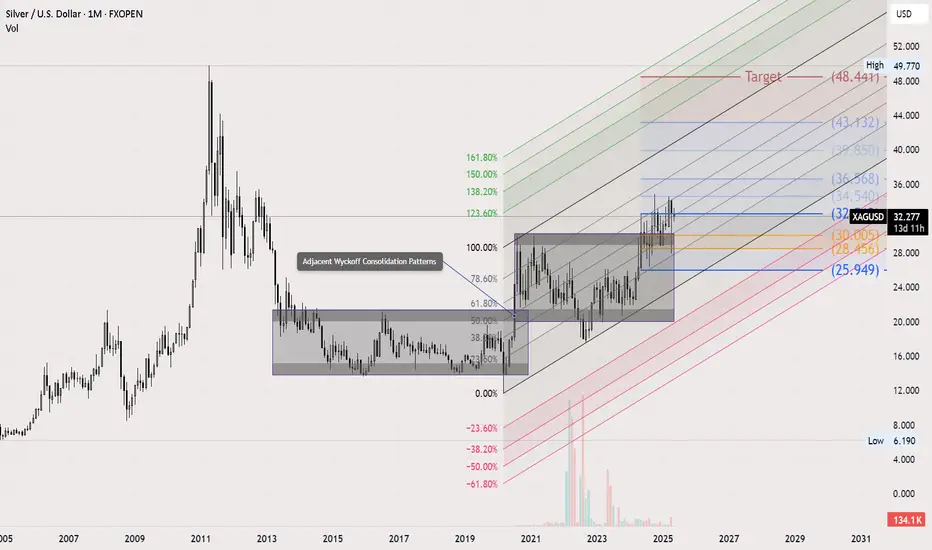
Silver Long-Term Outlook: Wyckoff, Fibonacci & Volunacci in PlayOn the monthly chart, Silver is showing a strong setup for long-term investors. We can clearly identify two adjacent Wyckoff accumulation patterns, signaling institutional accumulation phases.
Price action is following an ascending Fibonacci channel, reflecting a steady bullish structure. After breaking out of the second Wyckoff pattern, a Volunacci projection has formed—pointing toward a potential move to retest its historical high near $48.
This alignment of classic technical patterns with volume-based projection tools strengthens the long-term bullish case for Silver.
NIFTY1! (NIFTY50) Wyckoff ConsolidationNifty has most probably recorded a selling climax. Now, it's in the consolidation phase, and we're expecting a shakeout, too. It's very unlikely to go further down, but you never know. You must plan for both scenarios to stay in the game. Be market with you.

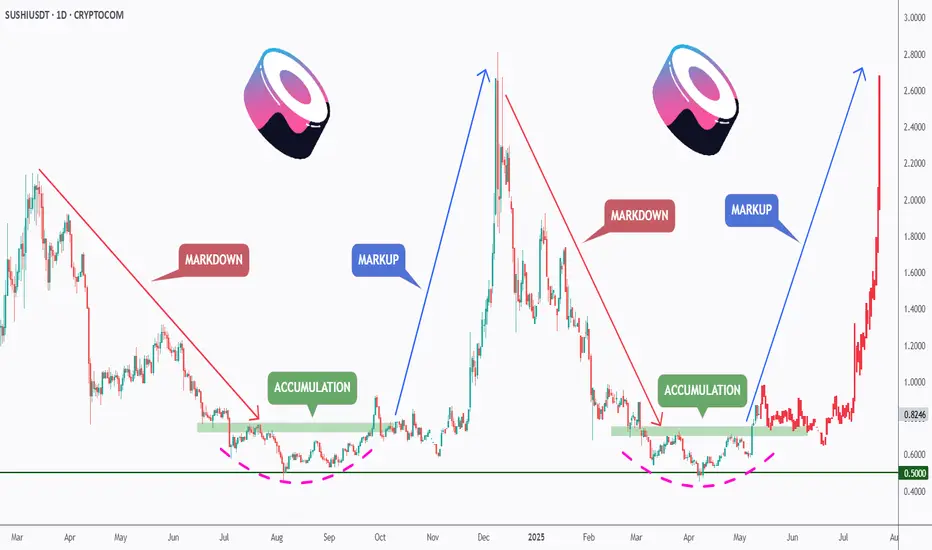
SUSHI - History Repeating Itself!Dear TradingView community and fellow traders,
I am Richard, also known as theSignalyst.
I find the SUSHI 🍣 daily chart intriguing , as it seems to be following the classic Wyckoff Cycle 📈.
If history repeats itself, we’ve just broken out of the accumulation phase ✅, highlighted in green 🟩.
As long as the bulls 🐂 remain in control, the markup phase may have just begun—potentially pushing SUSHI as high as $2.5 🚀.
❓ What's next?
Will SUSHI continue to trade higher from here, or will this cycle play out differently?
I hope you find this post useful, and I would appreciate your likes and support.
Which scenario do you think is more likely to happen first? and why?
📚 Always follow your trading plan regarding entry, risk management, and trade management.
Good luck!
All Strategies Are Good; If Managed Properly!
~Richard
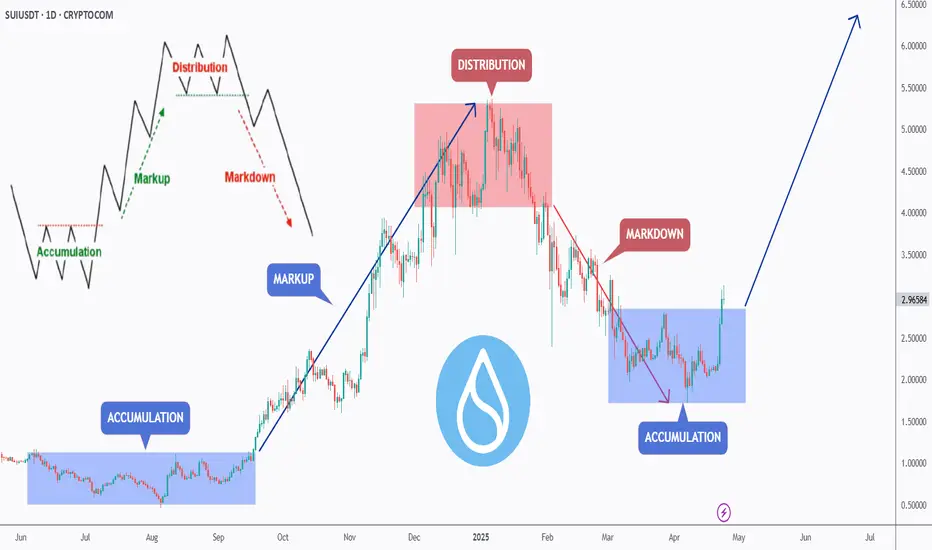
Wyckoff Cycle - Practical Example (SUI)Dear TradingView community and fellow traders,
I am Richard, also known as theSignalyst.
I find the SUI daily chart to be intriguing as it appears to be following the famous Wyckoff Cycle.
I would like to apply Richard Wyckoff's four market stages/phases to this chart for analysis as a practical example.
1️⃣ Accumulation
SUI rejected the $0.50 round number and entered an accumulation phase, consolidating for several months.
2️⃣ MarkUp
After breaking above the accumulation range at $1, SUI kicked off the markup phase.
3️⃣ Distribution
SUI found resistance at the $5.50 round number, with the lower bound of its range near $4—forming a wide distribution phase.
4️⃣ MarkDown
Once SUI broke below the $4 major low and exited the distribution zone, it transitioned into the markdown phase.
🔄🔄🔄🔄🔄⬇️
1️⃣ Accumulation
After finding support around the $2 round number, SUI hovered within a range, forming another accumulation phase.
2️⃣ MarkUp
We're here 🙂 This week, SUI broke above the $2.80 major high and the accumulation range—signaling the beginning of a new markup phase.
❓ What's next?
Will SUI continue to trade higher from here, or will this cycle play out differently?
I hope you find this post useful, and I would appreciate your likes and support.
Which scenario do you think is more likely to happen first? and why?
📚 Always follow your trading plan regarding entry, risk management, and trade management.
Good luck!
All Strategies Are Good; If Managed Properly!
~Richard