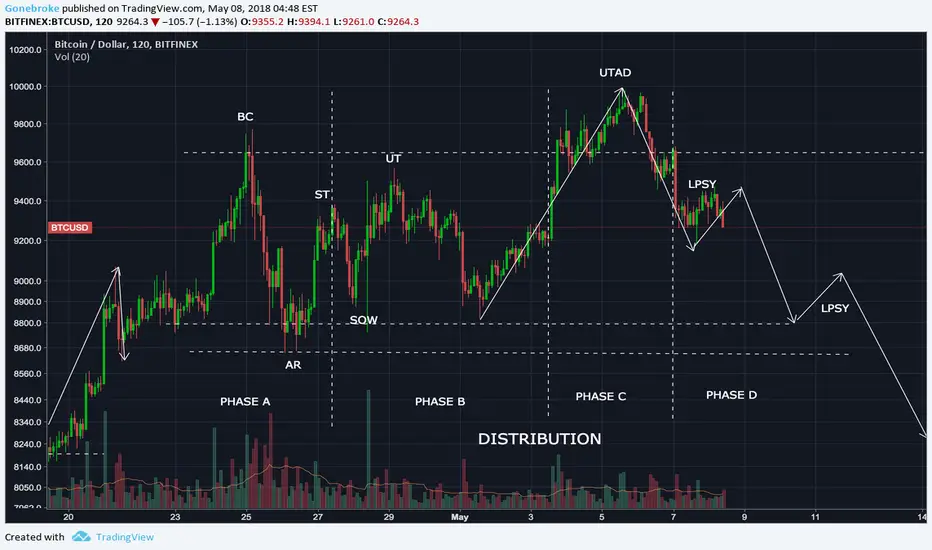
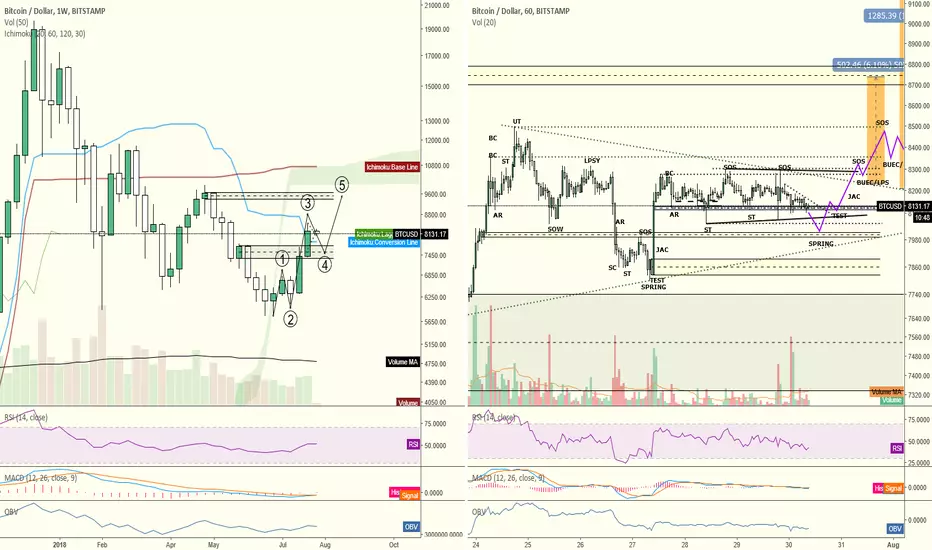
Bitcoin via Wyckoff and ElliottGood Monday morning, traders, and welcome back. Bitcoin had a quiet weekend ranging with price while nearing completion of its LPS (Last Point of Supply) in the form of a pennant. I believe this to be subwave 4 of the larger wave 1. As such, my expectation is that we will see price reach $8700/$8800 or $9200/$9500, with the latter being an extended subwave 5. Currently, I am still leaning toward that latter as it allows price movement up to the weekly box, so I would expect to see another SOS (Show of Strength) up to the former price and, at that time, another LPS, followed by the move up to the higher target. Often we see price dip below the pennant's support (usually in the form of a "spring") which tricks traders into going short. This, in turn, fills outstanding C.O. longs before price quickly reverses and heads in the other direction.
We closed bullishly on the weekly and have the monthly close hitting us tomorrow. I believe we will likely see sideways movement/consolidation to complete the LPS until the monthly close, at which time I expect to see strong movement up. I understand that traders are concerned with the 200 MA, but we have to remember that a moving average is nothing more than just that -- an average of (in this case) the previous 200 periods. As such, it does not keep price from moving up, rather it just tells us the strength of the movement (i.e. what has happened/what is currently happening, but not what is going to happen), which is why it appears to provide support and resistance but only until it doesn't anymore. Could price fail to move above the 200 MA? Of course it could, but that isn't because of some imaginary line that's keeping price from moving up. Rather, it's just a visual representation of lack of demand in relation to outstanding supply. If C.O. has removed enough loose supply from the market during this year's accumulation, then demand should outpace supply thereby chasing price up and through the 200 MA. We have breached the long-term descending wedge's resistance and currently remain above it, so the expectation should be to continue moving upward rather than downward until proven otherwise.
Some traders are comparing this bullish trend to the April bullish trend and then suggesting price will fail at the 200 MA again, however they are not watching volume. During April's run, we saw volume start strong with the short squeeze but decrease with every new high. This time around, we see volume increasing with every new high. As such, volume is in agreement with price this time suggesting that we are in a strong bullish trend that should continue taking us higher.
This current Wyckoff labeling denotes an overall reaccumulation period divided into distribution, accumulation, and then reaccumulation on this smaller TF. On the larger TF, the lowest point should be the spring and the upcoming spring on the smaller TF should be the larger TF's test of support after July 27th's spring. As such, the following lower BUEC/LPS is for the smaller TF while the higher BUEC/LPS is for the larger TF. I usually go more in-depth in this during the daily live streams. Be safe trading and remember that the only thing you control is how much you lose, so risk management is the key.
Wyckoffdistribution
Bitcoin's engineered liquidity and removal of weak handsGood morning, traders. Hope y'all stayed safe during the move yesterday. There's a lot going on in this chart, but I wanted everyone to be aware of how we are watching price action play out.
As I discussed in yesterday's chart, and then expounded upon during the morning's live stream, there would be an attempt to push through the descending resistance line toward the horizontal channel's high but if that failed (if there wasn't any real follow through on the retail traders' side after C.O. started pushing price) then we would see C.O. put in a large sell order and remove their support to put a spring into action. This would test the available supply. A drop down on low volume would suggest that the market is ready to move up. However, a drop down on high volume would suggest the need for more accumulation.
We saw relatively high volume on that drop, so the expectation is to see more accumulation before another move up now and that's what appears to be happening at this time on a much smaller scale. Price's current position lines up with the bottom of the ascending yellow channel. If this holds and price continues higher, then we can expect a conservative target of the upper grey box at around $8900, though we could potentially see price reaching the top of the channel a few hundred dollars higher. As always, price does not have to remain within the channel. A strong bullish push often sees an extension beyond the top of the channel.
We can see price has printed a descending channel as denoted by the green lines with a descending broadening wedge inside of it denoted by the dashed red lines, and is being supported at the bottom of the previously drawn orange box within our grey box. This is creating a potential Swing Failure Point (similar to the Wyckoff Spring) within the smaller descending broadening wedge denoted by the black lines. A successful SFP will see price closing above that swing low (which it has done twice now). This should see price then pushing upward once it pushes through the top of the orange box. The red box (order block) above price is resistance, but a successful breach of the top of that box should see price rising back toward $8300. The only caveat is the mitigation block in green. Failure of price to breach the top of this block will see it dropping toward the next block at $7400/$7500. HTF is bullish, so the expectation is for price to continue higher rather than lower right now. But even if we see that drop toward the next block below, the expectation remains that we will head higher as it is another strong area and each of these blocks are full of long orders that didn't get filled the last time around just waiting to go long, so they are sucking up all of the orders that drop into them. Our final block becomes the $6800 area. Ultimately, failure of that area to hold is not good news for the bulls and we should expect to see price fall further at that point.
In terms of accumulation, the recent large white candle could be seen as a spring. That means we could see price potentially drop back down toward the dashed line around $7850/60 to test the spring's result before getting serious about moving upward. That successful test of the spring should then see price pushing up toward that red box at the top of the accumulation zone. This would potentially create an IHS which is a good indicator of completed accumulation especially as all this is happening in a support zone. The target on that IHS would be the top of the green mitigation box. At that point, a successful push through it indicates that demand is outpacing supply and price will rise higher. RSI looks great on most times frames as it is near/at oversold and printing potential bullish divergence.

Bitcoin Analysis - Textbook Case of Wyckoff Downtrend to $4,800In my last chart, I had emphasized that the Wyckoff's Spring is likely at the $6,000 level (aka The Walls of Westeros) provided that price bounces from $6,000 and not any higher. Why is that? Well, it is important to remember that the Wyckoff's Spring needs to be a lower low.
Of course, this is all based on the assumption that Bitcoin is really trending according to the Wyckoff Events. If that is truly the case, then the current downtrend should also follow other Wyckoff rules that govern a Wyckoff Bear Cycle like distribution, breakdown and markdown.
Out of curiosity, I created the above chart with all those rules applied and it turned out exactly like what a textbook Wyckoff Downtrend chart would look like. Here is a link for you to compare it:
d.stockcharts.com
You can understand more about Wyckoff Market Analysis here:
stockcharts.com
Please LIKE and FOLLOW if you enjoy this.

ICON - Reversal awaitingICX/BTC pulled back like the whole market and it's currently trading at its 0.236 Fib level. Between ~32k and ~34k is a nice buy range. If it falls below that, we might expect a full retracement back to ~28k.
ICON actually made a similar Wyckoff distribution pattern earlier this year.

Is BTC in distribution?Here's an idea I've been following for a while now on twitter (twitter.com). What if we're in Wykoffs distribution and markup is next?
The distribution schematic I'm working from is this - d.stockcharts.com
I'm looking forward to options and views on this.
FYI. I'm SHORT from $9860.